By Agnieszka Gautier
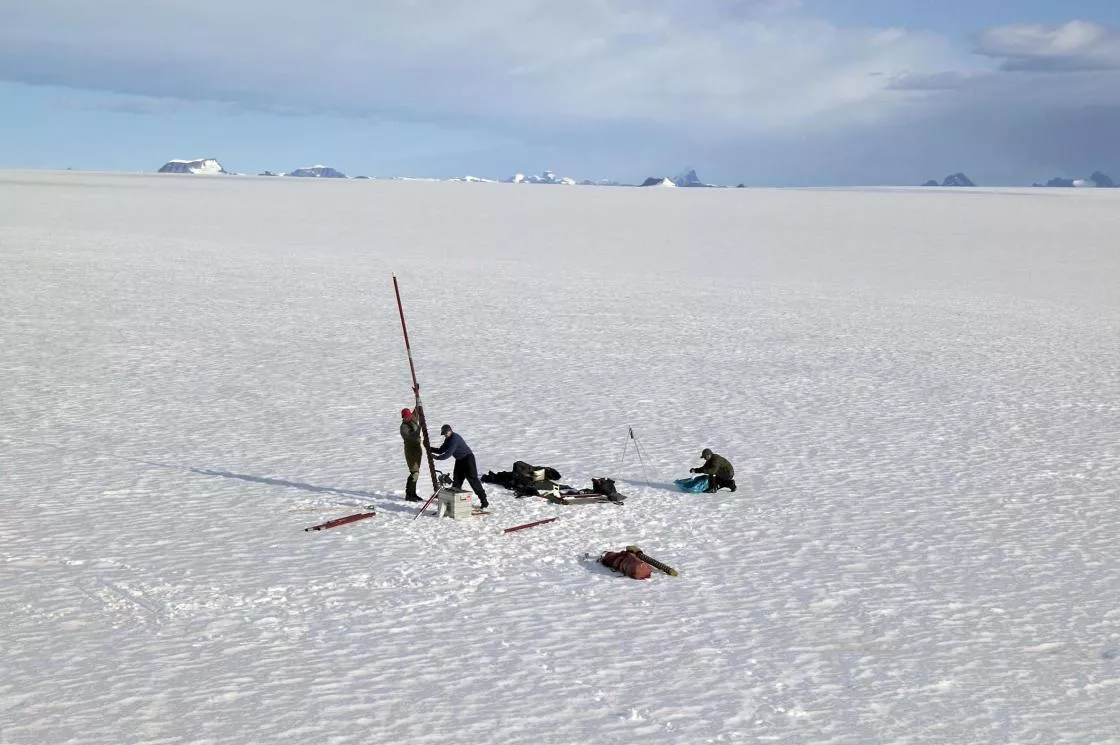
In the spring of 2011, a group of scientists on snowmobiles traversed southeast Greenland—an understudied area of the ice sheet known for its high snow accumulation. They chose a spot, set up equipment, and began drilling ice cores to analyze snowfall and thaw through the decades. But instead of pulling out a cylinder layered of snow and ice, they struck water. “This was a big surprise,” said Jason Box, a researcher for the Geological Survey of Denmark and Greenland, “because we were drilling before melt had begun.” So, this liquid water had survived the winter in its liquid state.
To ensure this was not a fluke, they moved their operation several kilometers away. And they hit water again within the firn, or partially compacted snow from previous years. After consulting airborne ice-penetrating radar instruments, the team mapped the aquifer’s size: about that of Ireland or the US state of West Virginia.
“We found a completely unknown storage mechanism,” said Richard Forster, a researcher at the University of Utah, “where liquid water is stored as a reservoir in the firn year-round.” Seasonal firn aquifers were already known to exist on mountain glaciers, but the Greenland firn aquifers were the first to be discovered that persisted all year. The discovery led to the creation of the term perennial firn aquifer, a year-round, water-bearing layer within the firn.
Since 2011, more discoveries of perennial firn aquifers have been made while questions have unfolded about their formation and impact on sea level rise.
“The big interest now is if these aquifers are accelerating ice flow, mass loss, and sea level rise,” said Julie Miller, who was a graduate student in Utah when the discovery was made and is now a researcher at the Cooperative Institute for Research in Earth Sciences (CIRES). “This is what everyone wants to know.”
Feather and air bubbles
Though no one knows how perennial firn aquifers initially formed, scientists do understand why the water does not freeze. “New snow acts like a thermal insulator,” said Forster. “Like a down jacket, the air space between the feathers—that’s what’s keeping you warm.” In a similar fashion, the air space between snow grains insulates liquid water.
But another process is also at work. “Certainly, some of that liquid water is feeling the cold atmosphere,” said Forster. As some of the water refreezes, it releases latent heat. Surrounding water absorbs this heat, and along with the snow insulation, provides enough warmth to maintain water in its liquid state.
“You get this aquifer in areas where there is a lot of melting and a lot of snowfall,” Box said. Perfect conditions for southeastern Greenland. But could more perennial aquifers exist elsewhere?
The eye in the sky: From field to space
Miller has worked to figure out how to find more perennial aquifers via satellite. Mapping, however, is difficult because very few instruments allow scientists to actually “see” beneath the ice sheet surface.
Luckily the scientists on the 2011 expedition had proof that airborne ice-penetrating radar could map aquifers—a NASA aircraft had done just that when it flew over their traversed region only 11 days prior to their drilling. This aircraft, part of NASA’s Operation IceBridge (OIB), used an Accumulation Radar system to probe the ice. By comparing their field measurements, the team confirmed that the OIB radar could map the presence and depth of the top water layer within the firn.
The Accumulation Radar, designed by the Center for Remote Sensing and Integrated Systems (CReSIS), sends a pulse of electromagnetic energy that propagates through the ice sheet, and as it hits different media—from air to ice or snow to water—the wavelengths reflect. Electrical properties also shift with density, and water is a great conductor. “When you hit a liquid layer, you get a really big reflection,” Forster said.
The radar profiled the top 100 meters (about 328 feet) of ice. The ice sheet in southeastern Greenland is about 800 meters (2,600 feet) thick, while the liquid is between 5 and 50 meters (16 to 160 feet) deep. This aquifer then rests in the upper layers of the ice sheet beneath the seasonal snow layer, within the firn. “It’s the only thing that really reflects quite like that. You can see it,” Miller said. “You can see its upper surface; how it undulates with the topography.”
Data from the Accumulation Radar and NASA Multichannel Coherent Radar Depth Sounder (MCoRDS), which are stored at the National Snow and Ice Data Center Distributed Active Archive Center (NSIDC DAAC), were used to map the Greenland aquifer.
More discoveries
Since the IceBridge mission, satellite data archived at the NSIDC DAAC and other organizations have allowed researchers to discover more perennial firn aquifers and examine their contribution to a rapidly changing cryosphere.
In 2018, using an earlier version of a data set from the Soil Moisture Active Passive (SMAP) satellite and the techniques developed for Greenland, Miller and another researcher at CIRES, Ted Scambos, discovered perennial firn aquifers on the Antarctic Peninsula within ice shelves, which are floating tongues of ice extending onto surrounding waters from the ice sheet. Ice shelves buttress the ends of glaciers, slowing their flow into the oceans. This discovery piqued interest in the mechanism behind the Wilkins Ice Shelf break up. Unlike the Larsen A and B break ups in 1995 and 2002, respectively, the Wilkins Ice Shelf was not known to have year-round water prior to its disintegration. Scientists knew that surface water trickles into the ice shelf, and initiates fracturing, but with no signs of this on the Wilkins Ice Shelf, they were unsure how it crumbled.
Miller reviewed airborne ice-penetrating radar data from an early British Antarctic Survey airborne radar campaign prior to the ice shelf’s break up. “I realized that the entire ice shelf may have been filled with water 20 meters (66 feet) thick at least as far back as 1966,” Miller said. “So, it has been present a long time.”
The question then remains, what was the trigger for the breakup? Do the aquifers initiate hydrofracture, a way of water drilling into the ice, which then causes the ice shelf to disintegrate?
More questions
How much water eventually enters the ocean from melting ice sheets has always been a key question in calculating sea level rise. "Now we have to really figure out how the water is moving through this aquifer system," said Forster.
It either does not go anywhere, or it migrates through the system, connects to crevasses or moulins, vertical pipelines to the ice sheet interior and base, and gets to the oceans, a process that may take a few years or decades. "In reality," Forster said, "it's probably some of each, depending on the location."
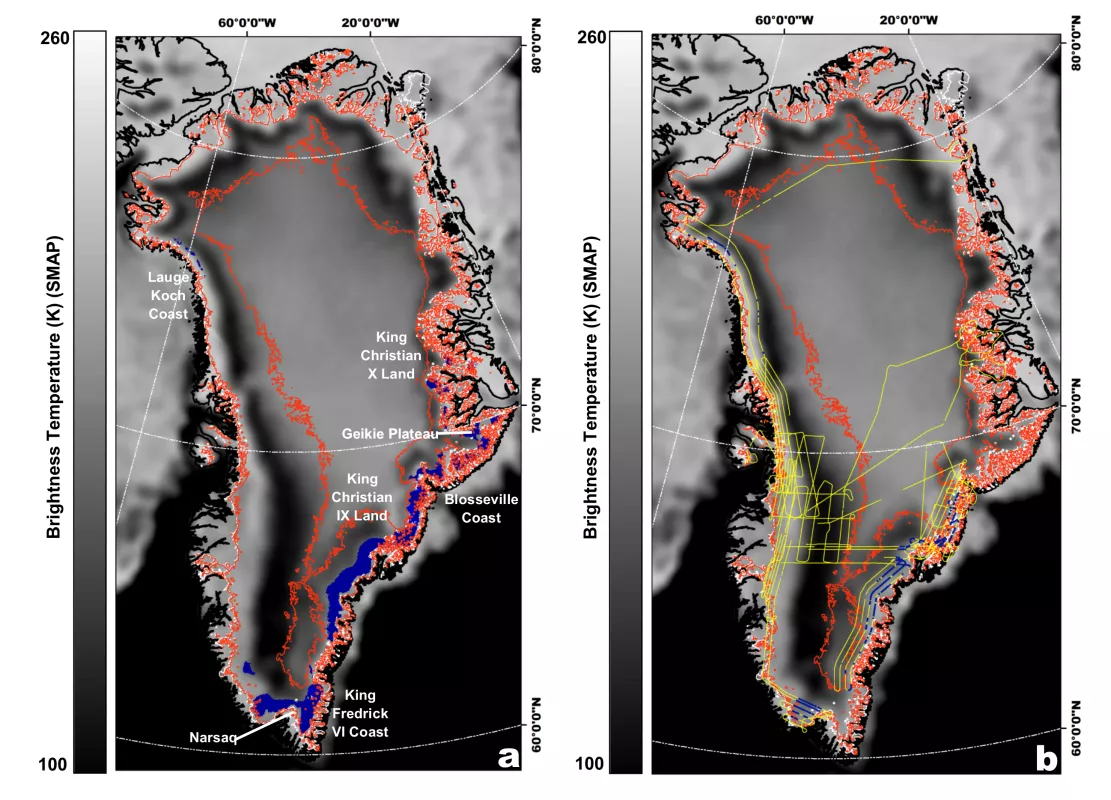
A modeling study published in 2017 connected a perennial firn aquifer, just upstream of the Helheim Glacier in Southeast Greenland, to potential fracturing and glacial acceleration by routing large amounts of water to the bed beneath the glacier outside of the melt season. Another study from 2022 used SMAP satellite data managed by the NSIDC DAAC to map perennial firn aquifers.
This data offers another way to look for perennial firn aquifers. SMAP uses a passive microwave radiometer to scan the Earth’s surface and translate the emitted energy into a series of signals. The L-band frequency on the SMAP satellite penetrates to a depth of 60 meters (197 feet) in areas of the ice sheet and ice shelves where perennial firn aquifers form. Using the NASA SMAP satellite, Miller and her team could infer an average spatial extent from 2015 to 2019.
Coming full circle: from space back to the field
Unlike the radar from Operation IceBridge (OIB), which shows the upper surface of a firn aquifer, or its depth, passive microwave radiometer data from satellite is more difficult to analyze.
“The data is complicated,” Miller said. “It gives you a signal and you have to interpret that to figure out what is actually there.” But satellites are more prevalent geographically and for longer periods than the selective flight lines from OIB. “With satellite maps, we can’t yet determine a distinct boundary or volume or depth,” Miller said.
Part of the reason for that complication is how the data are processed when averaging grid cells, which are 18 kilometers (about 11 miles) wide, presenting a fuzzy boundary. Sometimes deciphering the grid cell can be unclear. When big melt events occur, it can be challenging to distinguish what is a firn aquifer, a melt pond, or melt within the ice. All reflect similarly. “So, no matter how sophisticated the satellite, aircraft or computer model is, you always need to gauge its accuracy,” Box said. “Even very low-tech observations on ground tell us a lot.”
As the discovery of perennial firn aquifers has rippled across the glaciological field, scientists have been eager to understand their connection to climate change.
More fieldwork is necessary with potential studies dating the water using chemical analysis.
“Instrumenting perennial firn aquifers is critical to validate the satellite maps,” Miller said. Figuring out the depth and thickness of liquid water and how that changes over time is essential to knowing just how much water is stored and its overall impact on ice sheets and ice shelves. “We need to figure out the climate change response for this,” Box said, “and that could have fundamental implications for the ice properties and ice flow." Only then can contribution to sea level rise be accurately calculated.
References
Brodzik, M. J., D. G. Long, and M. A. Hardman. 2019. SMAP Radiometer Twice-Daily rSIR-Enhanced EASE-Grid 2.0 Brightness Temperatures, Version 1 [Data Set]. Boulder, Colorado USA. NASA National Snow and Ice Data Center Distributed Active Archive Center. doi:10.5067/QZ3WJNOUZLFK.
Brodzik, M. J., D. G. Long, and M. A. Hardman. 2021. SMAP Radiometer Twice-Daily rSIR-Enhanced EASE-Grid 2.0 Brightness Temperatures, Version 2 [Data Set]. Boulder, Colorado USA. NASA National Snow and Ice Data Center Distributed Active Archive Center. doi:10.5067/YAMX52BXFL10.
Forster, Richard F. et. all. 2013. Extensive liquid meltwater storage in firn within the Greenland ice sheet. Nature Geoscience. doi:10.1038/ngeo2043.
Howat, I. 2017. MEaSUREs Greenland Ice Mapping Project (GIMP) Land Ice and Ocean Classification Mask, Version 1. Boulder, Colorado USA, NASA National Snow and Ice Data Center Distributed Active Archive Center. doi:10.5067/B8X58MQBFUPA (last access: 27 January 2020).
Miège, C., R. R. Forster, L. Brucker, L. S. Koenig, et al. 2016. Spatial extent and temporal variability of Greenland firn aquifers detected by ground and airborne radars. Journal Geophysical Research-Earth, 121, 2381–2398. doi:10.1002/2016JF003869.
Miller, J. Z., D. G. Long, K. C. Jezek, J. T. Johnson, M. J. Brodzik, C. A. Shuman, L. S. Koenig, and T. A. Scambos. 2020. Brief communication: Mapping Greenland's perennial firn aquifers using enhanced-resolution L-band brightness temperature image time series. The Cryosphere, 14, 2809–2817. doi:10.5194/tc-14-2809-2020.
Miller, J. Z., R. Culberg, D. G. Long, C. A. Shuman, D. M. Schroeder, and M. J. Brodzik. 2022. An empirical algorithm to map perennial firn aquifers and ice slabs within the Greenland Ice Sheet using satellite L-band microwave radiometry. The Cryosphere, 16, 103-125. doi:10.5194/tc-16-103-2022.
Paden, J., J. Li, C. Leuschen, F. Rodriguez-Morales, and R. Hale. 2011. IceBridge Accumulation Radar L1B Geolocated Radar Echo Strength Profiles, Version 1 [Data Set]. Boulder, Colorado USA. NASA National Snow and Ice Data Center Distributed Active Archive Center. doi:10.5067/AOLNV74W1O4K.
Paden, J., J. Li, C. Leuschen, F. Rodriguez-Morales, and R. Hale. 2014. IceBridge MCoRDS L1B Geolocated Radar Echo Strength Profiles, Version 2 [Data Set]. Boulder, Colorado USA. NASA National Snow and Ice Data Center Distributed Active Archive Center. doi:10.5067/90S1XZRBAX5N.
Poinar K., I. Joughin, D. Lilien, L. Brucker, L. Kehrl, and S. Nowicki. 2017. Drainage of Southeast Greenland Firn Aquifer Water through Crevasses to the Bed. Frontiers in Earth Science, 5:5. doi:10.3389/feart.2017.00005.
Wessel, P. and W. H. F. Smith. 1996. A global, self-consistent, hierarchical, high-resolution shoreline database. Journal Geophysical Research, 101, 8741–8743. doi:10.1029/96JB00104.


