Our Research
As climate changes, how do Earth's frozen areas affect our planet and impact society?
Related News & Stories
Filter by:
Spotlight
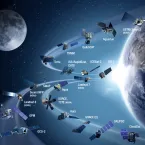
In 1993, NASA contracted the National Snow and Ice Data Center (NSIDC) at the University of Colorado Boulder to steward snow- and ice-related data, forming the NSIDC DAAC. The year 2023 marks 30 years that NSIDC has operated the NASA snow and ice DAAC.

Analysis - Ice Sheets Today
NSIDC has launched an upgraded and streamlined Ice Sheets Today website. The new site replaces the site previously known as Greenland Today and Antarctica Today. Ice Sheets Today offers easy access to melt statistics and scientific analysis of ice sheet conditions.
Spotlight
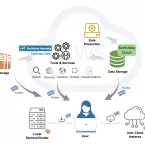
As NASA moves their Earth science data over to the Earthdata Cloud, a commercial cloud environment hosted in Amazon Web Services, the NASA Distributed Active Archive Centers (DAACs) are shoring up resources to help users adopt a cloud-based workflow as smoothly as possible. One such resource is the NASA Earthdata Cloud Cookbook, a learning-oriented resource to support scientific researchers who use NASA Earth data as NASA migrates data to the cloud.

Analysis - Sea Ice Today
A few days after the annual Arctic sea ice minimum extent was reached on September 19, the sun set at the North Pole, aiding sea ice growth.

Feature Story
Discover how scientists and community members in the hamlet of Clyde River, Canada came together to unravel the mysteries behind severe winter events and their links to climate change.

Analysis - Sea Ice Today
On September 10, Antarctic sea ice likely reached its annual maximum extent of 16.96 million square kilometers (6.55 million square miles). This is the lowest sea ice maximum in the 1979 to 2023 sea ice record by a wide margin.