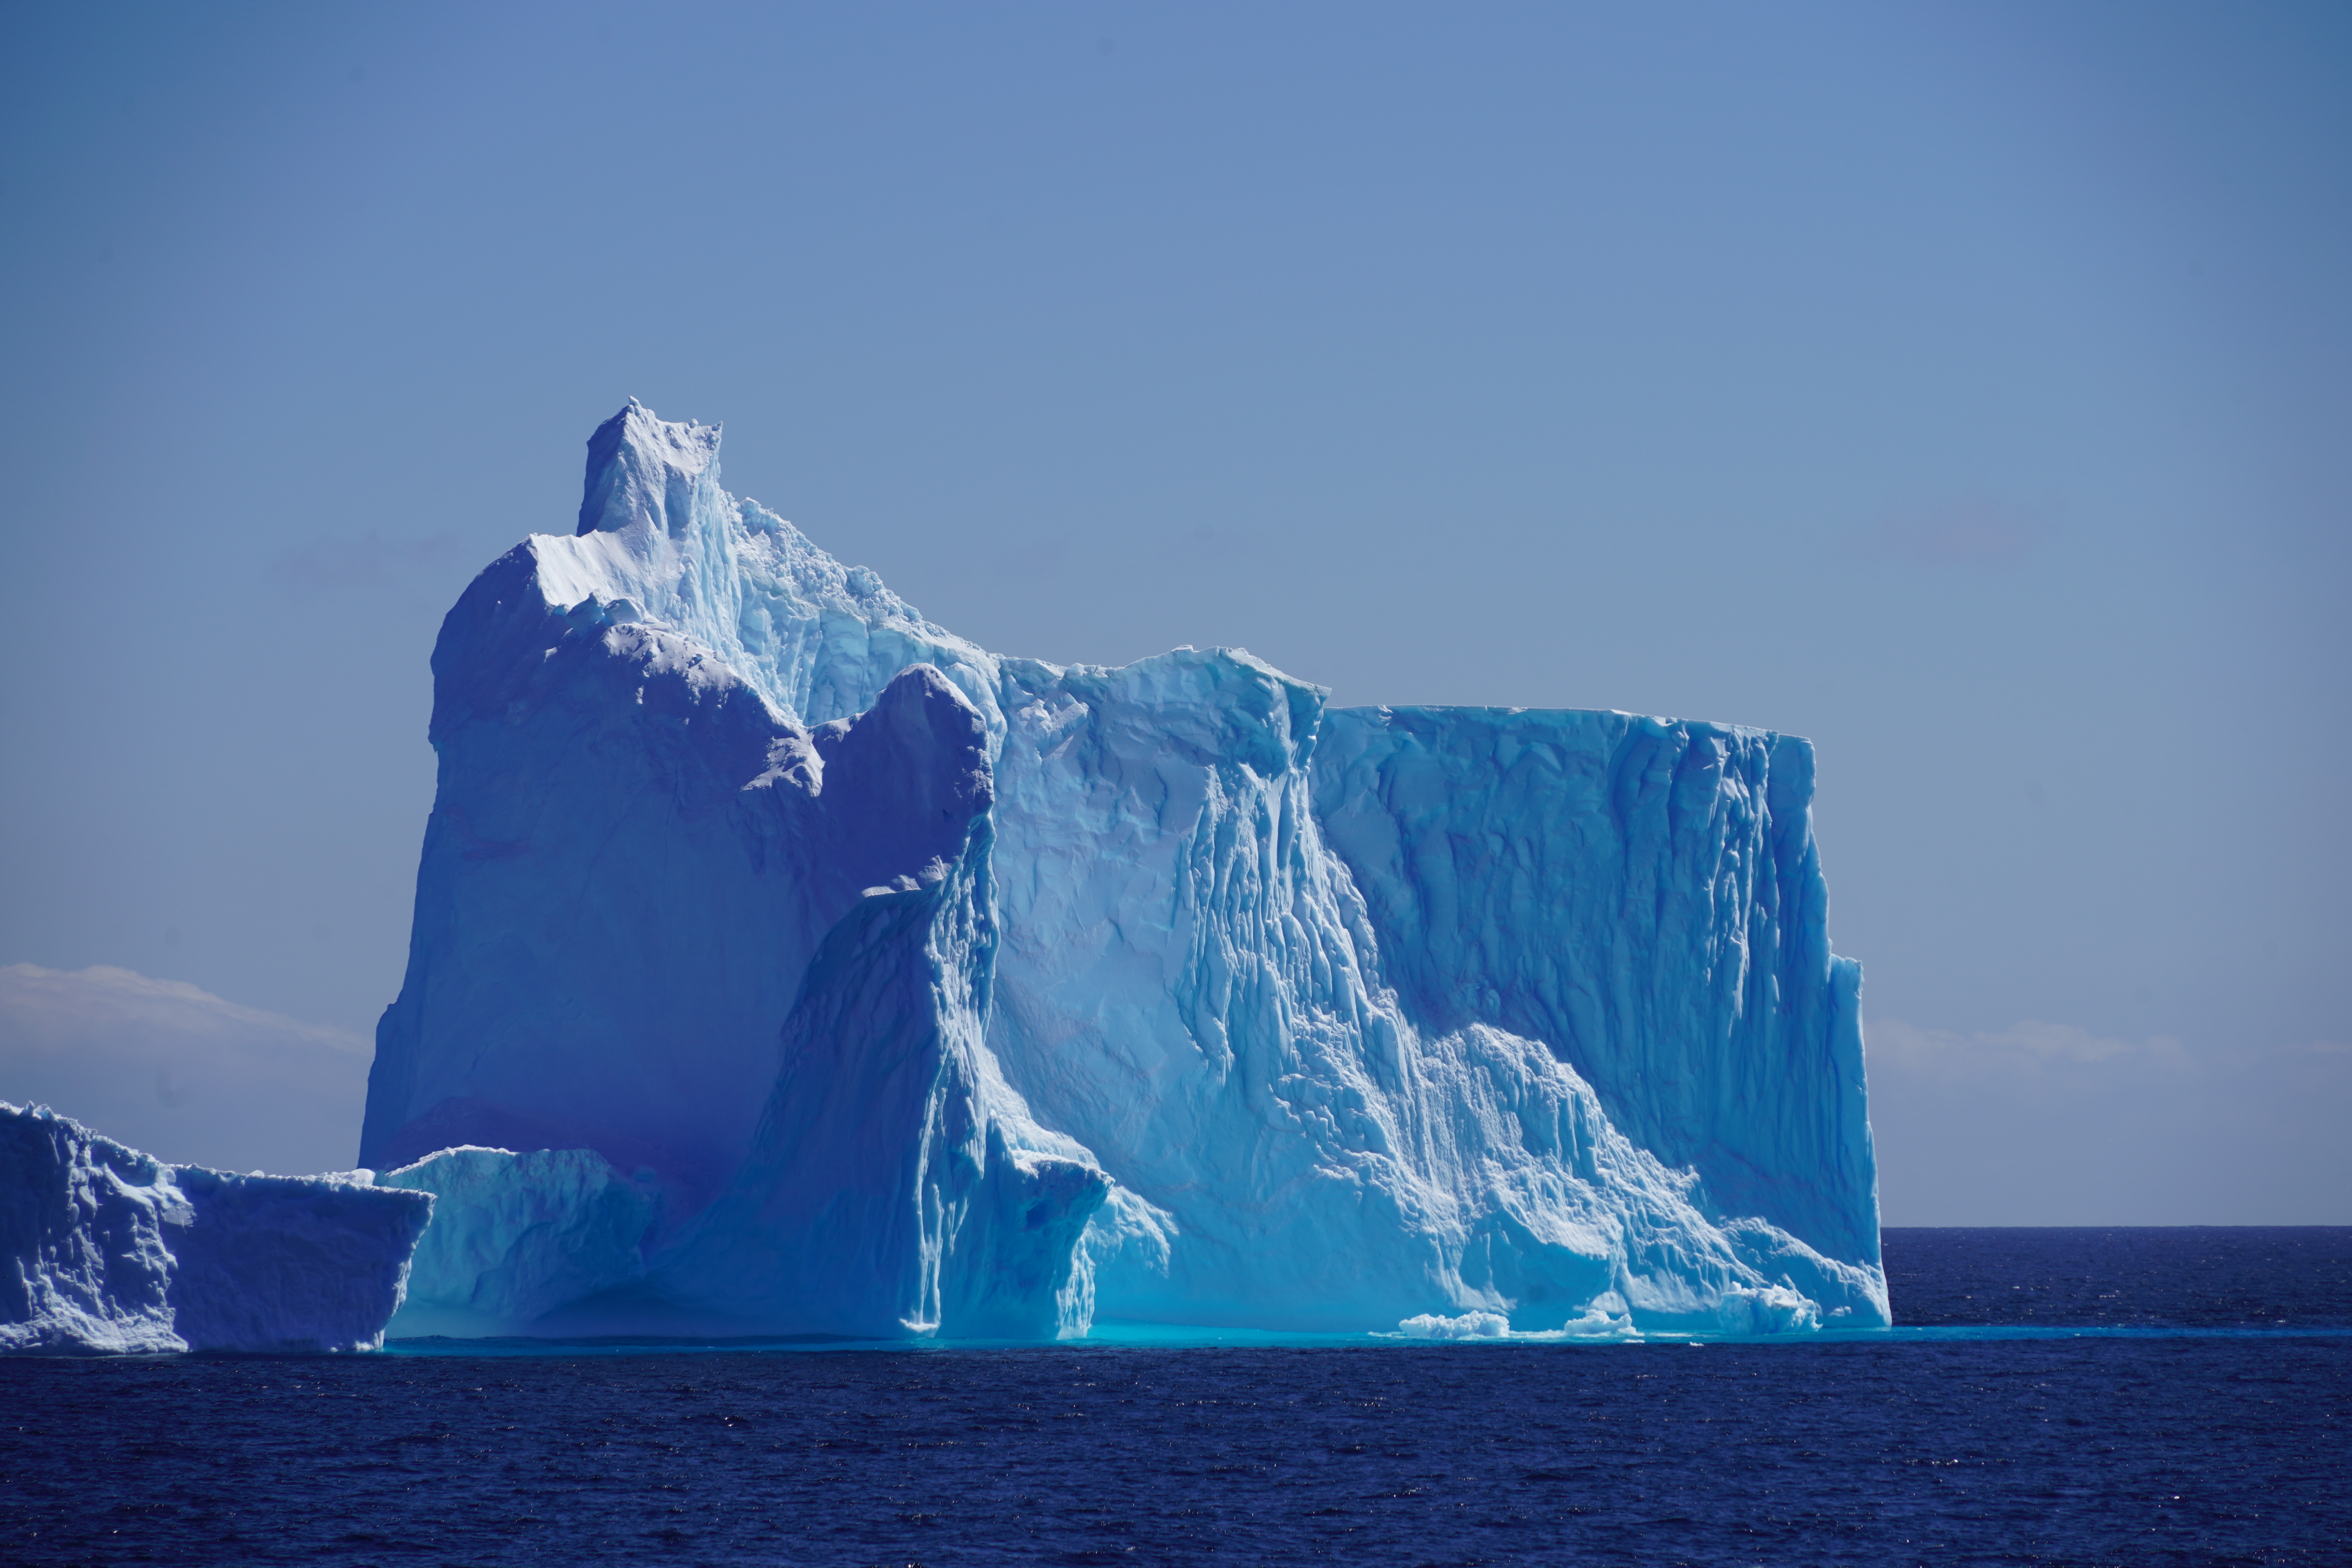
An iceberg drifts in the Southern Ocean away from Antarctica.— Credit:Alia Khan, NSIDC
Advancements in remote sensing, data management technology, and scientific understanding have enabled NSIDC to share insights in how Earth’s cryosphere has changed over time, including changes that occurred before NSIDC began operating. NSIDC can share a wealth of valuable information thanks to historic photo archives, satellite images, aerial photographs, unique data sets, and the steady march of scientific research. Below is a small sampling of how our planet’s frozen places have evolved.
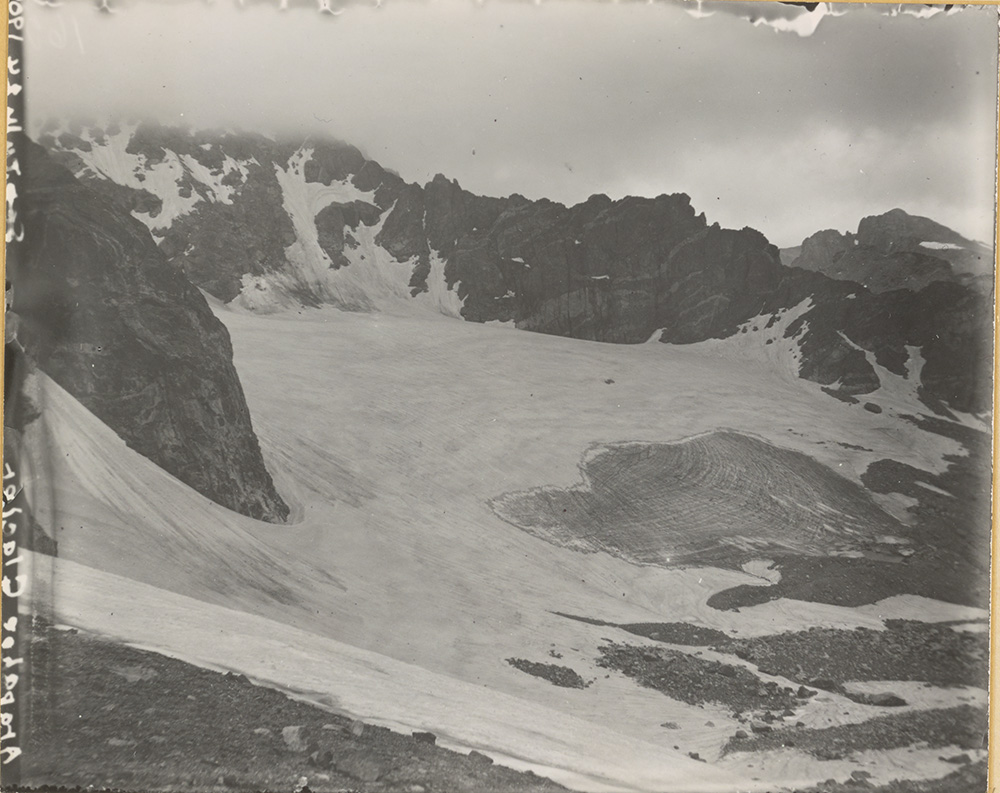
Junius Henderson took this photo of Arapaho Glacier west of Boulder on July 29, 1904.— Credit:Glacier Photograph Collection
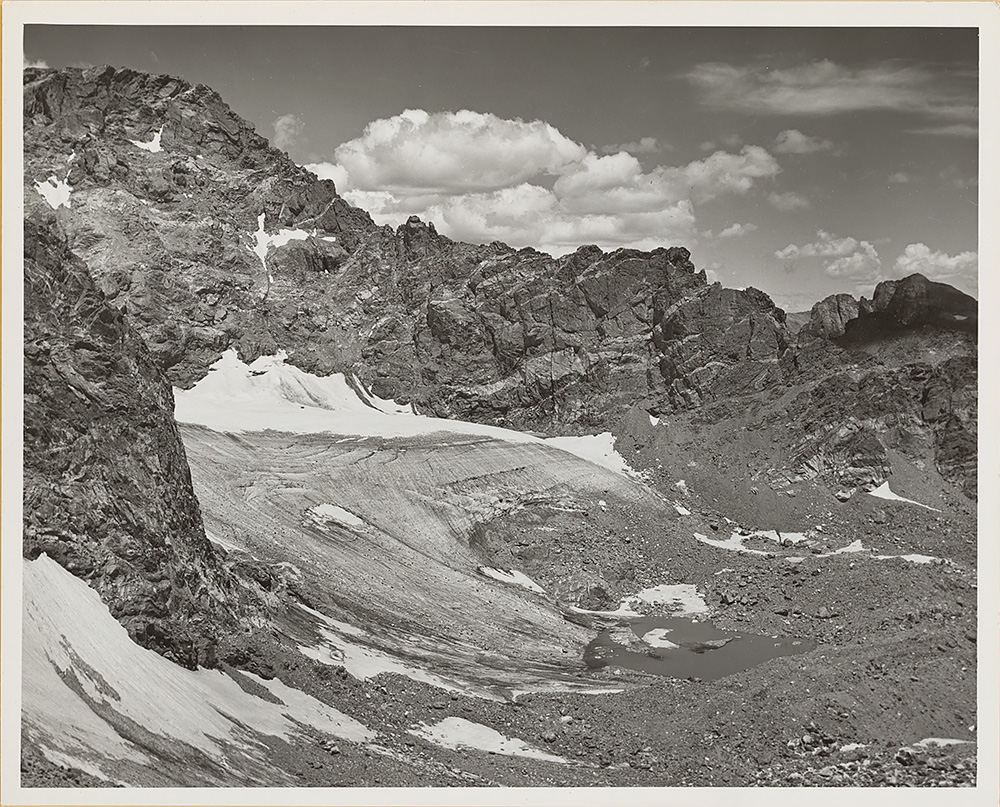
A photographer with the Boulder Chamber of Commerce took this photo of Arapaho Glacier on August 8, 1954.— Credit:Glacier Photograph Collection
William Osgood Field took this photo of Muir Glacier on August 13, 1941.— Credit:Glacier Photograph Collection
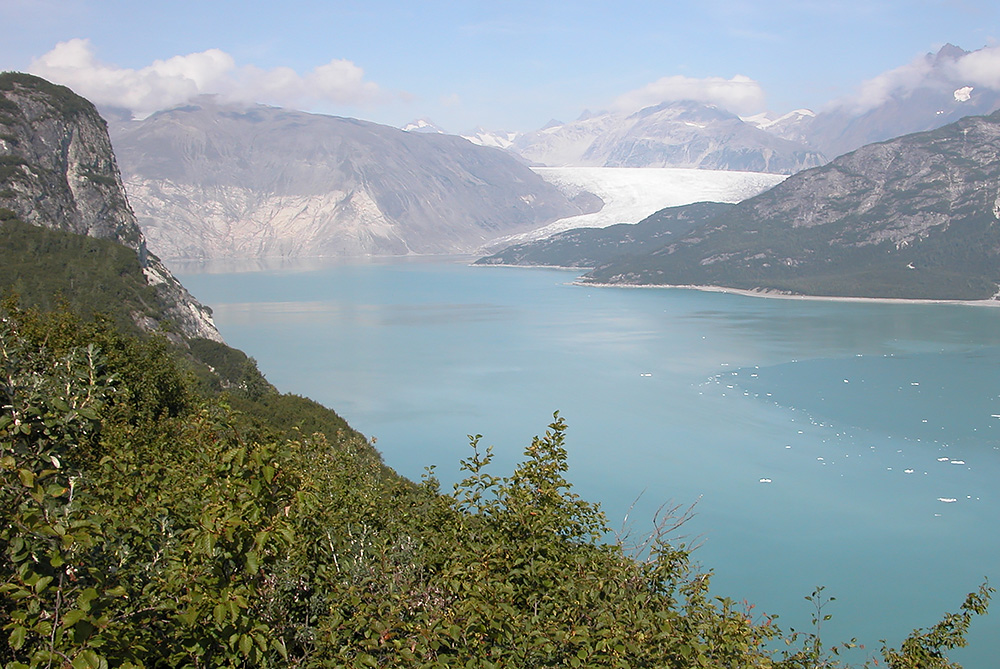
Bruce F. Molnia took this photo of Muir Glacier on August 31, 2004.— Credit:Glacier Photograph Collection
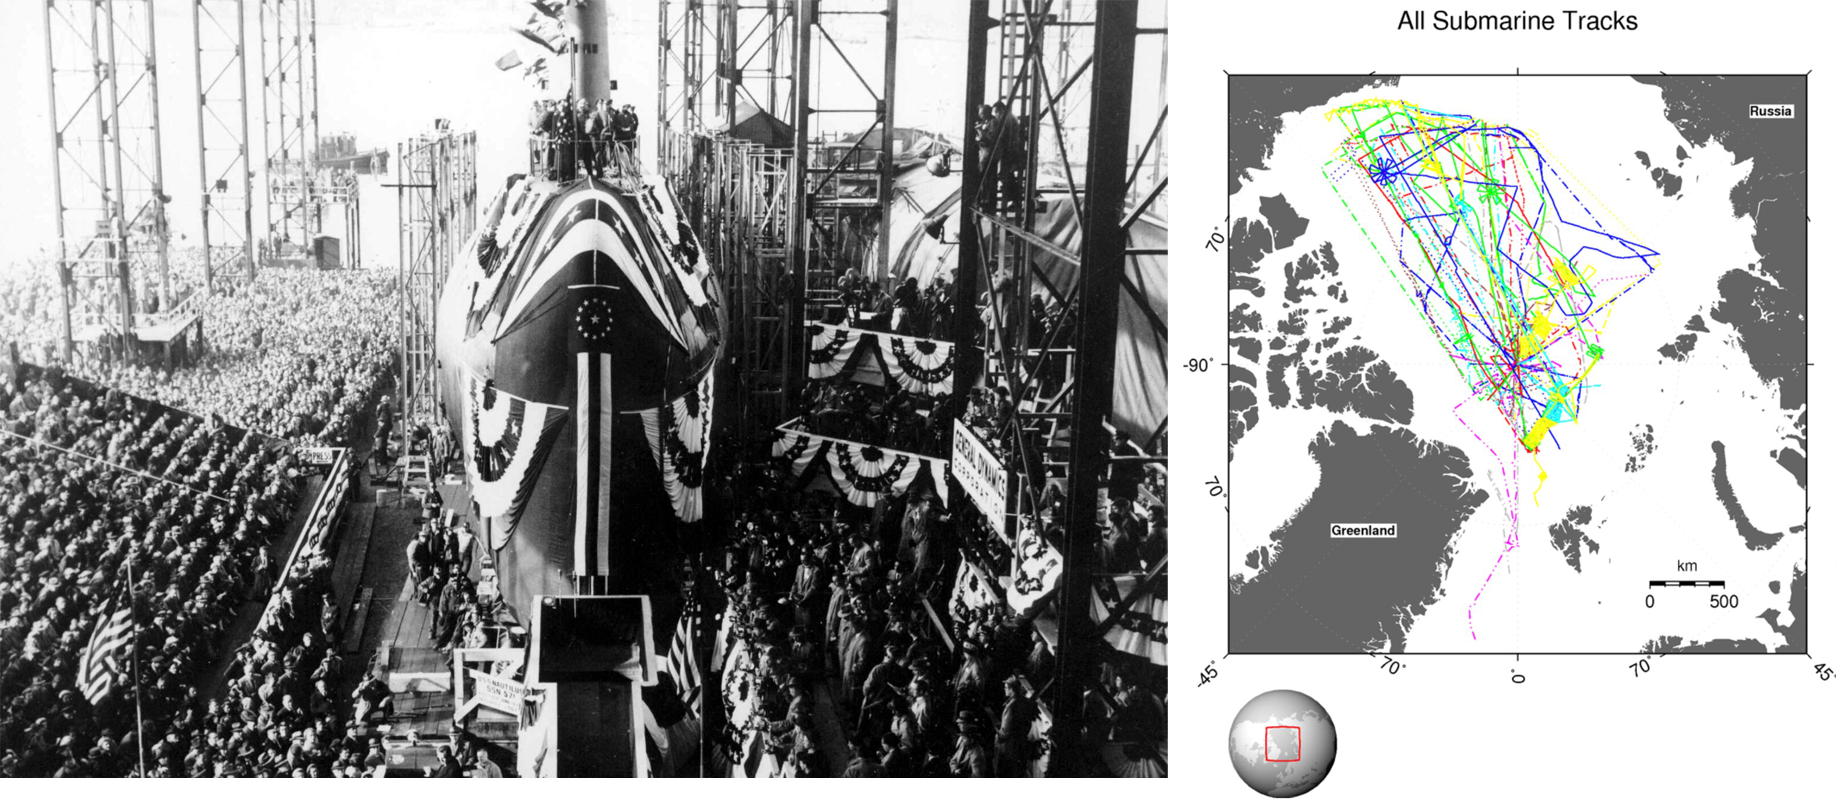
The NOAA@NSIDC SCICEX Submarine Program collection includes declassified observations from US Navy and Royal Navy submarines. Left: Spectators assemble for the christening of the USS Nautilus on January 21, 1954. Credit: US Department of Defense; Right: Data products include maps of declassified tracks.— Credit:NSIDC
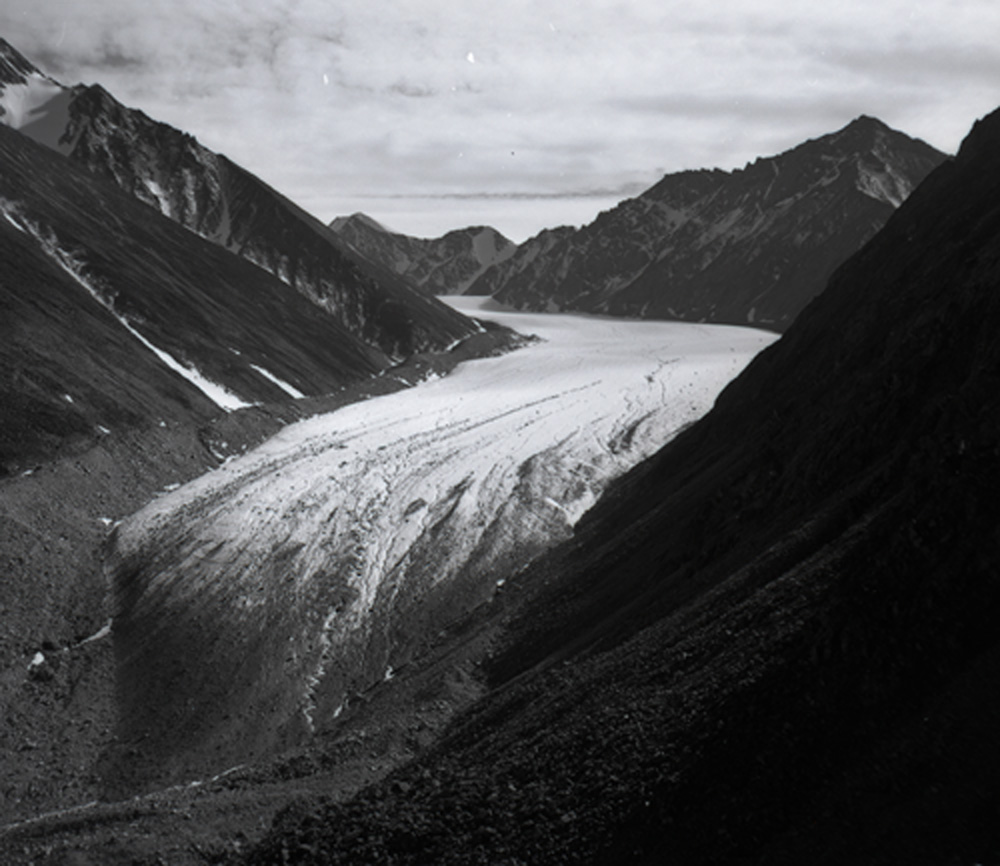
Austin Post took this photo of McCall Glacier in July 1958.— Credit:Glacier Photograph Collection
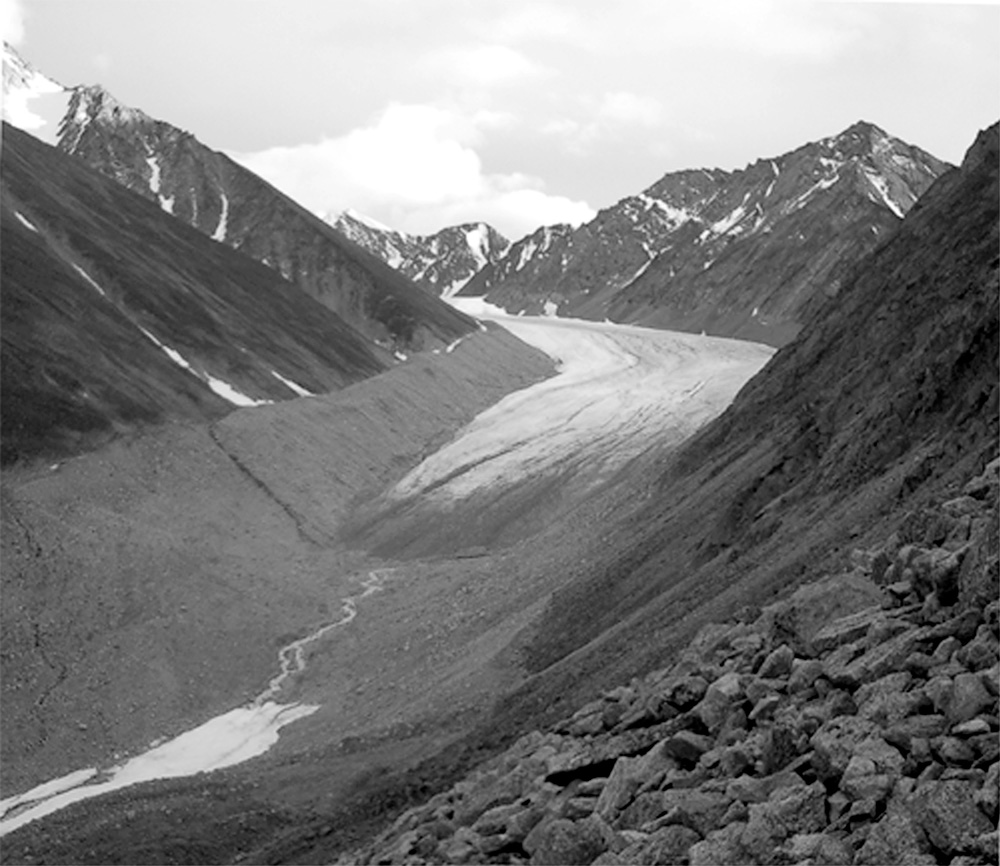
Matt Nolan took this photo of McCall Glacier on August 14, 2003.— Credit:Glacier Photograph Collection
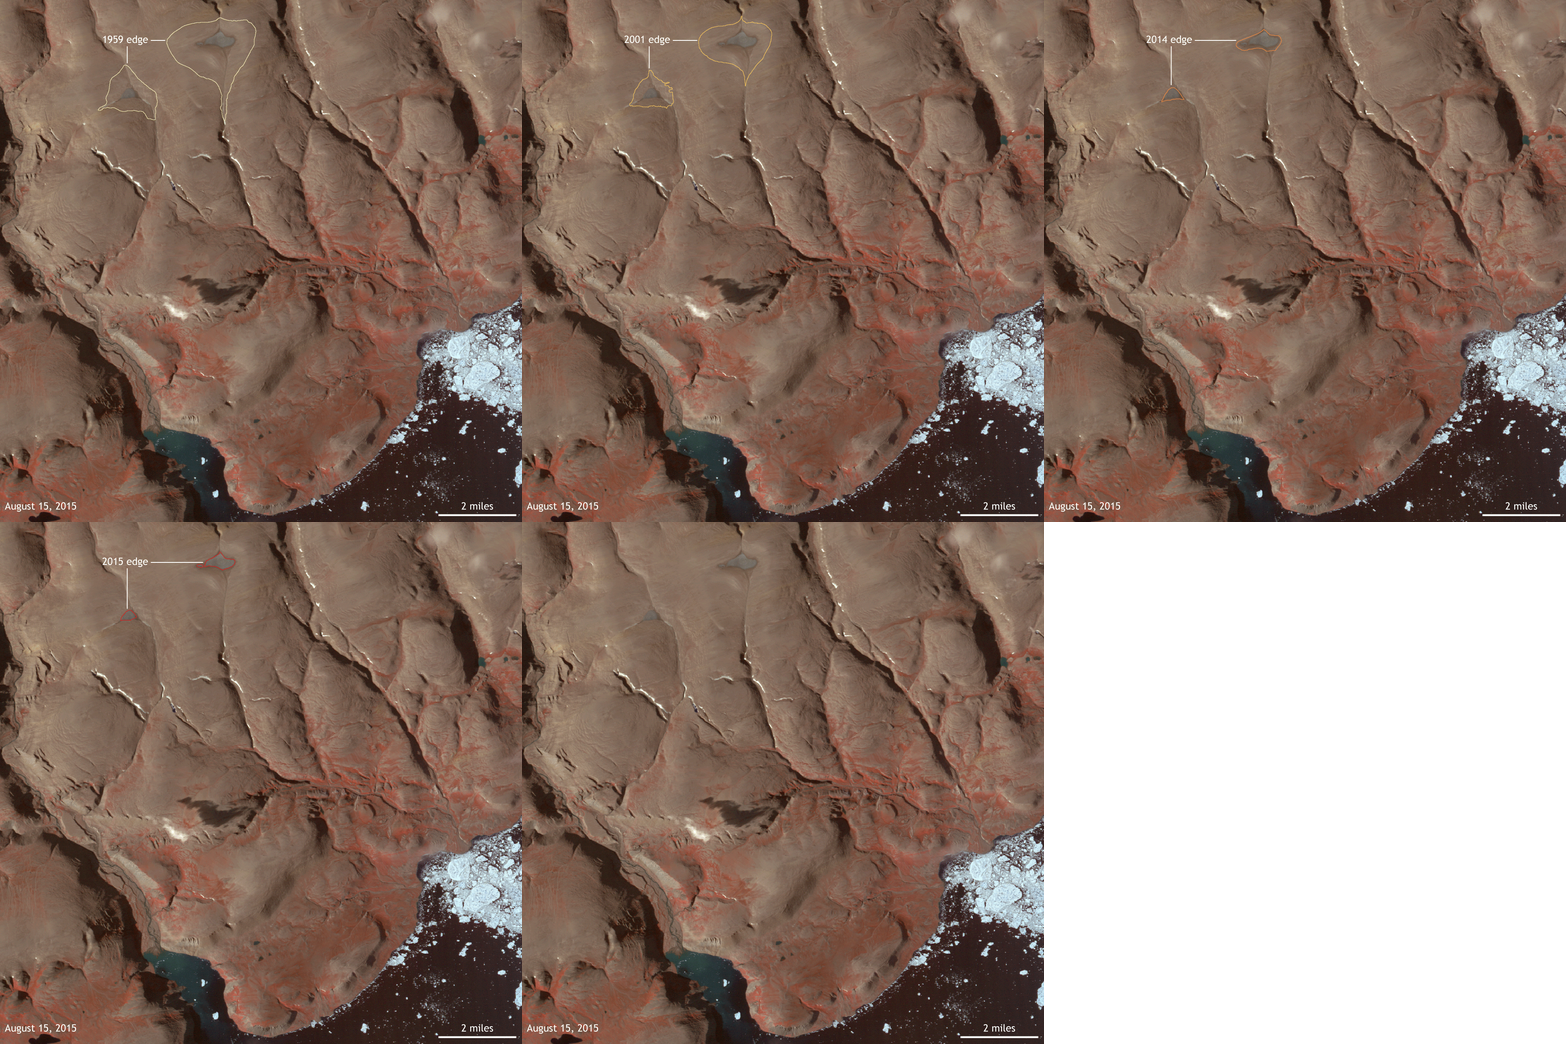
NSIDC director Mark Serreze spent the summers of 1982 and 1983 studying ice caps near St. Patrick Bay on Ellesmere Island. Both began shrinking even before he got there. Click on the image to start the animation.— Credit:Climate.gov/Climate.us
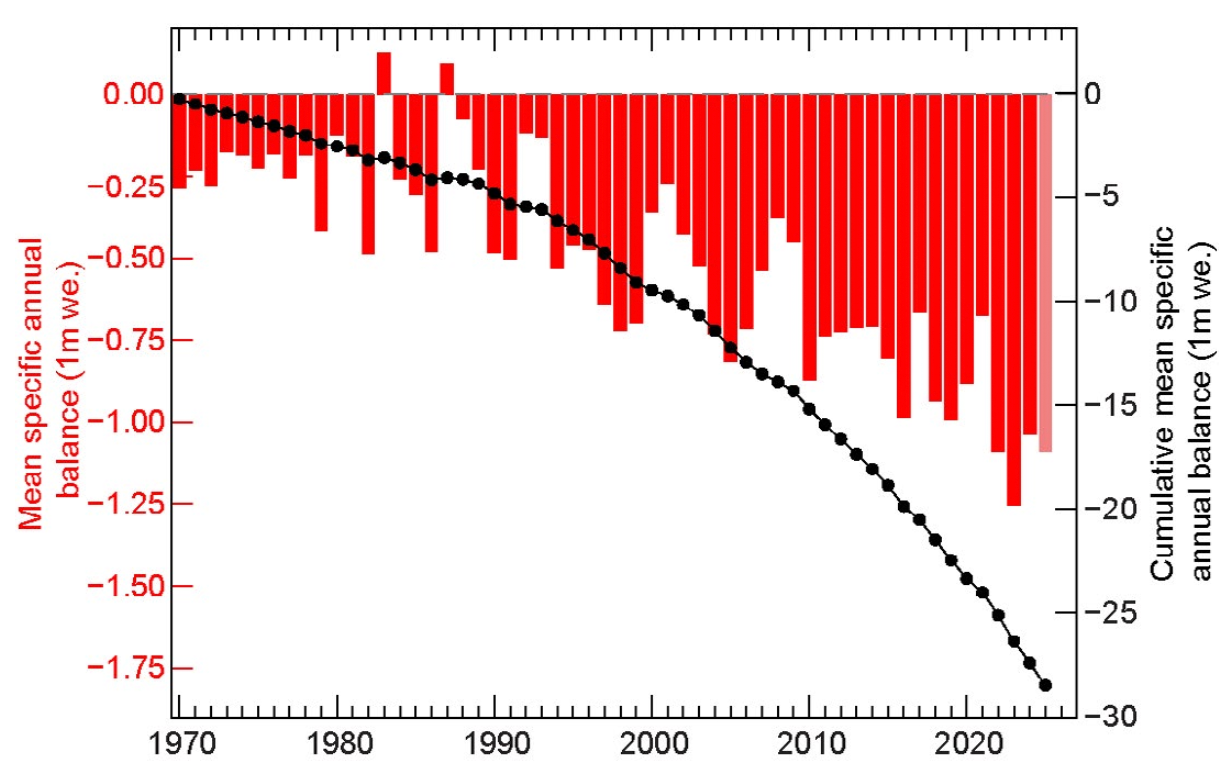
With just two exceptions, every year from 1970 to 2025 experienced a loss of alpine glacier mass balance. Red bars are annual mass balance, and the dotted black line is annual cumulative mass balance.— Credit:BAMS State of the Climate in 2025
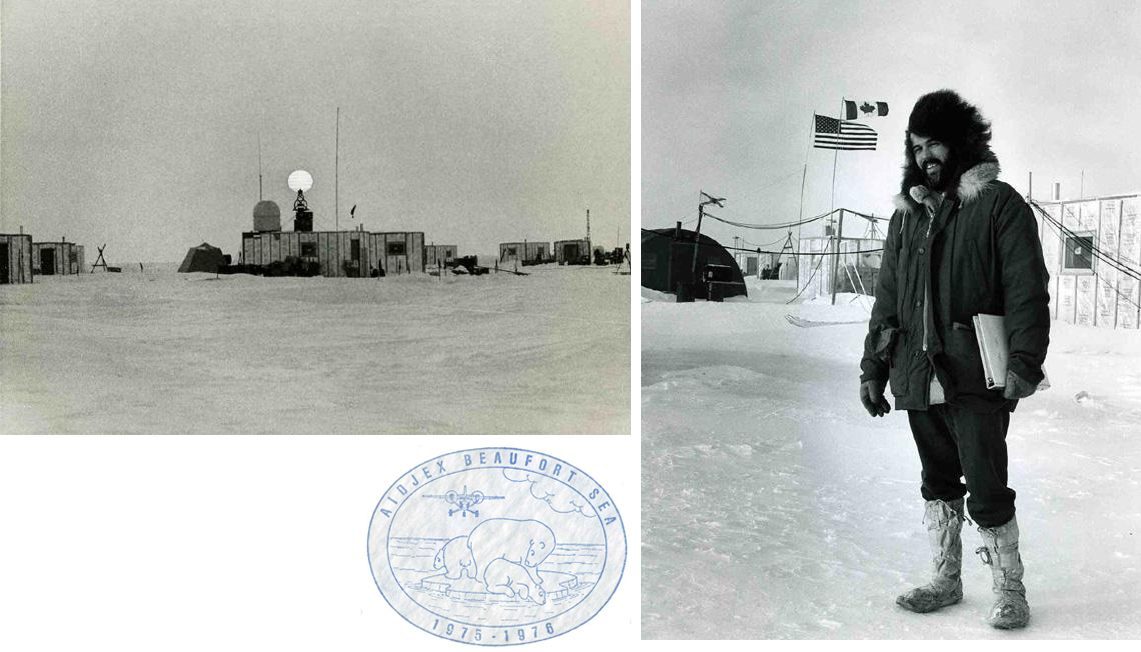
The American-Canadian Arctic Ice Dynamics Joint Experiment (AIDJEX) project began with a pilot study in 1972 followed by more fieldwork in 1975 and 1976. Upper left: Midnight sun shines on a field camp in 1972. Lower left: Polar bears float on the AIDJEX patch. Right: Barbers did not visit the field camp.— Credit:NSIDC
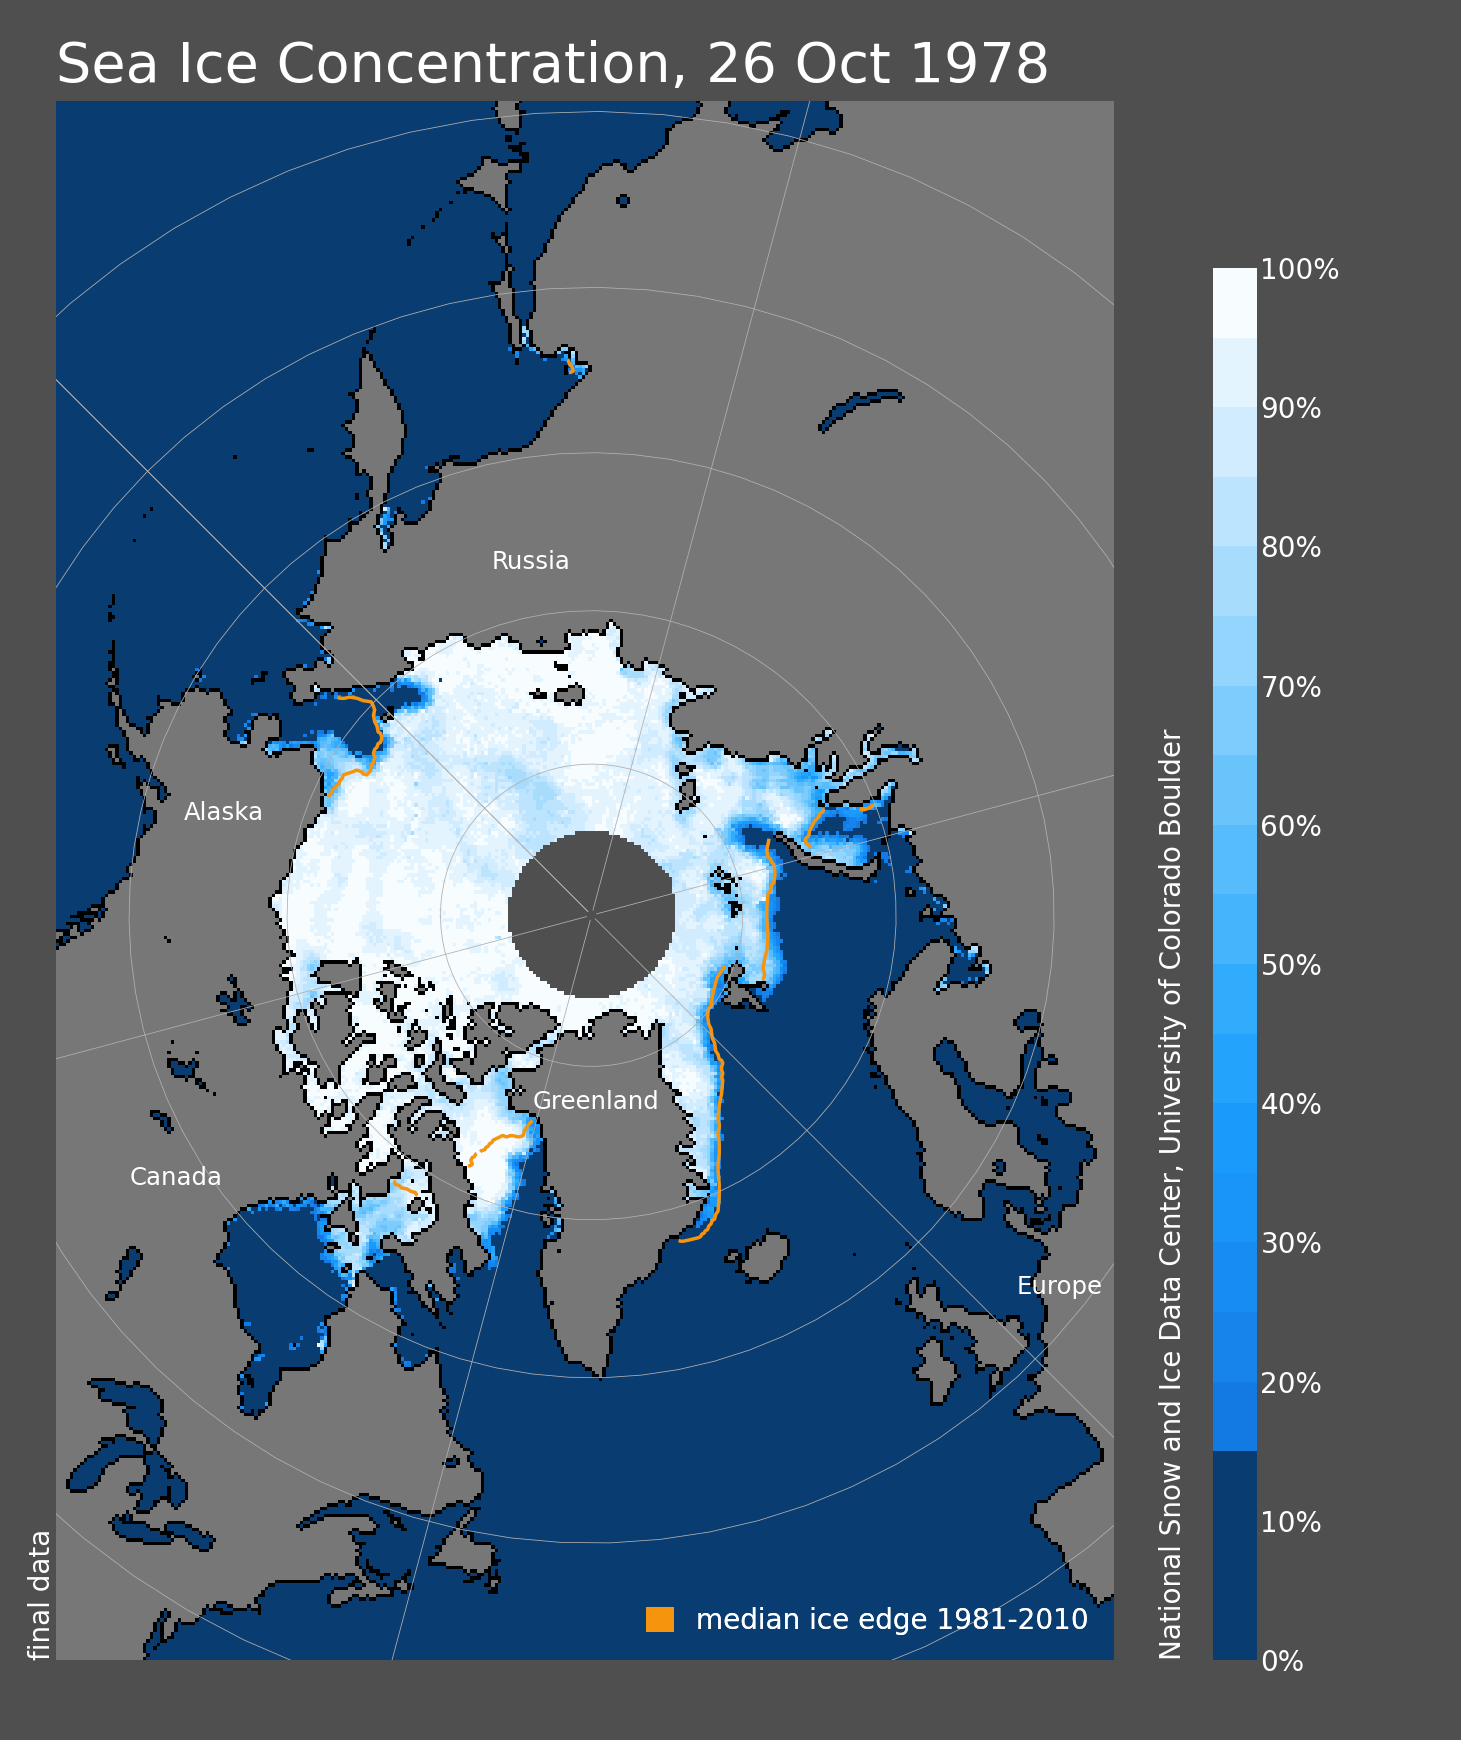
The continuous record from polar-orbiting, multichannel passive microwave satellites started in late October 1978. This map shows Arctic sea ice concentration, and the orange line shows the 1981-2010 median ice edge for October 26.— Credit:Sea Ice Index
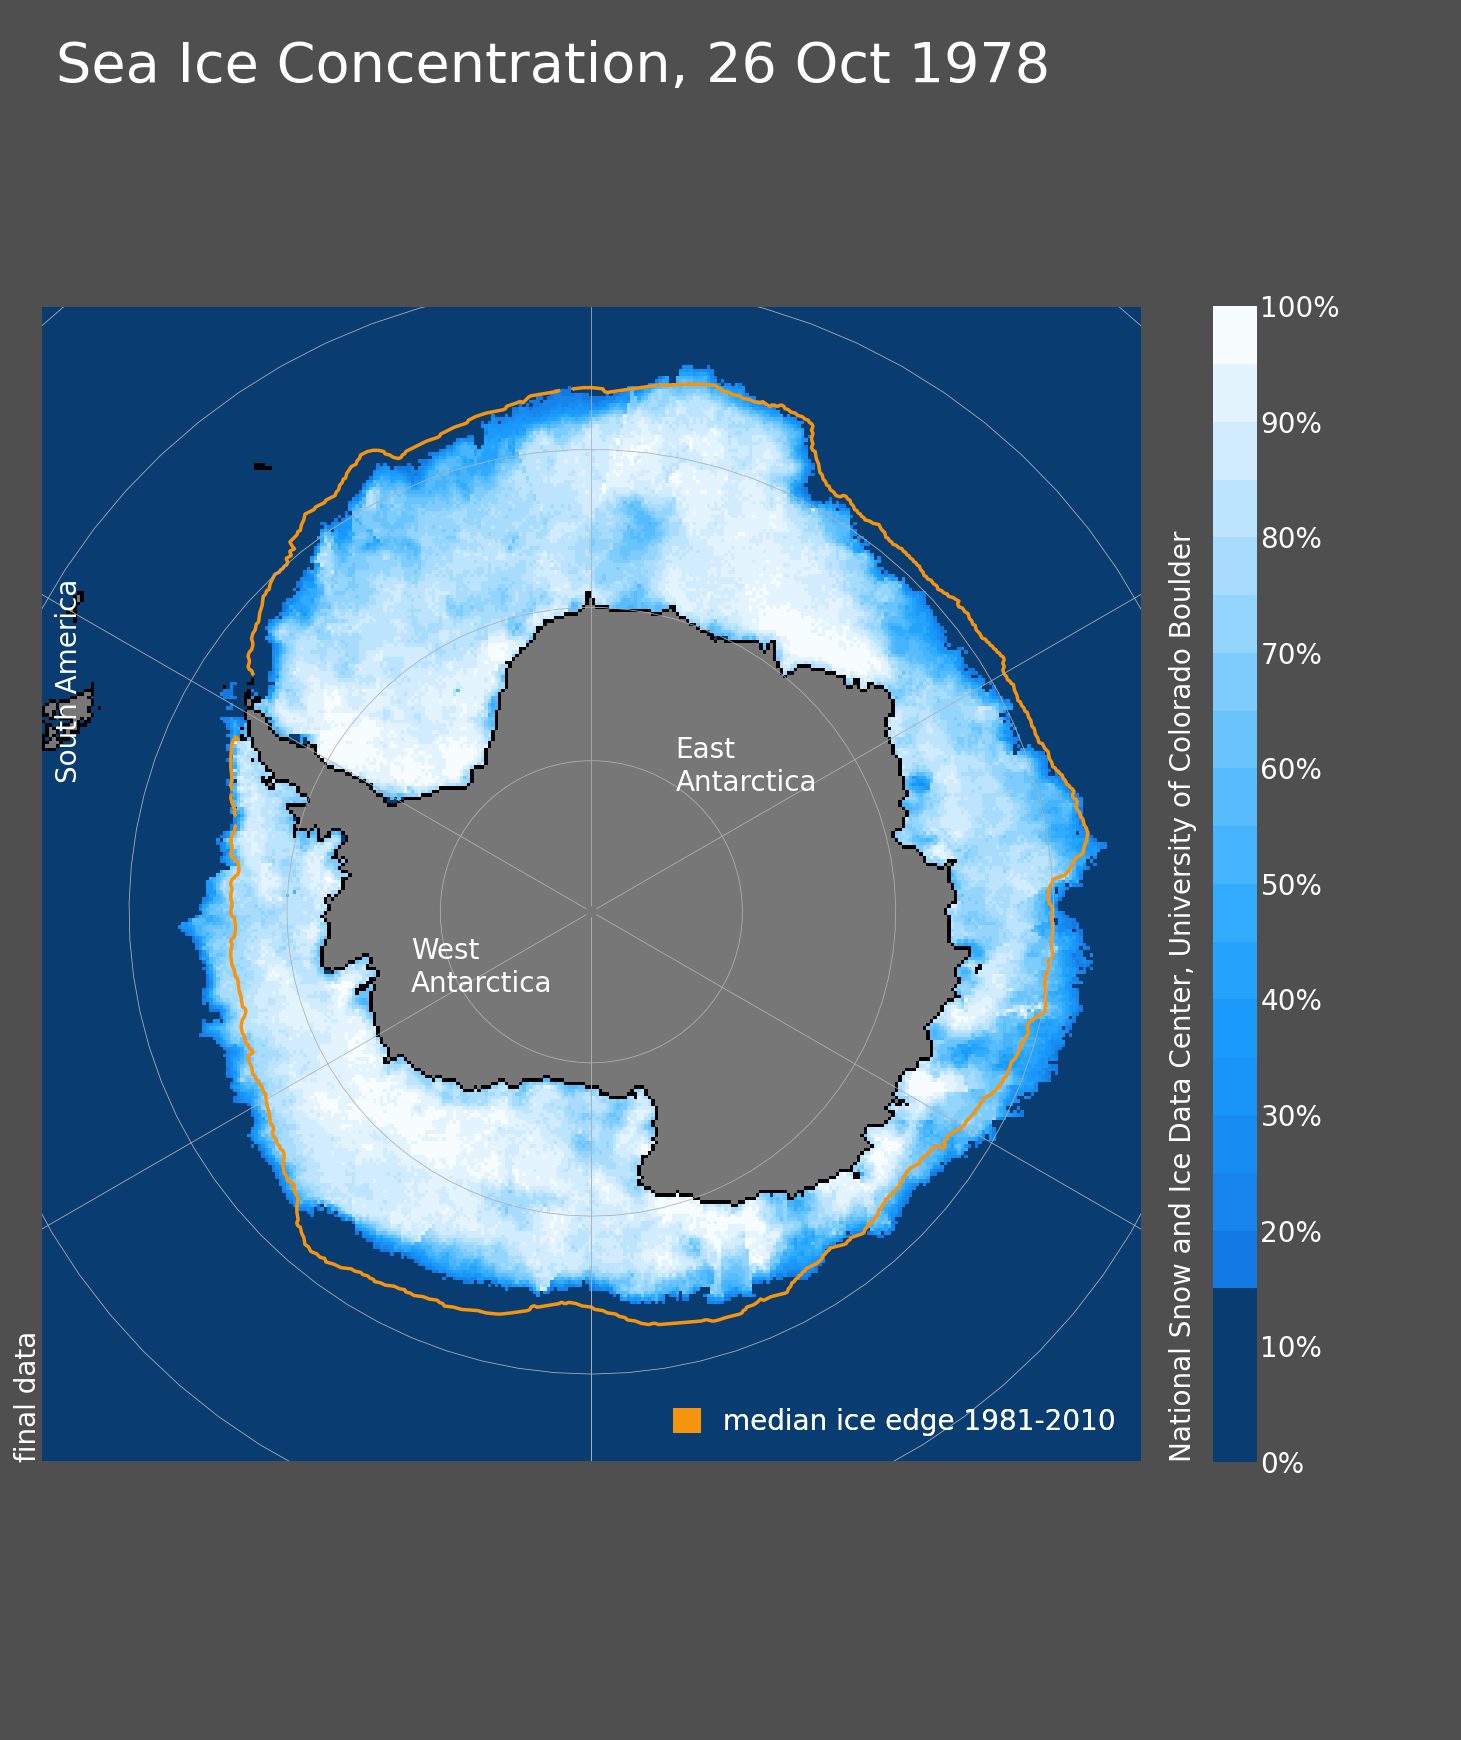
The continuous record from polar-orbiting, multichannel passive microwave satellites started in late October 1978. This map shows Antarctic sea ice concentration, and the orange line shows the 1981-2010 median ice edge for October 26.— Credit:Sea Ice Index
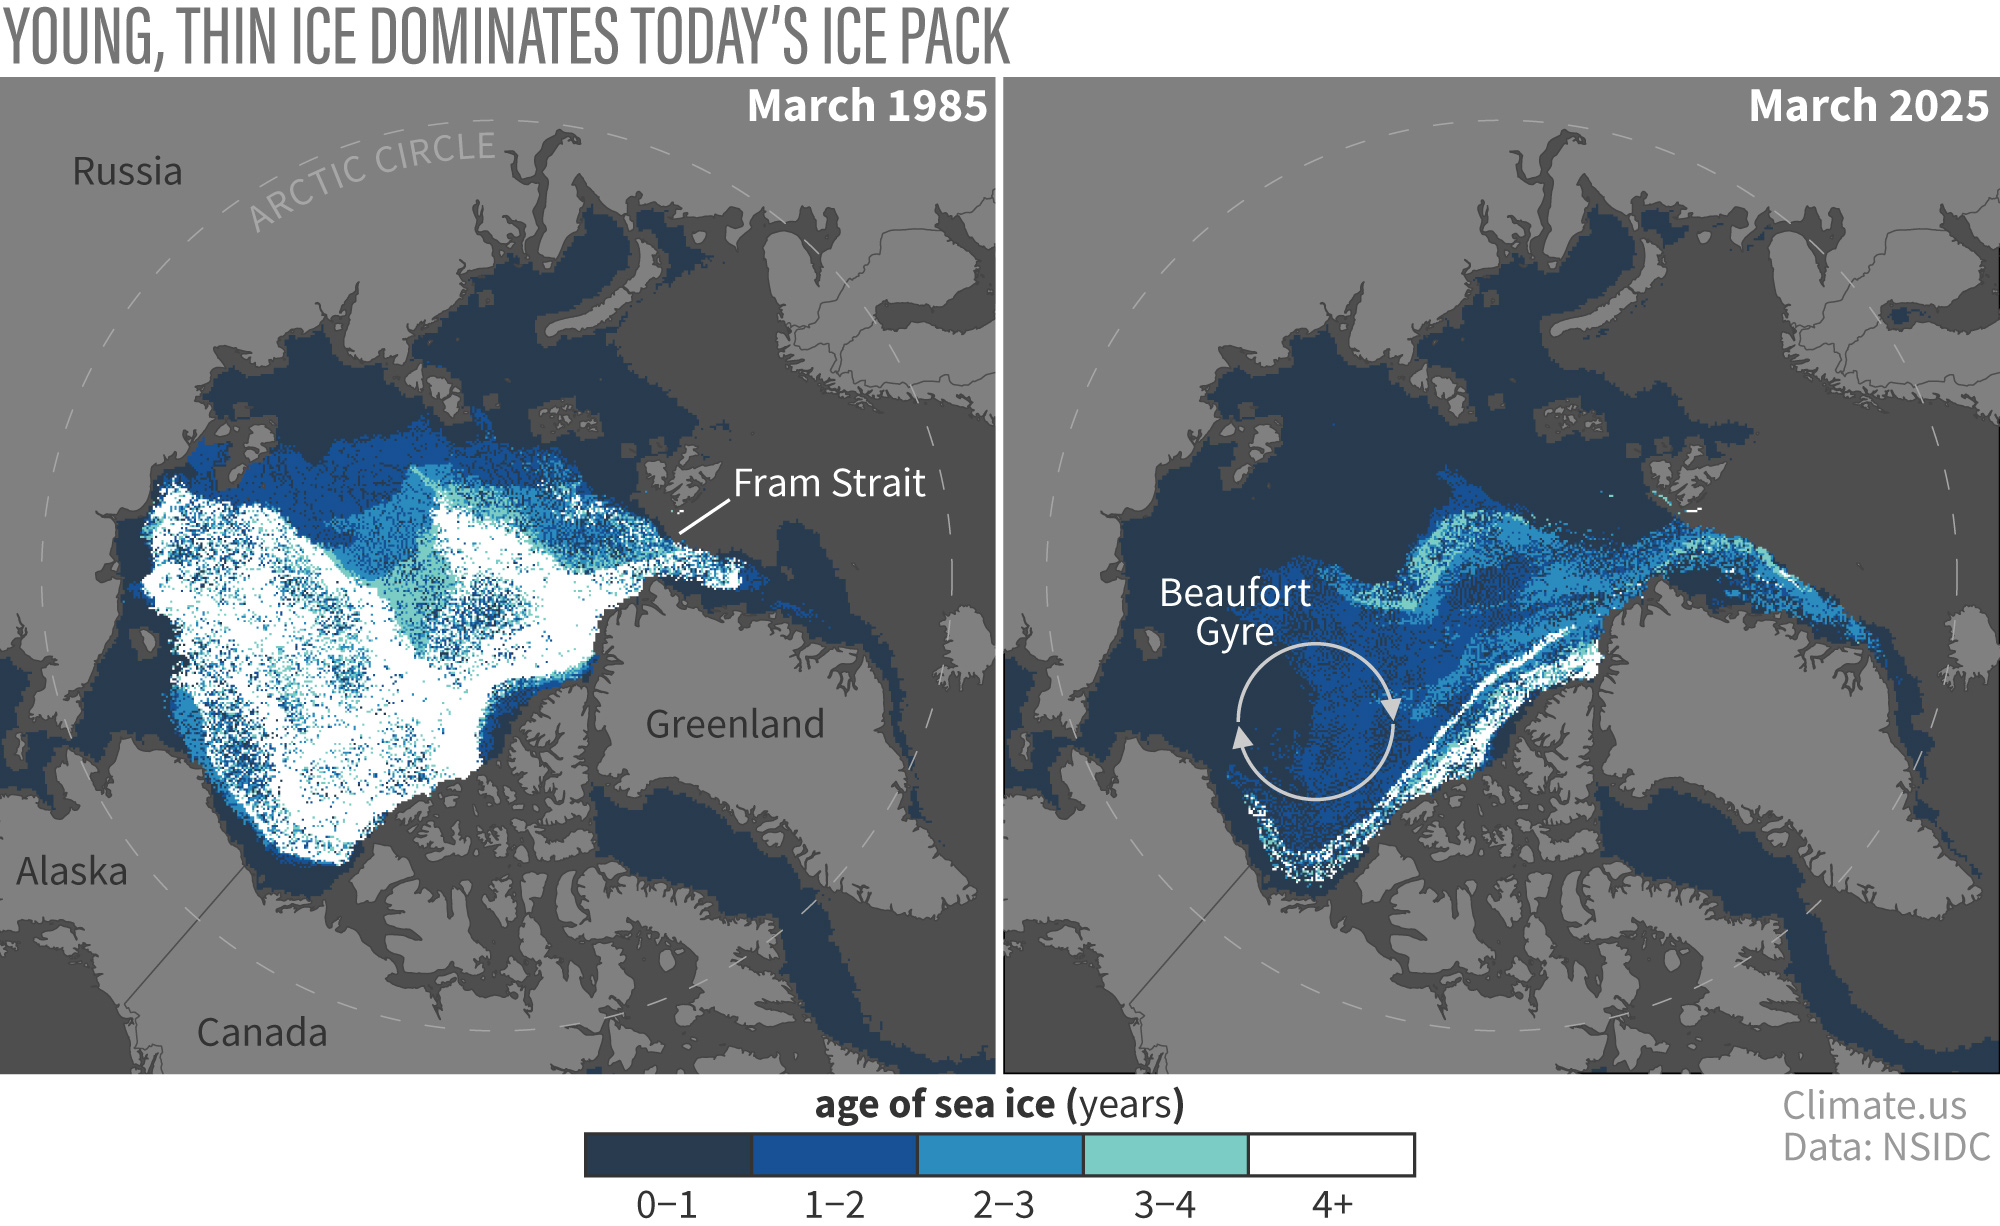
Tracking of multiyear sea ice began after satellites collected observations for several years. Old ice is white; young ice is blue. The Beaufort Gyre used to serve as a nursery for new sea ice, but conditions have grown too warm in recent years.— Credit:Climate.us using NSIDC data
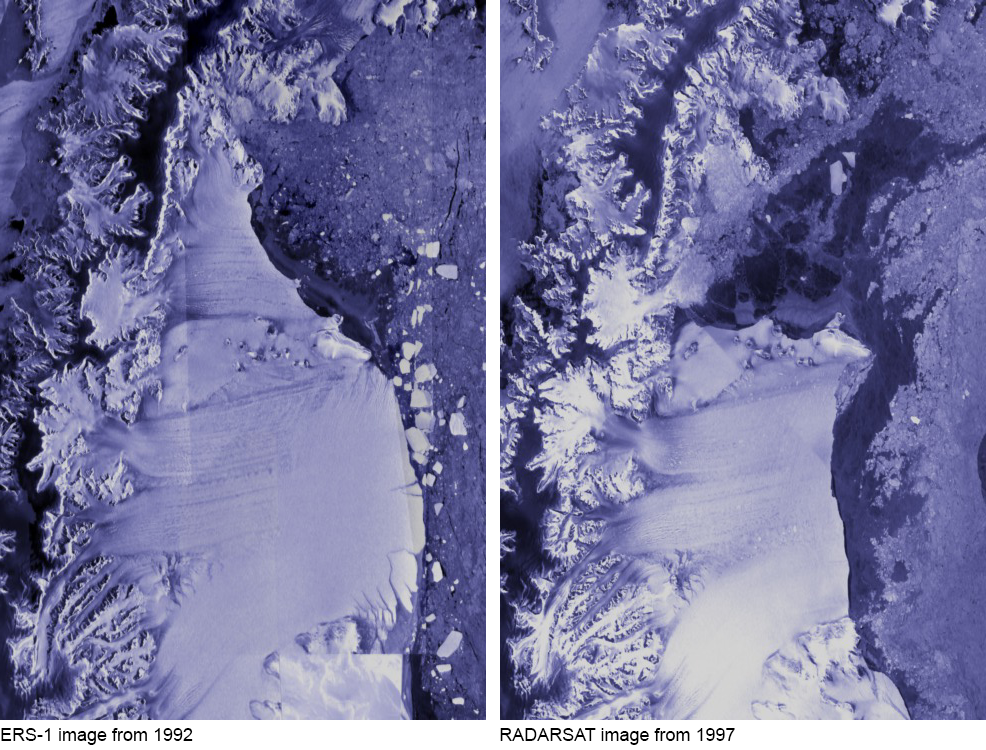
The Larsen A Ice Shelf on the Antarctic Peninsula disintegrated in 1995. These before and after images show the loss of shelf ice (light blue to white). North is up. Left: The European Remote Sensing Satellite-1 captured this image in 1992. Right: The Canadian Radar Satellite captured this image in 1997.— Credit:NASA SVS
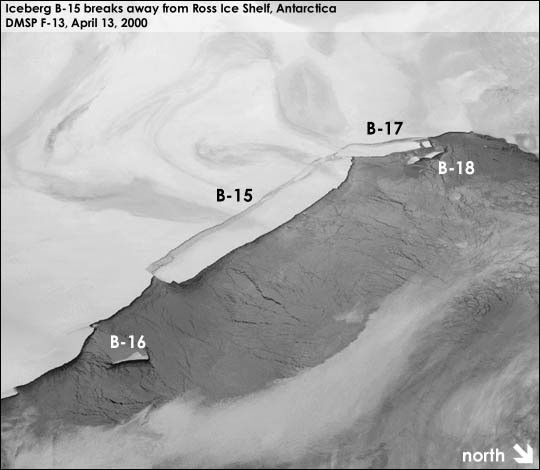
Multiple icebergs calved from Antarctica’s Ross Ice Shelf in March 2000. One of them, Iceberg B-15, was the largest iceberg on record, measured by area. The Defense Meteorological Satellite Program F-13 satellite captured this infrared image on April 13, 2000.— Credit:NASA
The Moderate Resolution Spectroradiometer (MODIS) on NASA’s Terra satellite captured this image on January 31, 2002. Warm conditions have created a series of meltponds on the ice shelf surface.— Credit:NASA
The Moderate Resolution Spectroradiometer (MODIS) on NASA’s Terra satellite captured this image on March 17, 2002, just weeks after the ice shelf began to disintegrate. The ice shelf lost roughly 3,250 square kilometers (1,250 square miles).— Credit:NASA
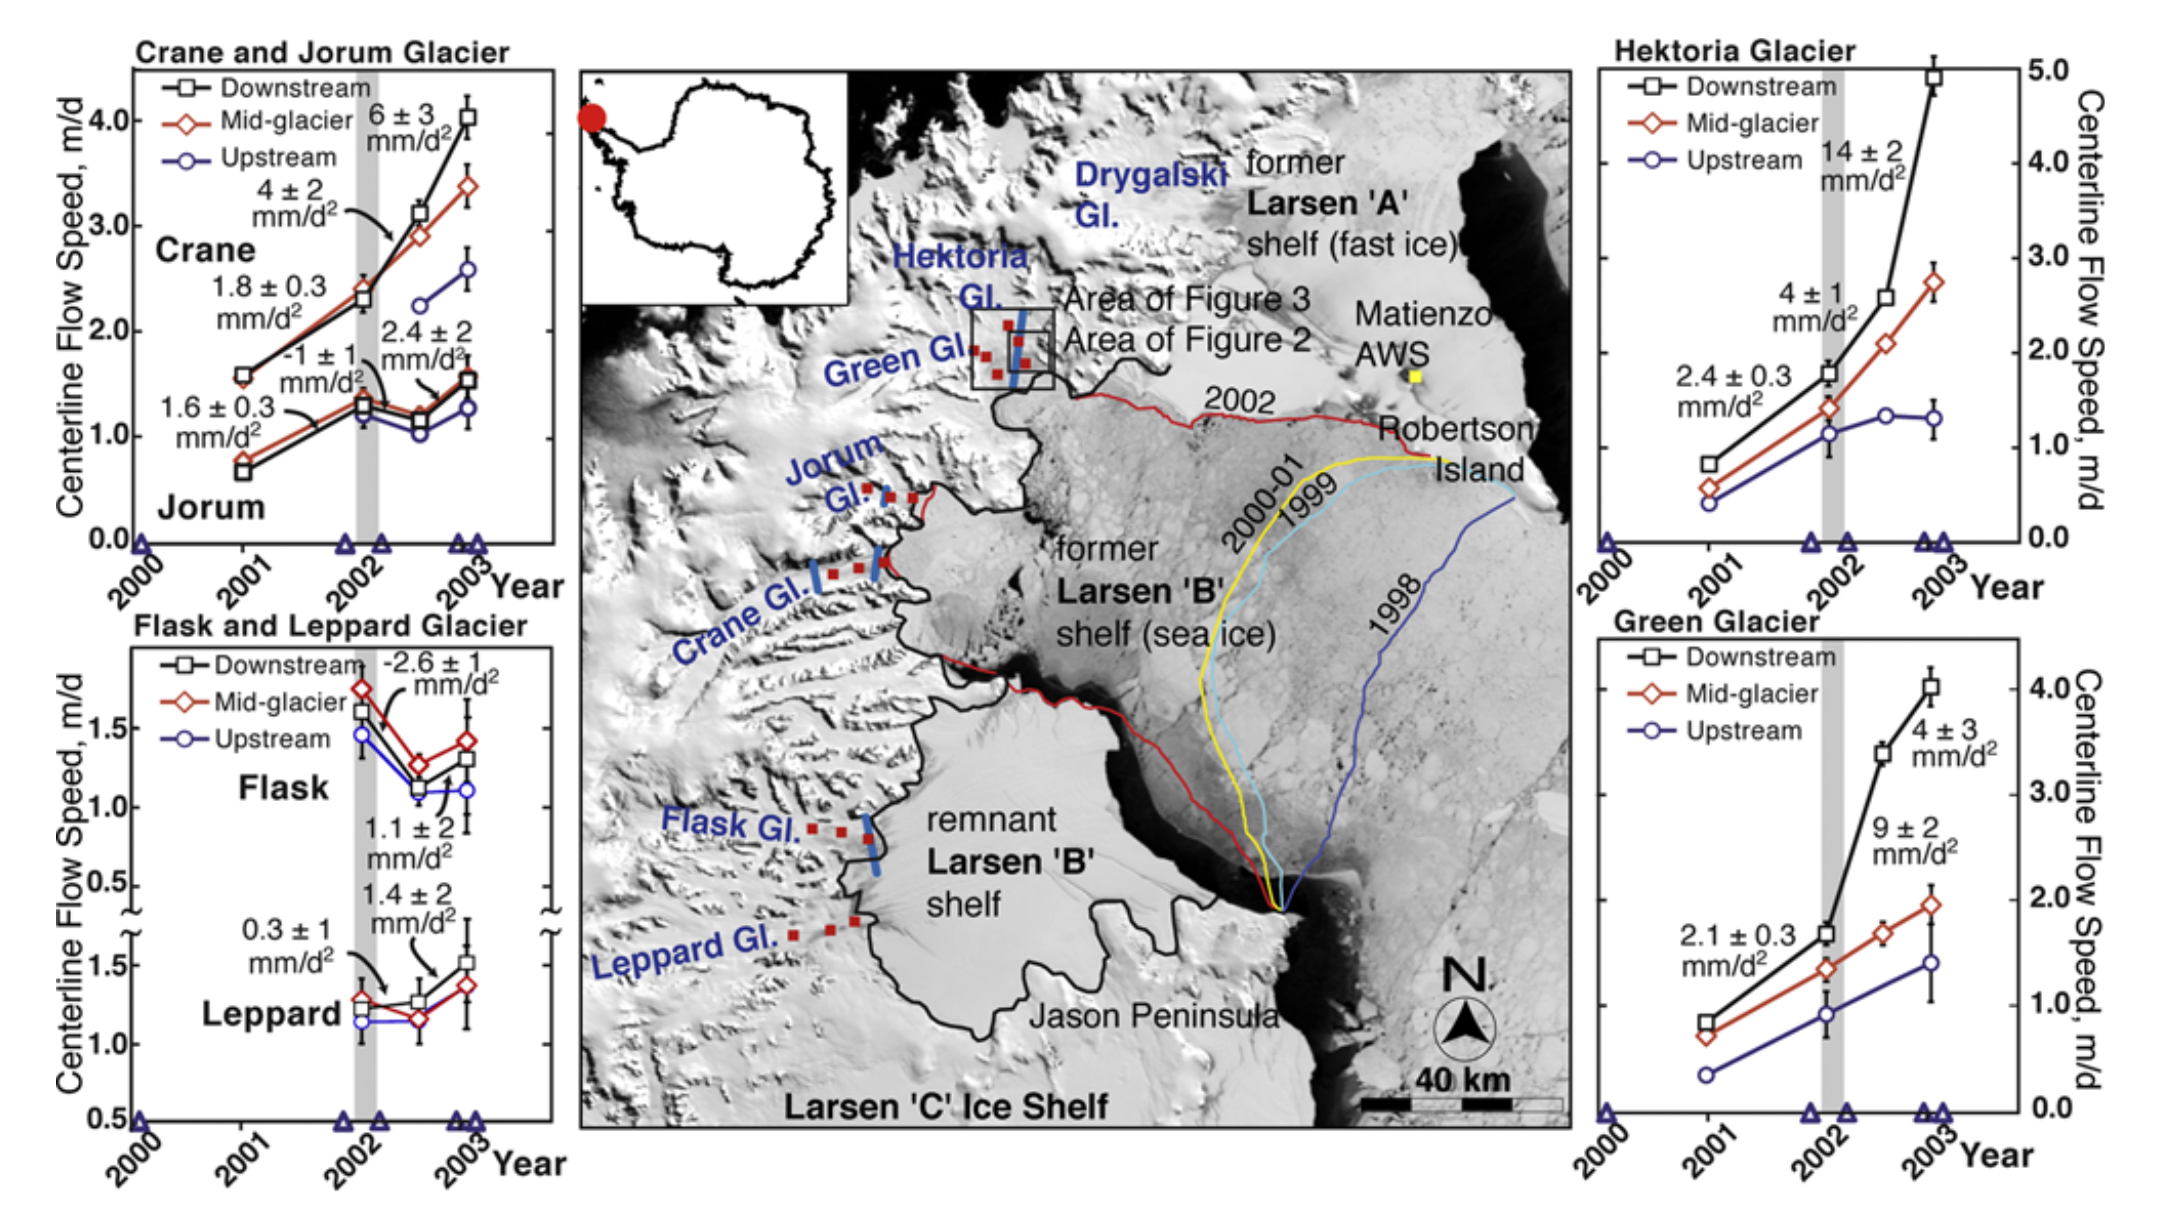
After the Larsen B Ice Shelf disintegrated, glaciers feeding it accelerated. This paper figure shows a satellite image of the glaciers with time series graphs documenting their changing speeds.— Credit:doi:10.1029/2004GL020670, 2004
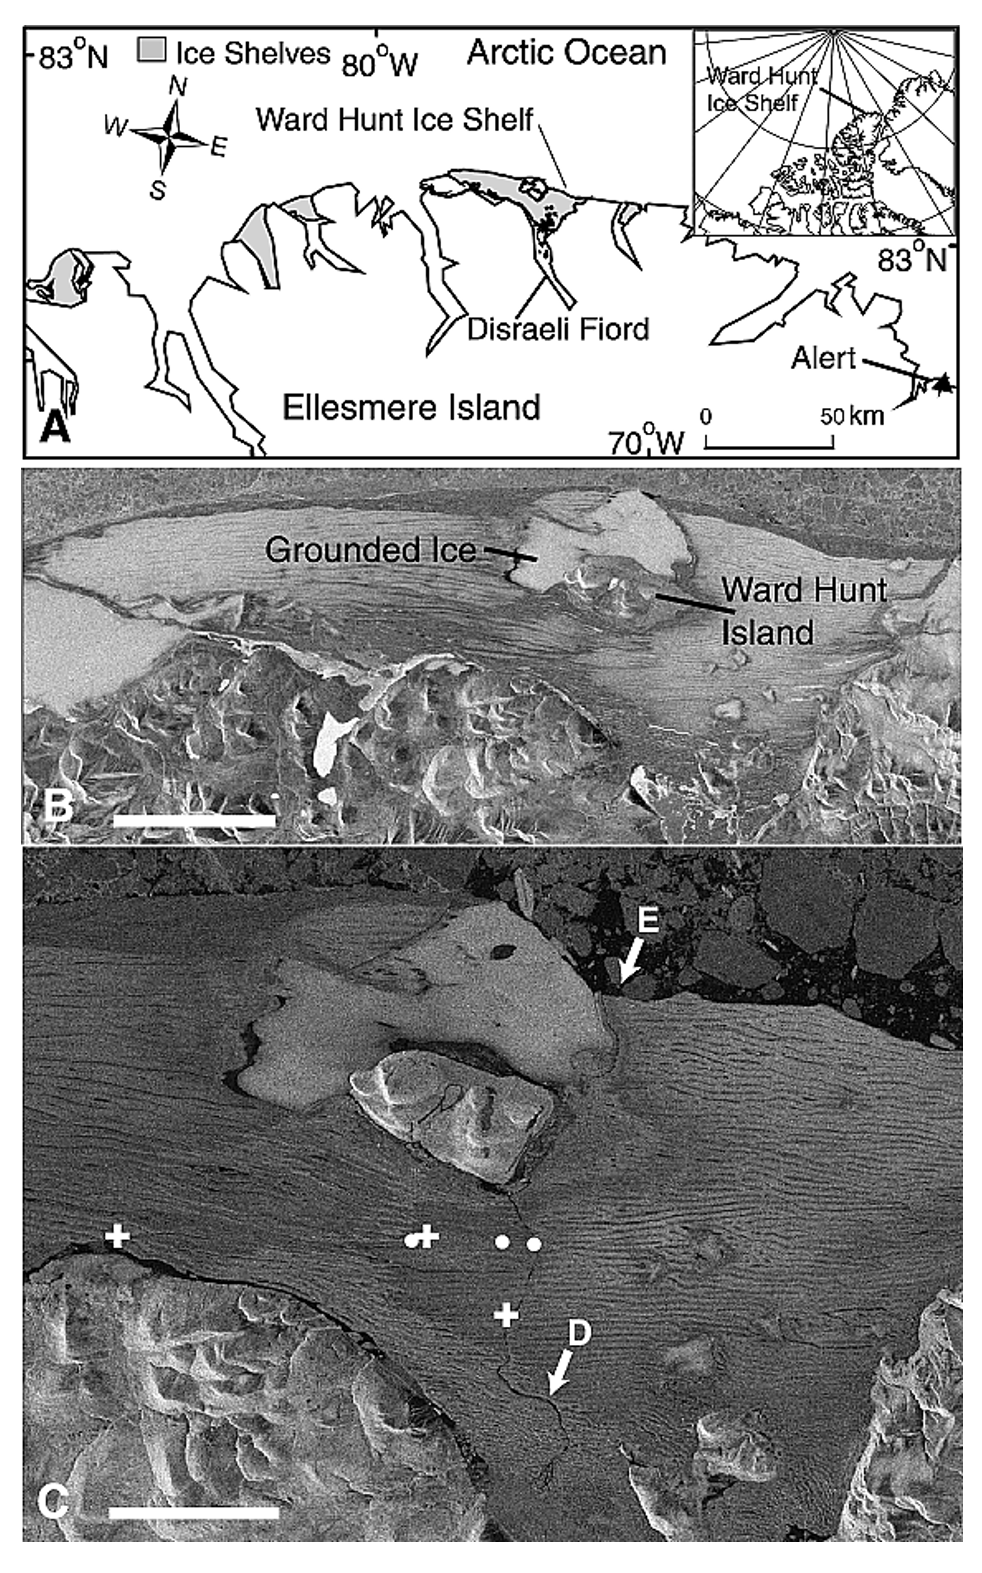
This figure shows the development of cracks and calving on the Ward Hunt Ice Shelf. A: Location map; B: Ice shelf before crack development; C: After crack development; D: Main north-south crack; E: Indentation resulting from ice shelf loss.— Credit:doi:10.1029/2003GL017931, 2003
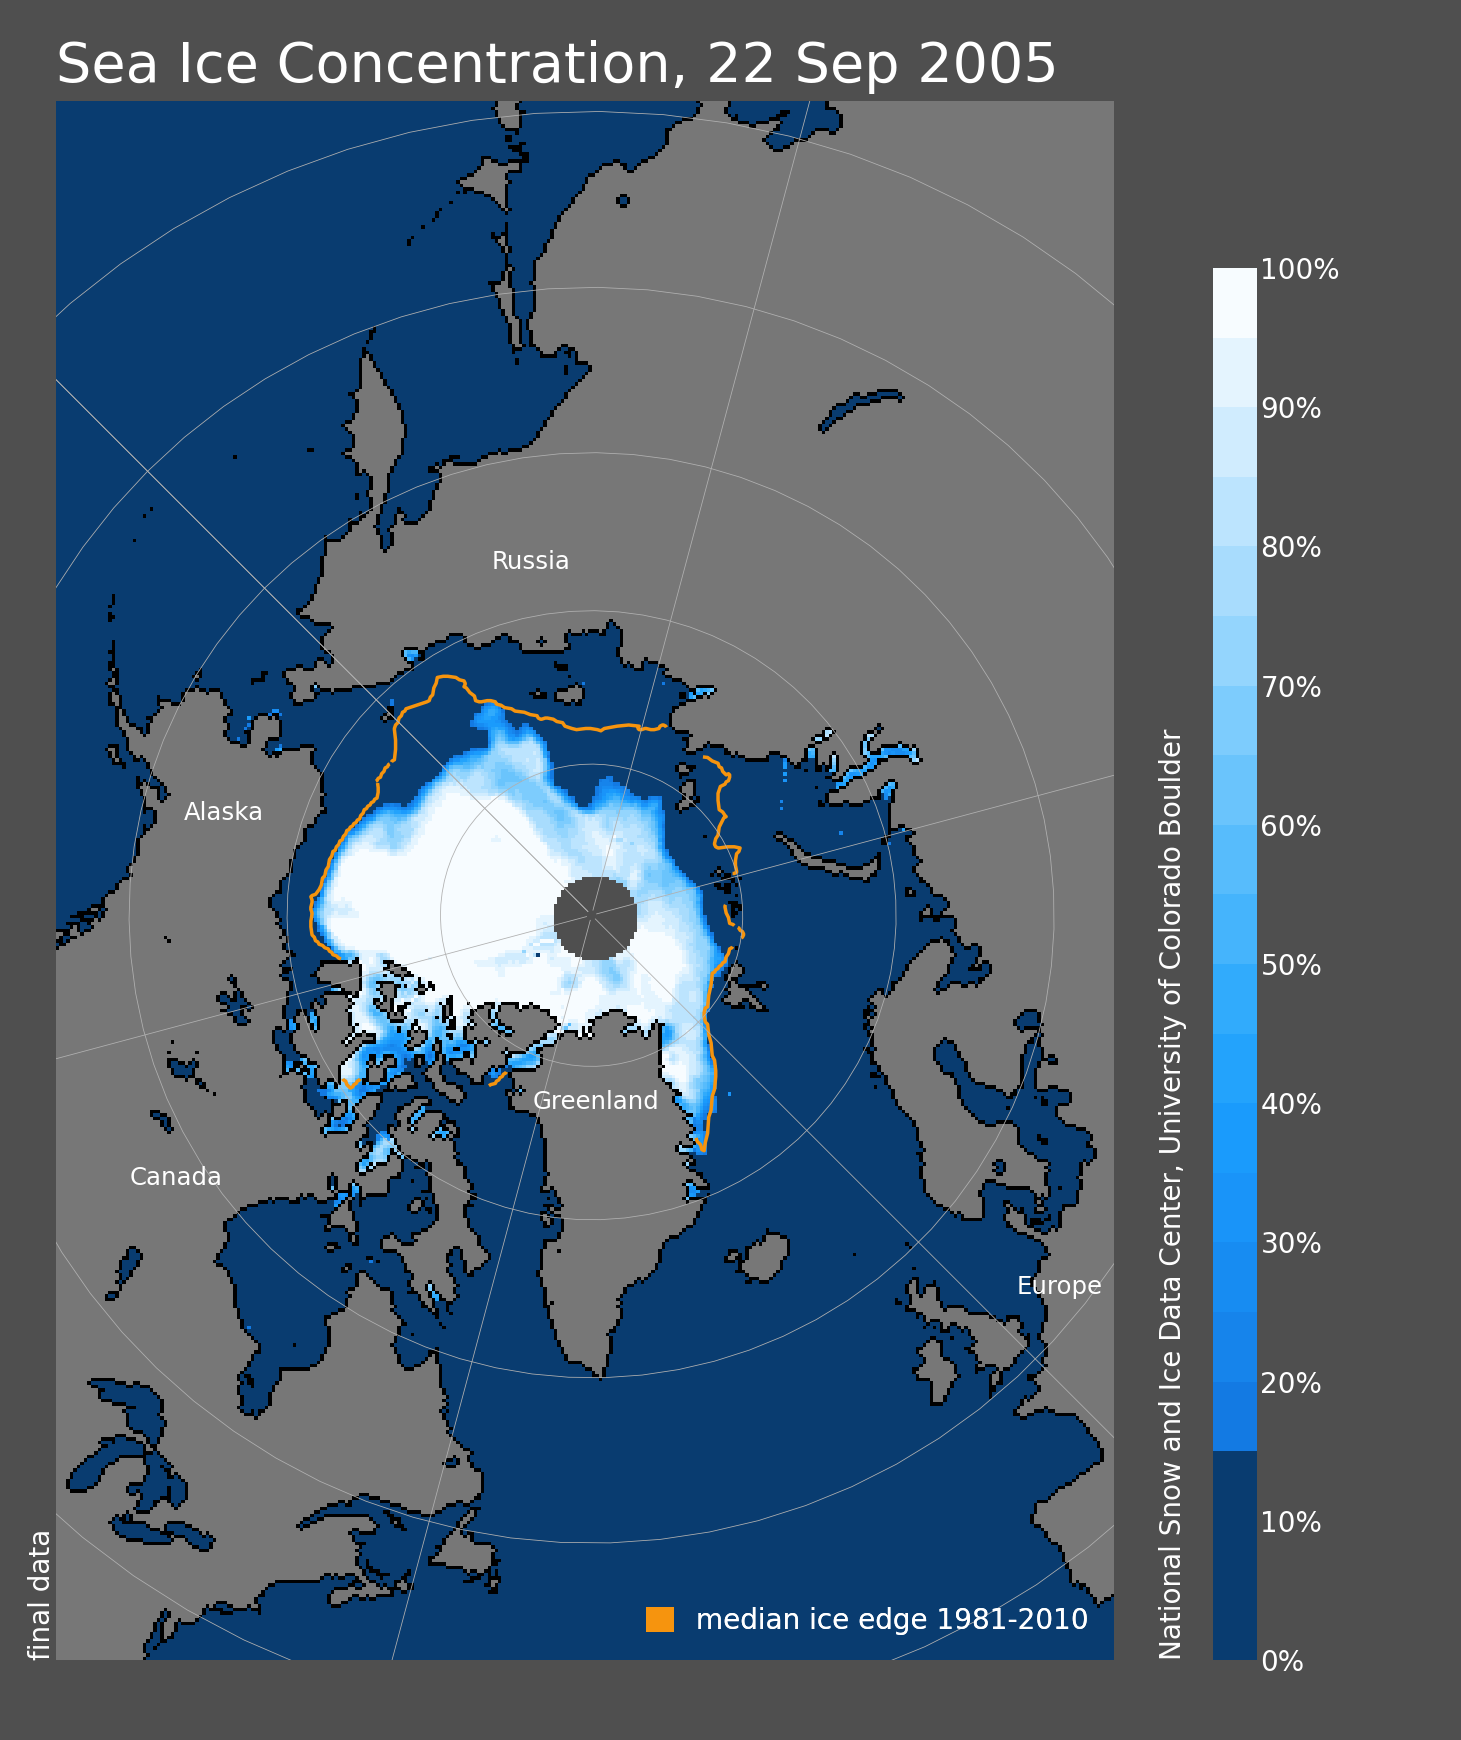
The Arctic sea ice minimum extent reached on September 22, 2005, was the lowest extent on record at that time. As of mid-August 2026, the 2005 extent was twentieth lowest on record.— Credit:Sea Ice Index
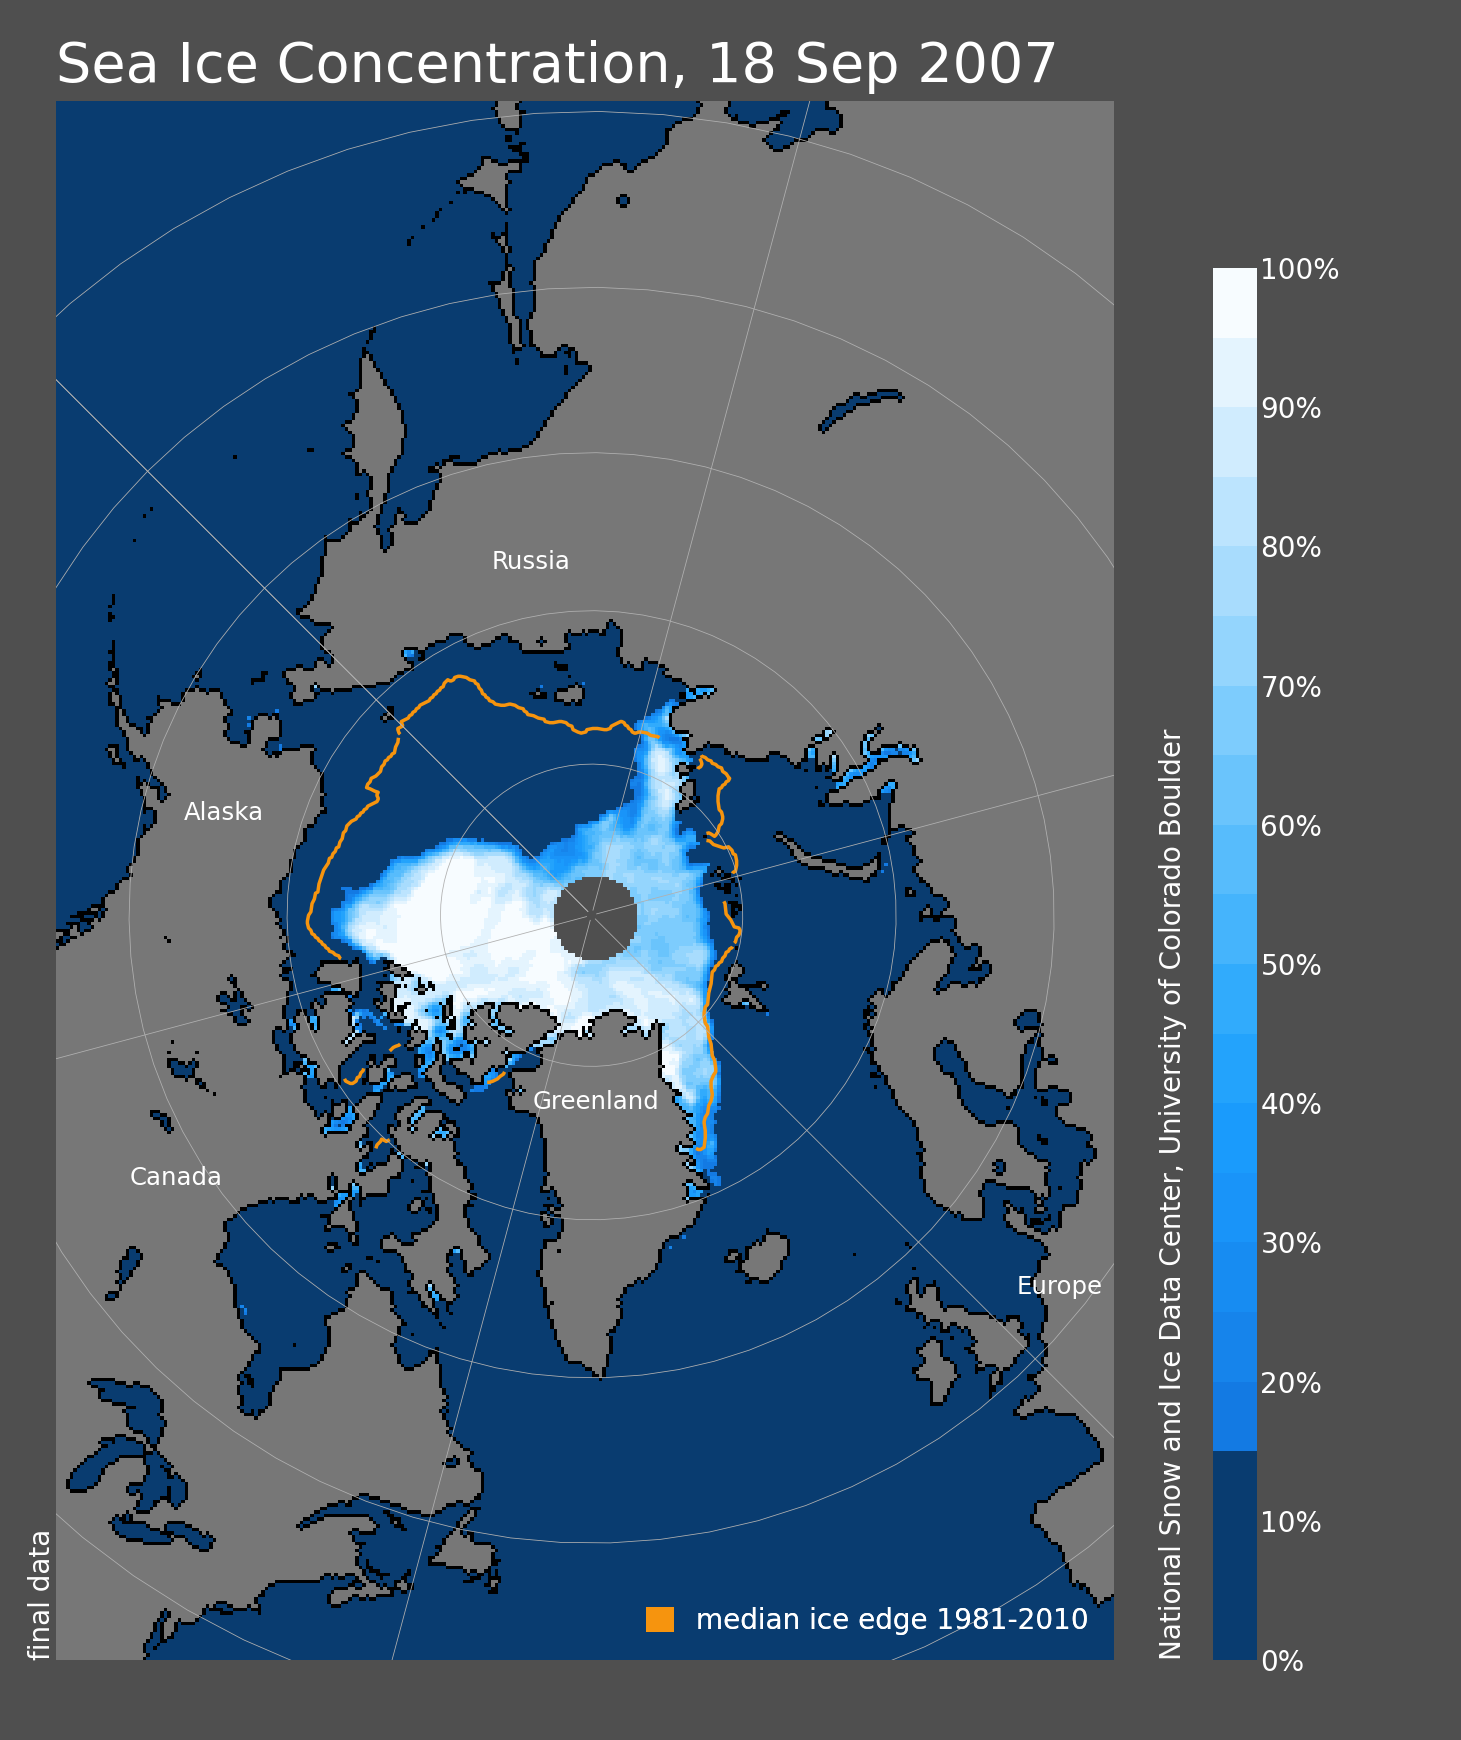
The Arctic sea ice minimum extent reached on September 18, 2007, displaced the 2005 minimum as the new record holder. As of mid-August 2026, the 2007 extent was third lowest on record.— Credit:Sea Ice Index
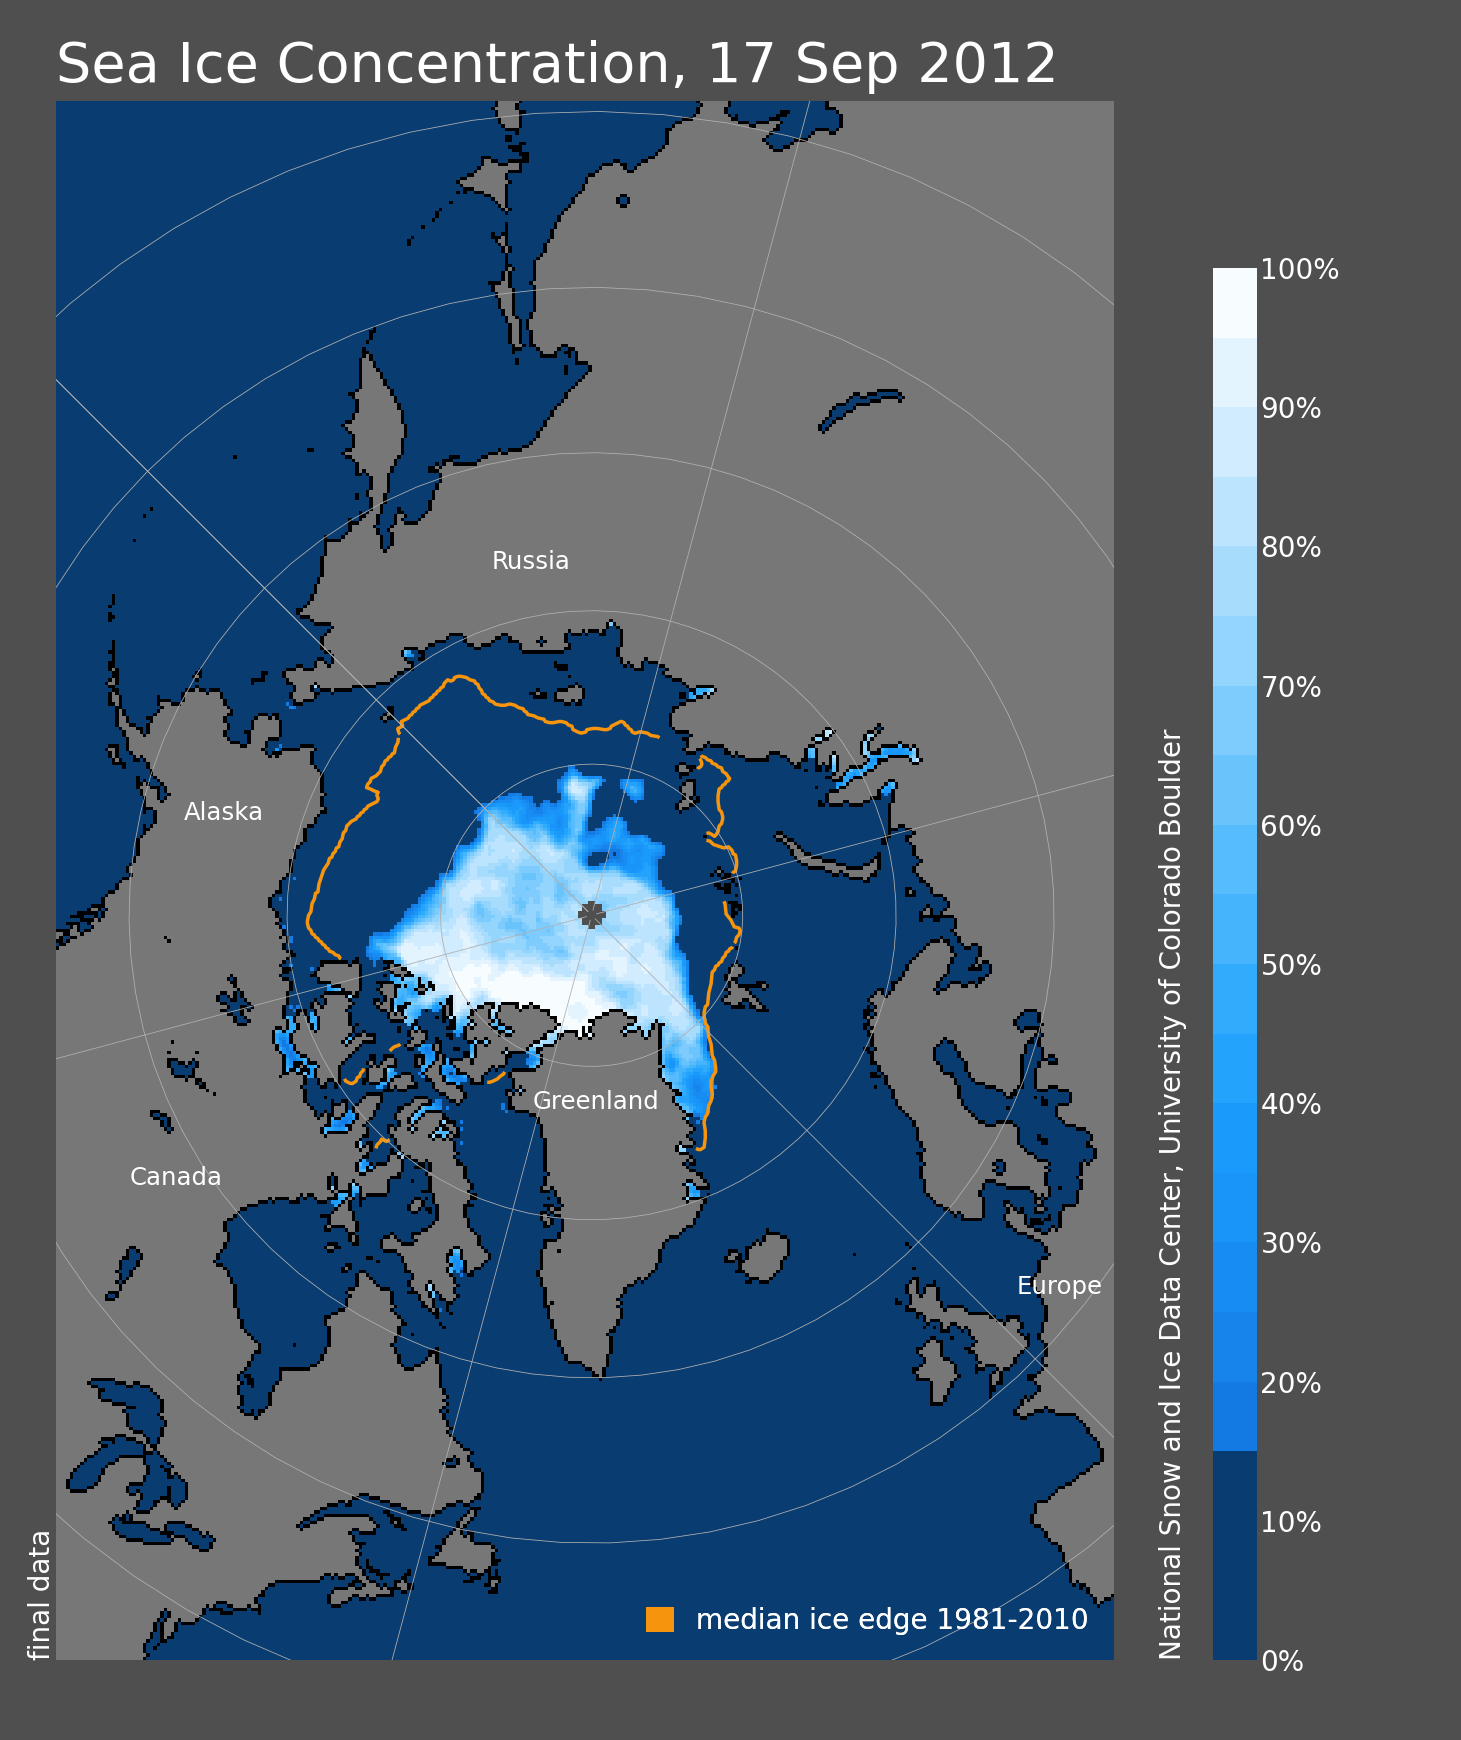
The Arctic sea ice minimum extent reached on September 17, 2012, became the new record-low extent. As of mid-August 2026, the 2012 extent still stood as lowest on record.— Credit:Sea Ice Index
In late February 2008, the Wilkins Ice Shelf on the western side of the Antarctic Peninsula disintegrated in a matter of hours. These images, acquired by NASA’s Terra satellite, show how much the ice shelf changed in a single day.— Credit:NASA
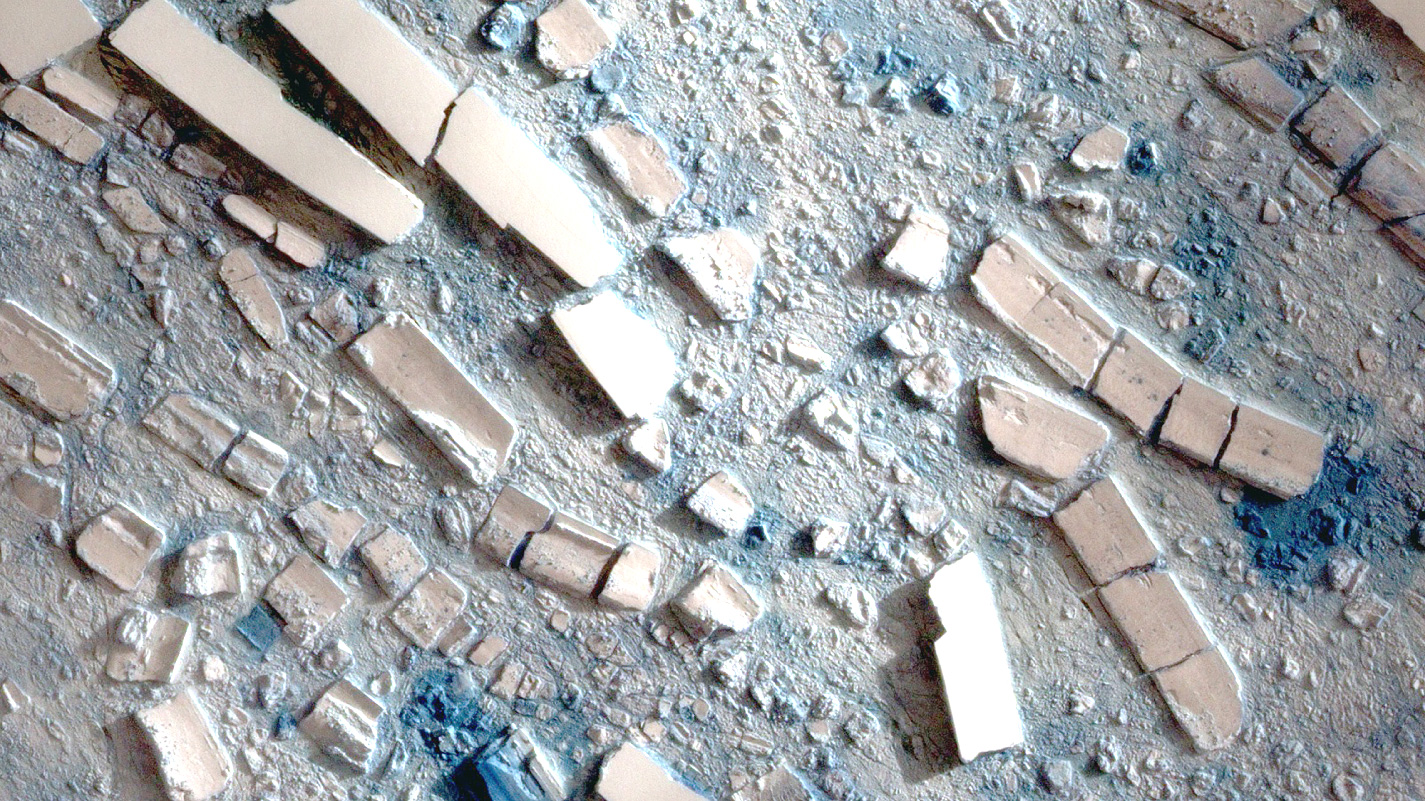
When an ice shelf disintegrates, the shelf is often sliced into tall, thin blocks that topple like dominoes. This Formosat-2 image shows the domino-toppling effect. The ice blocks that have remained upright have very smooth, slightly whiter surfaces. The ice blocks that have toppled bear rough, grooved surfaces with isolated bluish patches Some blocks have broken apart further, possibly after rotating upward from the bottom of the ice shelf. With lower pressure on the surface of the ocean, the blocks split apart and roll again, removing the snow cover. — Credit:Cheng-Chien Liu at Taiwan’s National Cheng Kung University
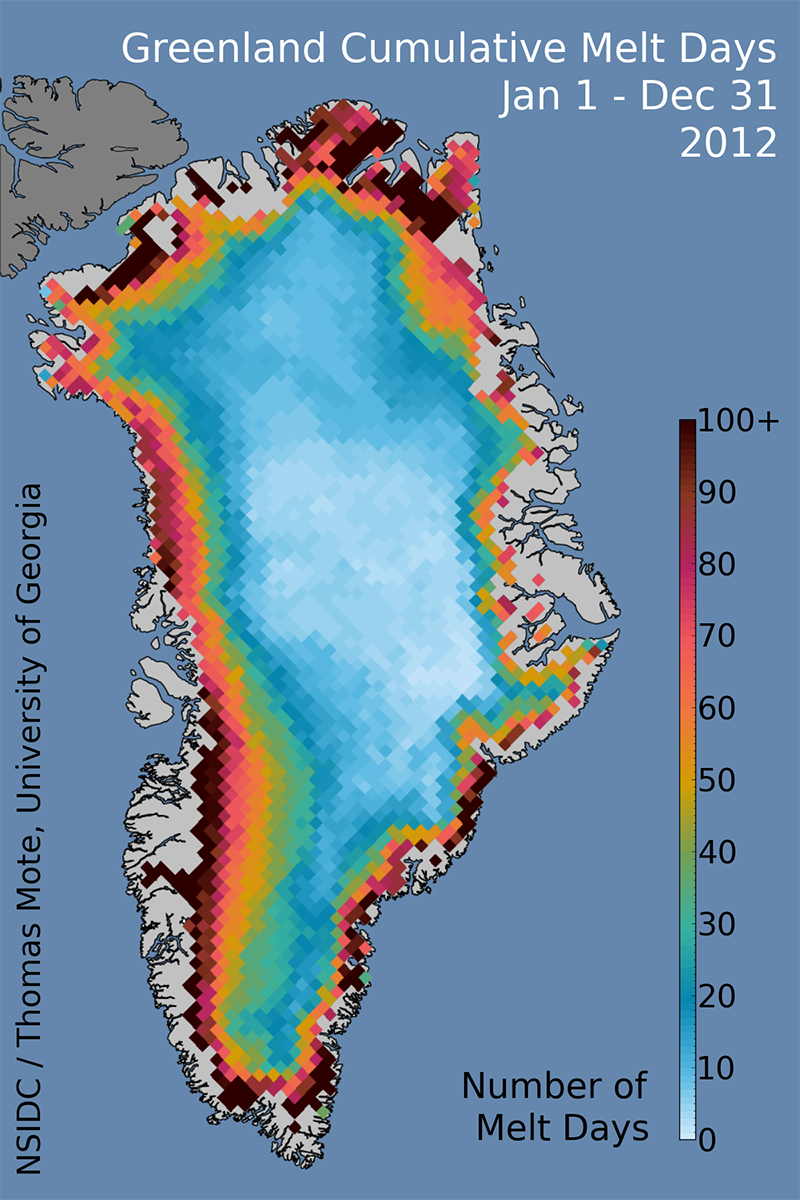
The number of melt days in 2012 on the Greenland Ice Sheet exceeded 120 for low-elevation areas along the southwestern coast, and values above 100 days occurred in the far north and southeastern coastal areas.— Credit:NSIDC and Thomas Mote/University of Georgia
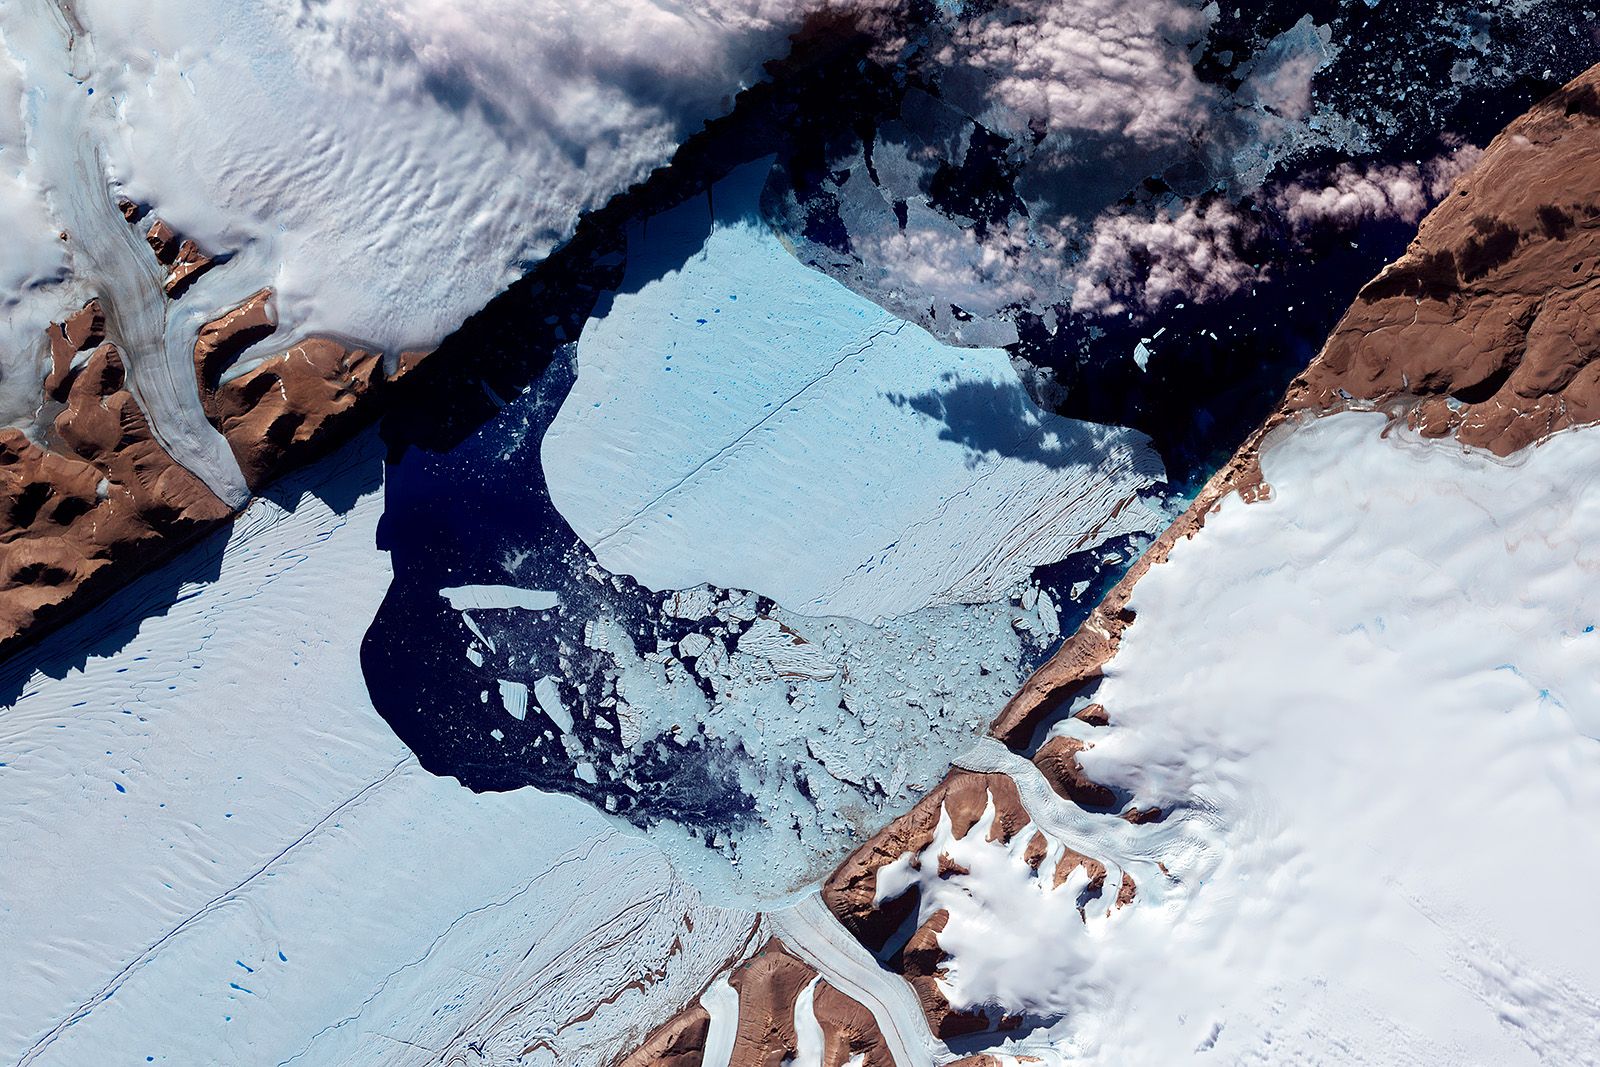
On July 21, 2012, the Advanced Spaceborne Thermal Emission and Reflection Radiometer (ASTER) on NASA’s Terra satellite captured this image of an ice island floating away from the ice tongue that calved it. The ice island broke free from Petermann Glacier in northwestern Greenland. North is to the right in this image.— Credit:NASA
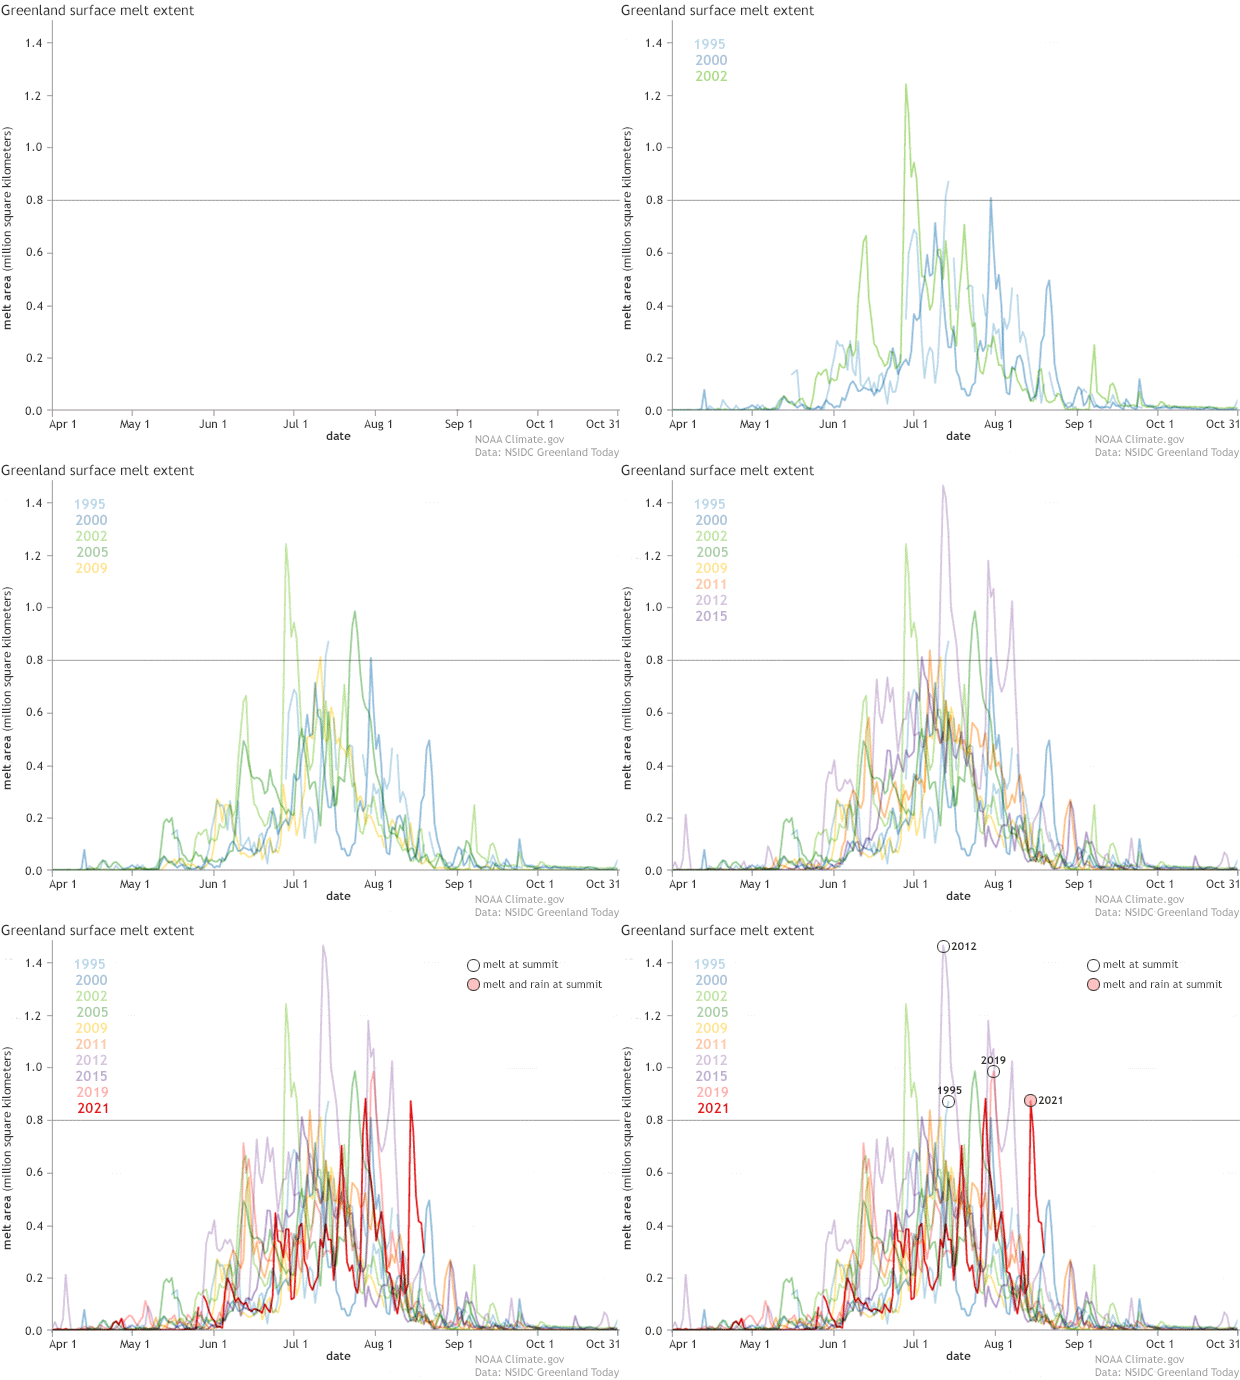
On August 14, 2021, temperatures rose above freezing and rain fell at Summit Station, Greenland, for several hours. In the words of NSIDC’s Walt Meier, “Holy schnikes! It rained at the top of Greenland.” Click on the image to start the animation.— Credit:NSIDC
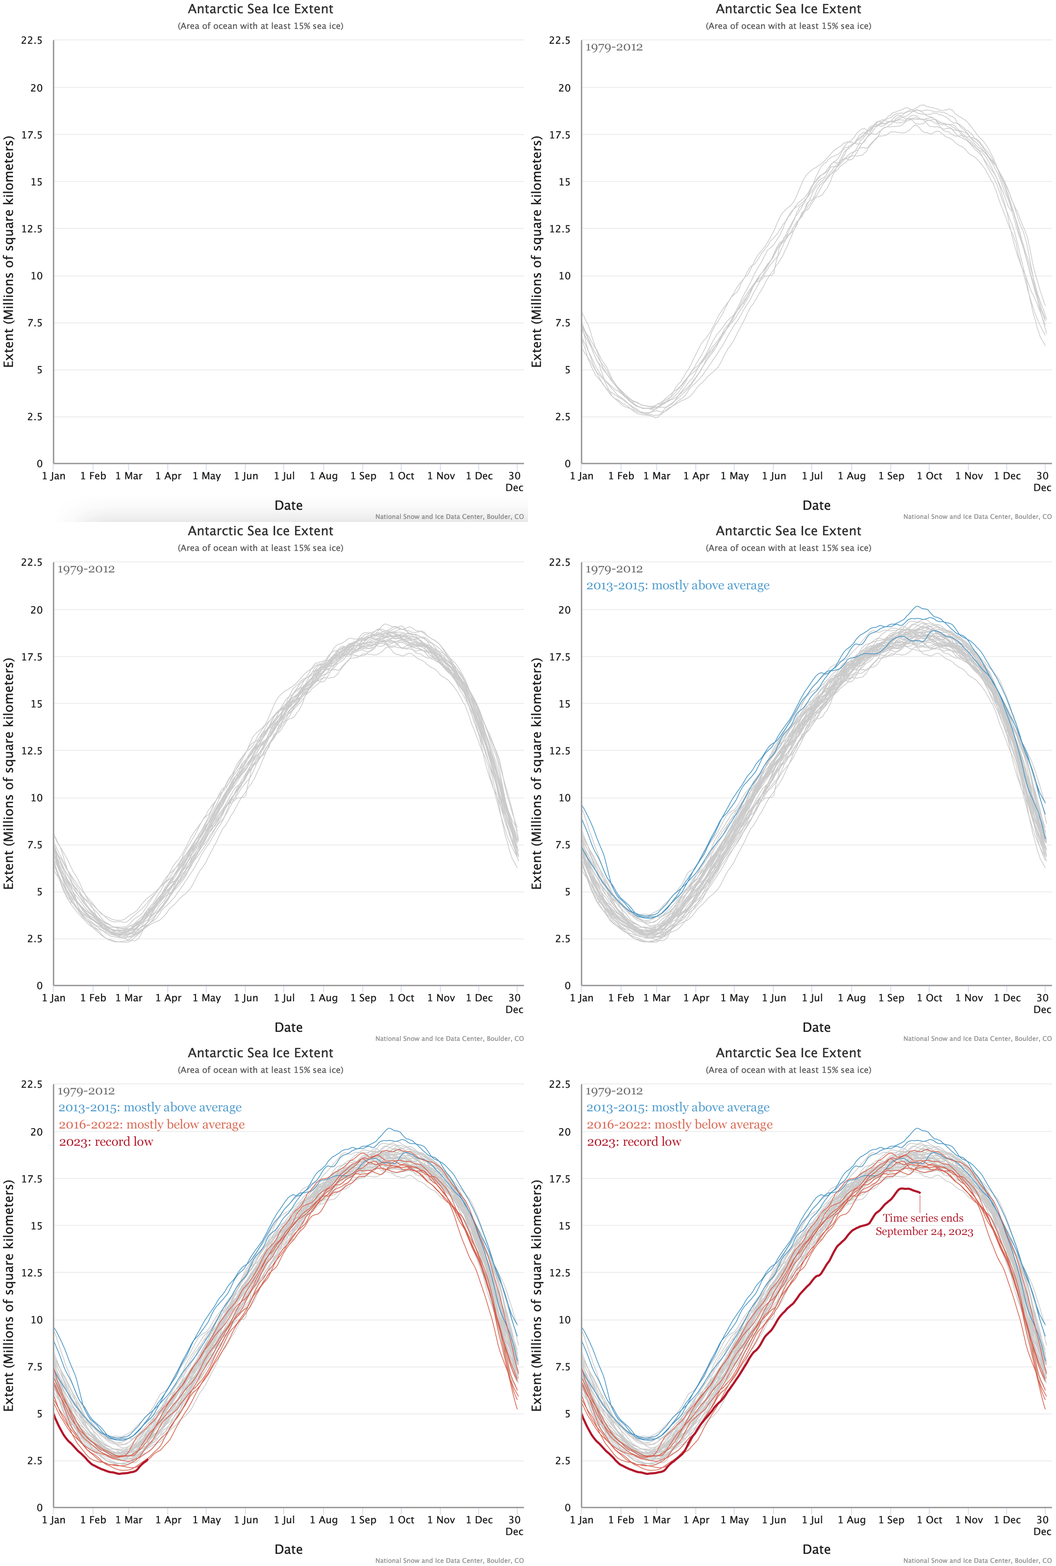
The year 2023 brought record-low Antarctic sea ice extents for both the summer minimum and the winter maximum. It was the first time that Antarctic winter sea ice did not exceed 17 million square kilometers (6.56 million square miles). It fell more than a million square kilometers below the previous record low maximum extent set in 1986. Click on the image to start the animation.— Credit:NSIDC
Hektoria Glacier began accelerating after the 2002 disintegration of the Larsen B Ice Shelf on the Antarctic Peninsula. Two decades later, the glacier continued its rapid movement. The glacier also retreated rapidly between 2022 and 2024.— Credit:NASA