GoLIVE Map Application User Guide
The GoLIVE Map Application allows users to spatially search for and download land ice velocities derived from panchromatic imagery collected from May 2013 to present.
Spatial coverage of the GoLIVE data product covers all terrestrial permanent ice with an area greater than 5 km2 between 82°S to 82°N latitude. The data are provided in Network Common Data Format (NetCDF) (.nc) as geolocated grids of x and y velocity components at 300 m grid spacing with accompanying error and quality parameters. In addition, corresponding Geospatial Tagged Image File Format (GeoTIFF) (.tif) and Portable Network Graphics (PNG) (.png) browse images showing scalar ice flow (vv) are provided with each data file to assist users with selecting preferred data for their study.
The GoLIVE Map Application also includes several data layers external to the GoLIVE project that may assist users with searching for and viewing data. These include:
- GIBS Blue Marble Layer
- GoLIVE Coverage
- Coastlines
- Map Graticules
- Land Masks
Notes
This large data set includes scenes with significant cloud cover and undetected offset errors. Because the data were developed from images taken under changing snow, cloud cover, and lighting conditions, the data may include apparent areas of ice or topographic motion that are in fact stationary or moving in a different directions. Thus, you are asked to apply your best judgement when using these data, and to use the provided browse images to identify such issues.
The GoLIVE data archive evolves with upstream processing at the USGS. The first major shift in processing occurred 1 May 2017, when the USGS implemented a new processing scheme classifying data based on methods in image geolocation. Data received prior to 1 May 2017 are known as Pre-Collection 1 and data produced after 1 May 2017 is now Collection 1. Pre Collection 1 data was processed by the NSIDC before archival. Collection 1 data is first processed by the USGS and classified into three Tiers before NSIDC receives the data. Tier 1 and Tier 2 data are archived directly, while near-real-time GoLIVE products are made temporarily available for 120 days post processing. In addition, Landsat grids over faster flowing regions in Greenland were reprocessed using a higher maximum velocity cutoff. Therefore, in these regions, files may contain more velocity data than what is reported in the initial release of the GoLIVE product.
Features
- View GoLIVE coverage and tile extents
- Customize search with interactive zoom/pan and layer selection
- Interactively select GoLIVE tiles for download
- Receive links to only the FTP Path/Row subdirectories relevant for your search
Layers
Data layers
- GoLIVE Coverage
Map layers
- GIBS Blue Marble
- Coastlines
- Graticule
- Land Mask
Data sources
How to use the Map Server Interface
First, go to the GoLIVE Map Application web interface.
Perform the following steps to choose GoLIVE data tiles
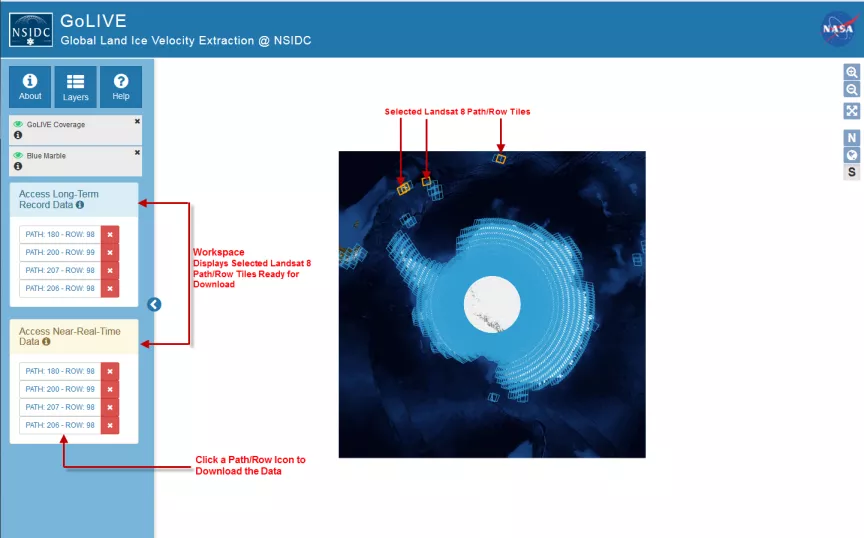
Step 1: Select the preferred map view by clicking on the appropriate icon.
- Polar Stereographic North (EPSG-3413)
- Mercator Projection (EPSG-4326)
- Polar Stereographic South (EPSG 3031)
Step 2: Next, click on the Layers tab to open up the Layers dialog box.
The Blue Marble Layer is displayed by default (see below). You may remove this layer if you want or keep it.
Step 3: From the Layers dialog box, choose the GoLIVE Coverage layer.
Step 4: Select tiles by clicking on a point on the map.
- All tiles that overlap that point will be selected and will be highlighted orange.
- Reset and remove selection by clicking outside the region of polygons.
PLEASE NOTE: Changing map views will not reset selections.
Step 5: Click on the Selected GoLIVE Data Path-Row icon to get the data
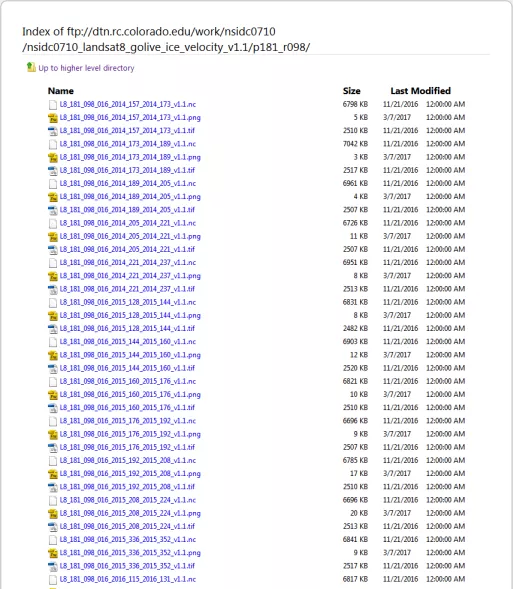
- An FTP directory displays containing the data files.
- You can download and browse the GoLIVE data from these links.
FTP Directory Containing Data Files
The image below is an example of the FTP Directory for each Path/Row Data File. Refer to the File Naming Convention section for information on how to read the data files.
File naming convention for data processed after 1 May 2017
As of 1 May 2017 the USGS has changed the processing and filename structure of Landsat 8 data. This new Collection 1 data set is used for velocity fields that use imagery from 1 May 2017 onwards. Collection 1 Landsat data are organized into Tiers based on the level of processing. USGS Collection 1 Landsat Tier levels are RT, T1, or T2:
RT (Real-Time) - newly acquired scenes that use preliminary geolocation
T1 (Tier 1) - tie-points used in the final scene geolocation
T2 (Tier 2) - no tie-points used in final geolocation
As a result of this change, the newer GoLIVE products have the processing Tier levels added to their filenames. Velocity products that are produced with RT images and noted with nrt in the filenames will eventually be replaced as the USGS reprocesses imagery and assigns them to Tier 1 or 2 categories.
Users are advised to use T1 and T2 data for their analysis. RT images are replaced by the USGS after 14 to 16 days with Tier 1 or 2 level data. GoLIVE velocity products that use RT input data will be updated in the next monthly cycle to use these final versions.
This section explains the file naming convention used for this product with an example.
Example Tier 1 and Tier 2 file names
L8_001_004_016_2017_104_2017_120_T2T2_v1.1.ncL8_001_004_016_2017_104_2017_120_T2T2_v1.1.pngL8_001_004_016_2017_104_2017_120_T2T2_v1.1.tif
[satellite]_[path]_[row]_[delt]_[image1year]_[image1doy]_[image2year]_[image2doy]_[tier level first image second image]_[version]_[file format]
Example Near-Real-Time (.nrt) file names
L8_011_247_016_2017_174_2017_190_T1RT_v1.1_nrt.nc
L8_011_247_016_2017_174_2017_190_T1RT_v1.1_nrt.png
L8_011_247_016_2017_174_2017_190_T1RT_v1.1_nrt.tif
[satellite]_[path]_[row]_[delt]_[image1year]_[image1doy]_[image2year]_[image2doy]_[tier level firt image second image]_[version]_[nrt]_[file format]
Refer to Table 1 for the valid values for the file name variables listed above.
Table 1. File naming convention
| Variable | Description |
|---|---|
Satellite | L8 for Landsat8 |
Path | Landsat 8 orbit path |
Row | Landsat 8 orbit row |
Delt | Time separation between Image 1 and Image 2 reported in days |
Image1year | Image 1 year acquisition |
Image1doy | Image 1 acquisition |
Image2year | Image 2 year acquisition |
Image2doy | Image 2 day acquisition |
Tier Level | USGS Collection 1 Landsat Tier Levels are T1, T2, or RT. T1 (Tier 1) - tie-points used in the final scene geolocation T2 (Tier 2) - no tie-points used in final geolocation RT (Real-Time) - newly acquired scenes that use preliminary geolocation. |
| nrt | Near-real-time data - newly acquired scenes that use preliminary geolocation that will eventually be reprocessed and assigned to a T1 or T2 category. |
Version | Version number of the data |
.File Format | .nc = NetCDF format CF-1.6 .png = Portable Network Graphics Format .tif = GeoTiff format |
File naming convention for pre-collection 1 data processed prior to 1 May 2017
This section explains the file naming convention used for Pre-Collection 1 data with an example.
Example file name
L8_001_004_016_2014_080_2014_096_v1.1.ncL8_001_004_016_2014_080_2014_096_v1.1.tif
[satellite]_[path]_[row]_[delt]_[image1year]_[image1doy]_[image2year]_[image2doy]_[version].nc
[satellite]_[path]_[row]_[delt]_[image1year]_[image1doy]_[image2year]_[image2doy]_[version].tif
Refer to Table 1 for the valid values for the file name variables listed above.
Table 2. File naming convention
| Variable | Description |
|---|---|
Satellite | L8 for Landsat8 |
path | Landsat 8 orbit path |
row | Landsat 8 orbit row |
Delt | Time separation between Image 1 and Image 2 reported in days |
Image1year | Image 1 year acquisition |
Image1doy | Image 1 acquisition |
Image2year | Image 2 year acquisition |
image2doy | Image 2 day acquisition |
Version | Version number of the data |
.nc | NetCDF format CF-1.6 |
.tif | GeoTiff format |
.png | Portable Network Graphics format |
Related map servers
- Global Land Ice Measurements from Space (GLIMS) Glacier Database
- WGMS Fluctuations of Glaciers Browser
- Dresden University: Velocity Fields of Greenland Outlet Glaciers
Citing this application
Please use the following citation when referencing the GoLIVE Map Application:
Scambos, T., M. Fahnestock, T. Moon, A. Gardner, and Marin Klinger. 2016. Global Land Ice Velocity Extraction from Landsat 8 (GoLIVE), Version 1. [Indicate subset used]. Boulder, Colorado USA. NSIDC: National Snow and Ice Data Center. doi: http://dx.doi.org/10.7265/N5ZP442B [Date Accessed].
Have questions or feedback?
We welcome your feedback on this project. If you have questions, comments, or suggestions, please contact NSIDC User Services by clicking the Support button on the lower right side of this webpage.
Acknowledgments
The development of this GoLIVE map server application was supported by NASA Grants NNX14AR77G and NNX15AC70G to M. Fahnestock and NNX10Al42G (supplement) to T Scambos, as well as USGS Contract G12P00066 to T. Scambos (supporting T. Haran and M. Klinger). T. Moon was supported as a Cooperative Institute for Research in Environmental Science (CIRES) Visiting Post-Doctoral Fellow at the University of Colorado, Boulder for July 2014 – June 2015. Funding for A. Gardner's effort was supported by NASA's Cryosphere program.
Storage Resources were provided by NSF-MRI Grant ACI-1126839, MRI: Acquisiton of a Scalable Petascale Storage Infrastructure for Data-Collections and Data-Intensive Discovery. This work utilized the Janus supercomputer, which is supported by the National Science Foundation (award number CNS-0821794) and the University of Colorado Boulder. The Janus supercomputer is a joint effort of the University of Colorado Boulder, the University of Colorado Denver and the National Center for Atmospheric Research.
About the GoLIVE project
The Global Land Ice Velocity Extraction from Landsat (GoLIVE) project was created by the National Snow and Ice Data Center (NSIDC) under NASA funding. GoLIVE is a processing and staging system for near-real-time global ice velocity data derived from Landsat 8 panchromatic imagery.
The system performs repeat image feature tracking using newly developed Python Correlation (PyCorr) software applied to image pairs covering all glaciers > 5km2 as well as both ice sheets. GoLIVE runs on the University of Colorado’s supercomputer and Peta Library storage system to process ~10,000 image pairs per hour. The data are provided in Network Common Data Format (NetCDF) as geolocated grids of x and y velocity components at 300 m spacing with accompanying error and quality parameters. GoLIVE NetCDF files contain multiple variables including unmasked and masked ice velocity vectors, the magnitudes of those vectors, and several data quality variables.


