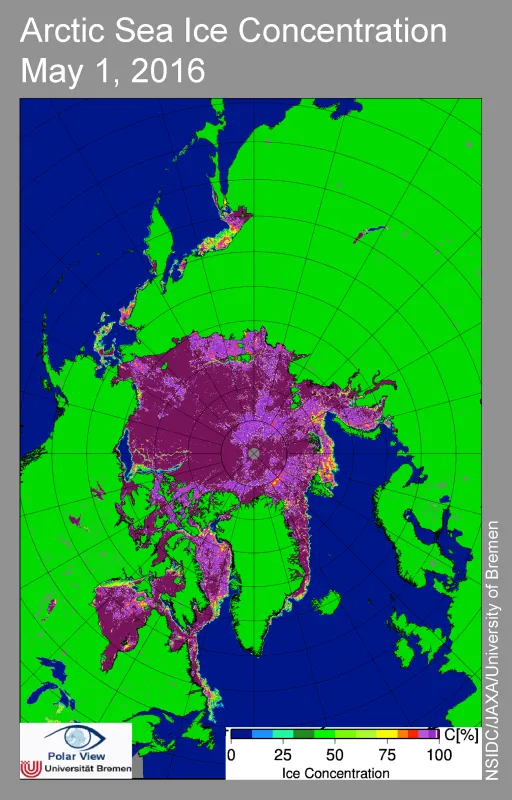
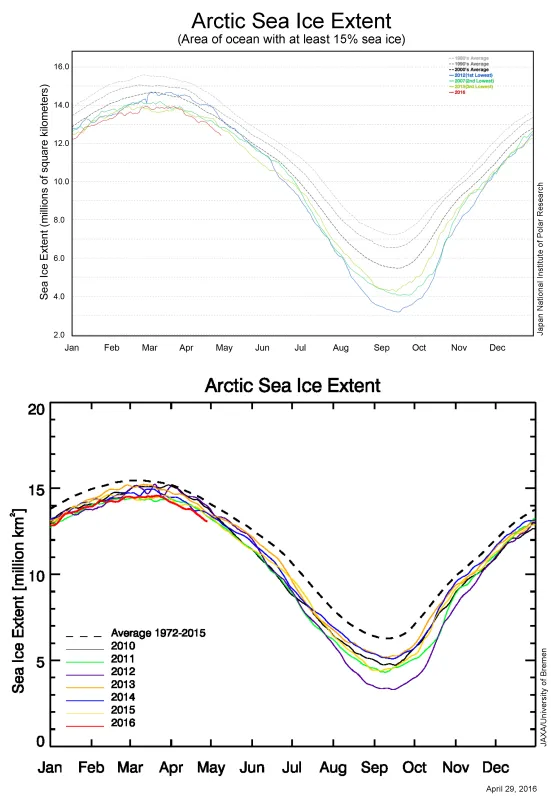
The Defense Meteorological Satellite Program (DMSP) F17 satellite is experiencing continuing issues with its passive microwave sensor. Data from the 37V channel, used to observe sea ice, have been unusable since early April, although the 37H channel used for the Greenland Ice Sheet Today melt area mapping is unaffected. NSIDC is working to bring the DMSP F18 satellite online for its near-real-time source of data for sea ice monitoring. Based on other data sources, sea ice extent remains far below average for the satellite record period, and likely setting record daily lows. The April sea ice decline rate appears to have been slightly faster than average.
Overview of conditions
The Arctic Sea Ice News and Analysis reference sea ice product, the Sea Ice Index, will be suspended until a new calibration can be completed for the F18 satellite, which is underway. The Advanced Microwave Scanning Radiometer 2 (AMSR2) instrument flying on Shizuku (GCOM-W1), a satellite operated by the Japan Aerospace Exploration Agency (JAXA), provides data on sea ice extent and rates of change, but because it uses a different sensor and processing algorithm, the extent numbers cannot be directly compared with those from the SMMR-SSM/I-SSMIS instruments record; the AMSR2 algorithm gives extents that differ by several tens of thousands of square kilometers, or a fraction of a percent to a few percent of total sea ice extent.
A look at the Arctic Data archive system at the National Institute of Polar Research in Japan reveals that sea ice since mid-April has remained at record low daily levels as assessed over their archive of sea ice extent, and is approximately 400,000 square kilometers (154,400 square miles) below the previous daily record extents at this time. This is supported by another analysis of sea ice extent produced by the University of Bremen using the same satellite but a different sensor channel. Both assessments of sea ice extent indicate that the April rate of decline for 2016 is slightly faster than the long-term average of their respective archives. Another sea ice monitoring site, The Cryosphere Today, continues to use the DMSP F17 data, and their graphics show evidence of the sensor issues. This site reports sea ice area in its graphical trend, not extent (area of ocean with at least 15% sea ice coverage) as do the other sites and NSIDC. However, the trend and record low daily extents for the second half of April may be interpreted from these data as well.
Conditions in context
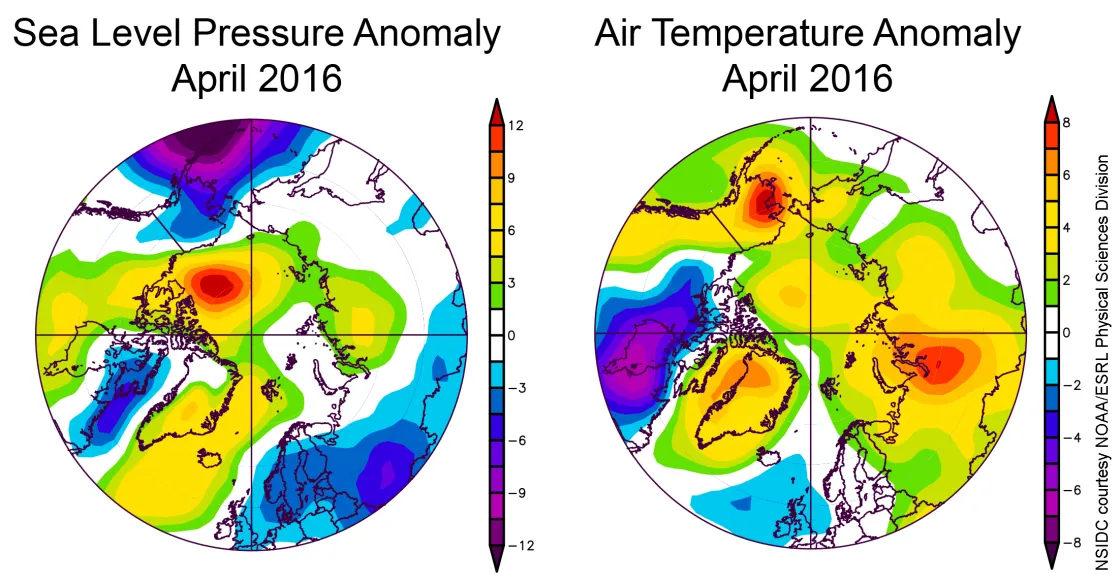
April 2016 was quite warm over nearly all of the Arctic Ocean. Air temperatures at the 925 hPa level (about 2,500 feet above the surface) were typically 3 to 5 degrees Celsius (6 to 9 degrees Fahrenheit) above average over the central Arctic Ocean, with larger positive departures compared to average over central Siberia (6 to 8 degrees Celsius, or 11 to 18 degrees Fahrenheit). The sea level pressure pattern featured above average pressures over the Beaufort Sea north of Alaska, and below average pressures over the Aleutians, western Baffin Bay, and Scandinavia. The April 2016 Arctic Oscillation Index transitioned from positive to negative through the month, consistent with the varied patterns of pressure over the Arctic. See our previous discussion of the Arctic Oscillation.
Twist and shout
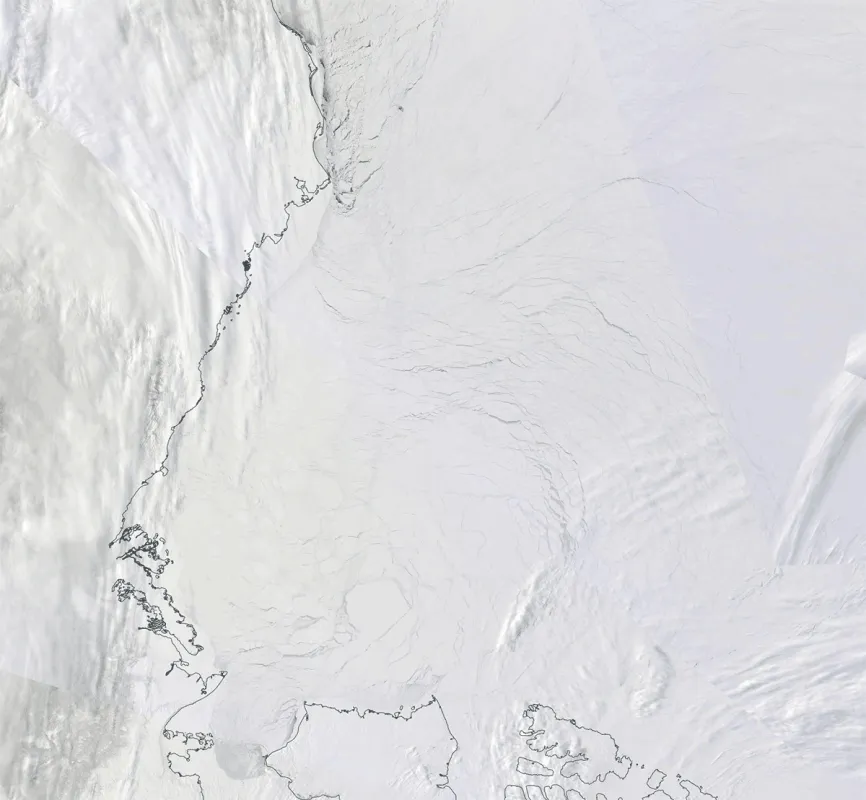
Using a series of images from the Moderate Resolution Imaging Spectrometer (MODIS) from NASA Worldview, we created a short video showing sea ice drift north of Alaska in the Beaufort Sea. The strong anti-cyclonic (high air pressure) pattern produced surface winds that fractured the ice, twisting it in a clockwise direction and opening the pack ice significantly. Dramatic, similar fracturing of sea ice in the Beaufort Sea has been noted in earlier posts (see March 6, 2013).
Motion in the ocean
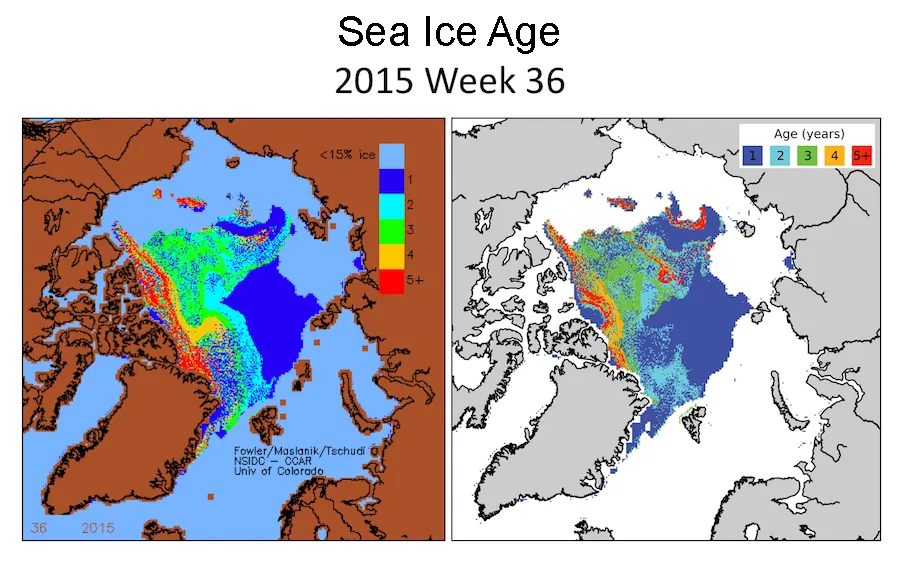
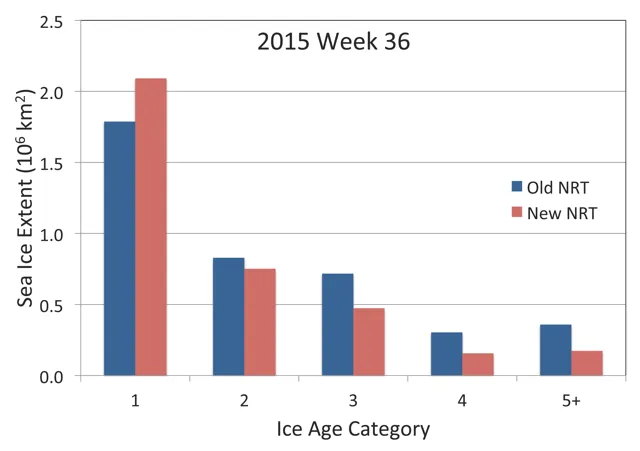
The NSIDC sea ice motion and sea ice age products have recently been updated via a release of Version 3. This version was created by re-running the previous algorithms, and incorporating a few improvements. First, a number of unrealistic AVHRR and buoy velocities that had been noted were removed. Also, a more accurate sea ice mask, based on the same sea ice concentration product used in our sea ice extent analysis, was implemented. Finally, the Version 3 updates include buoy-derived motions in the Arctic through the entire time series (1979 to 2015). Near-real-time processing of provisional ice age data, which are frequently shown here as a first look at ice conditions, has also been updated to include some of the improvements of Version 3, including the incorporation of near-real-time buoy data and NSIDC’s near-real-time sea ice concentration product as the basis for the sea ice mask. As with any near-real-time product, the fields should be considered provisional and are subject to change. Full details of the product changes and the new processing methods are included in the product documentation for Polar Pathfinder Daily 25 km EASE-Grid Sea Ice Motion Vectors, Version 3 and EASE-Grid Sea Ice Age, Version 3.
