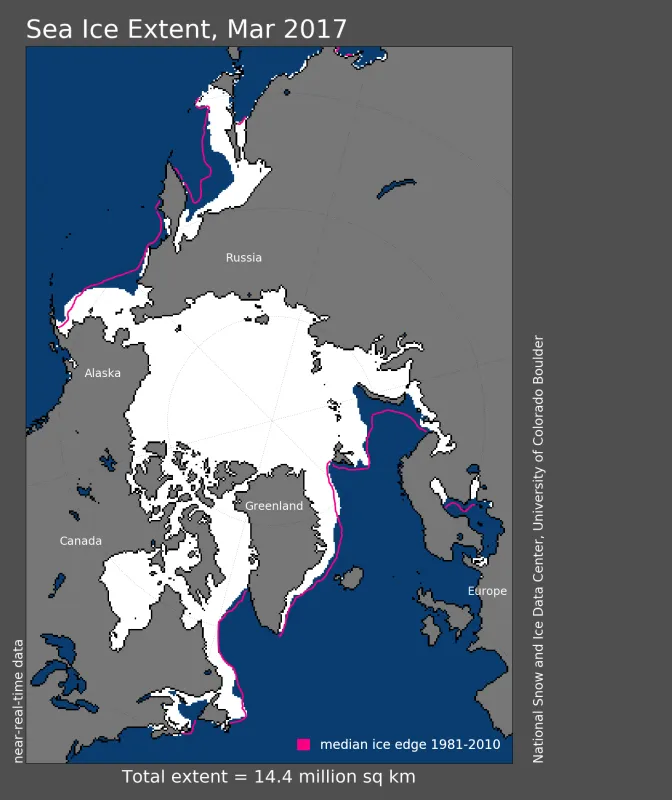
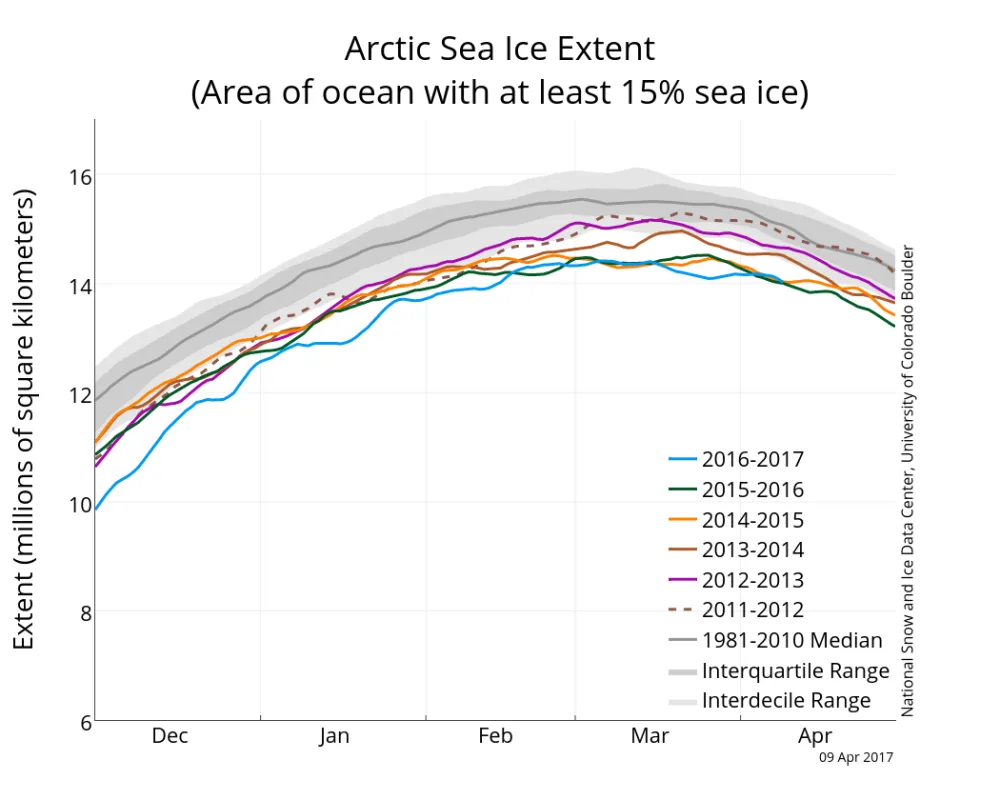
Arctic sea ice extent for March 2017 was the lowest in the satellite record for the month. The decline in ice extent has been uneven since the seasonal maximum was reached on March 7, 2017, with a modest period of expansion towards the end of the month.
Overview of conditions
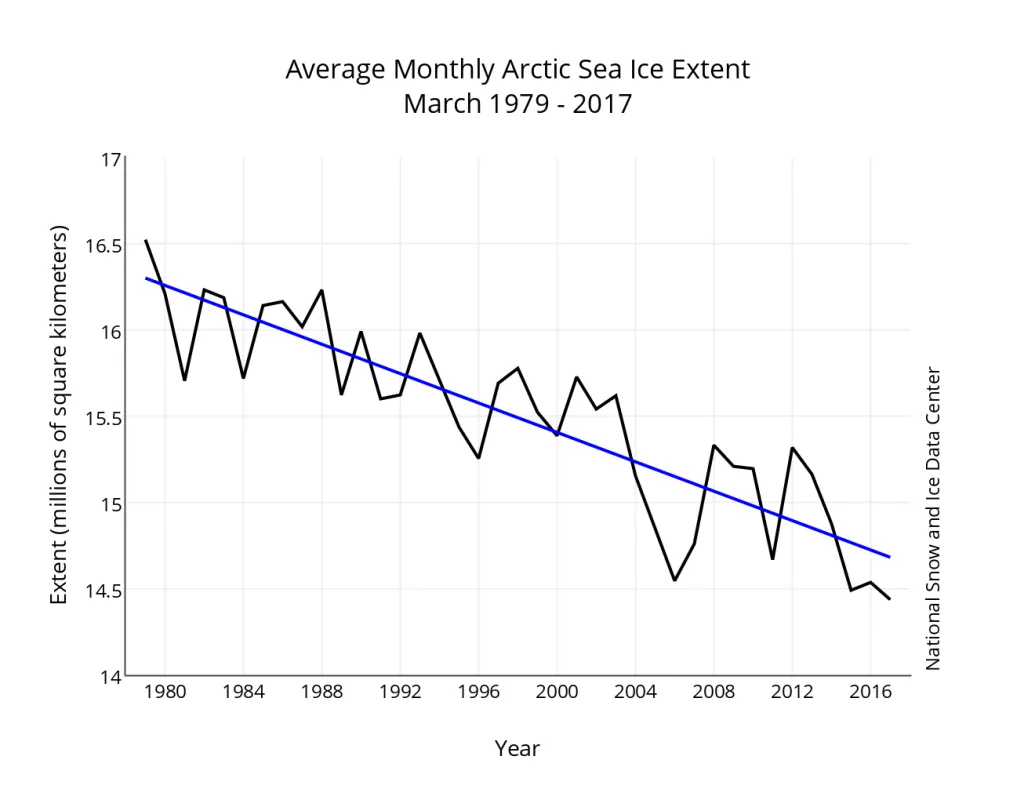
Arctic sea ice extent for March 2017 averaged 14.43 million square kilometers (5.57 million square miles), the lowest March extent in the 38-year satellite record. This is only 60,000 square kilometers (23,000 square miles) below March 2015, the previous lowest March extent, and 1.17 million square kilometers (452,000 square miles) below the March 1981 to 2010 long-term average. This month continues the record low conditions seen since October 2016.
Conditions in context
The decline in sea ice extent following the March 2017 seasonal maximum was interrupted by a brief period of expansion from about March 11 to 15, a decline extending through about March 26, then another period of growth through the end of the month into early April. On April 4th, the extent was greater than on the same day in 2016. This type of behavior is not unusual for this time of year when declines in extent in warmer, lower latitudes can be countered by periods of expansion in the still-cold higher latitudes. Shifts in wind patterns also lead to variability. Regions that experienced slight ice advance were at the end of the month in the Barents Sea and in the Bering Sea. Nevertheless, by early April, extent remained below average in the Barents Sea and in the Sea of Okhotsk and the western Bering Sea. Interestingly, ice extended further south than usual in the eastern Bering Sea.
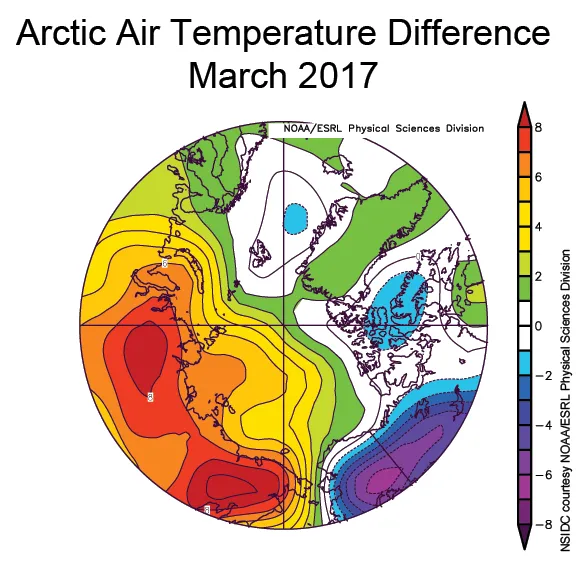
March saw continued warmth over the Arctic Ocean. The warmest conditions for March 2017 as compared to average were over Siberia. While temperatures were still well above average along the Russian coastal seas (6 to 7 degrees Celsius, or 11 to 13 degrees Fahrenheit), those over the northern North Atlantic and the Canadian Arctic Archipelago were near average.
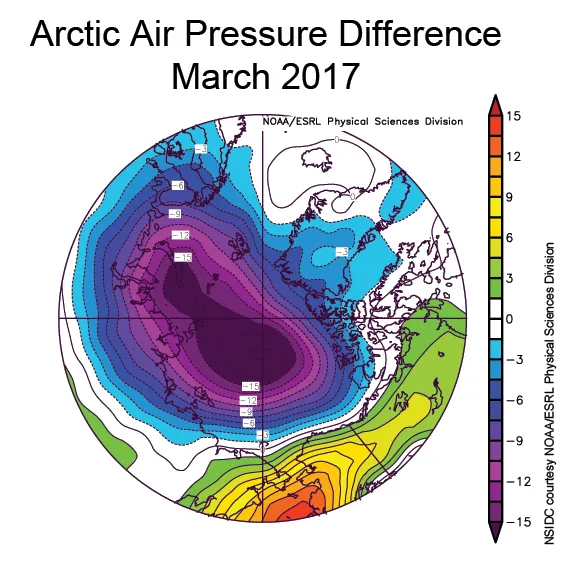
The dominant feature of the sea level pressure field for March 2017 was an area of below average pressure covering most of the Arctic Ocean. Locally, pressures were more than 15 millibars below the 1981 to 2010 average. This pattern points to a continuation of the stormy conditions that prevailed over the past winter and is broadly consistent with the positive phase of the Arctic Oscillation, a large-scale mode of climate variability. When the Arctic Oscillation is in its positive phase, sea level pressure is below average over the Arctic Ocean. The Arctic Oscillation has generally been in a positive phase since December. The unusually high Siberian temperatures for March 2017 are consistent with persistent winds from the south and east along the southern side of the low pressure.
March 2017 compared to previous years
The linear rate of decline for March is 42,700 square kilometers (16,500 square miles) per year, or 2.74 percent per decade.
Report from the field
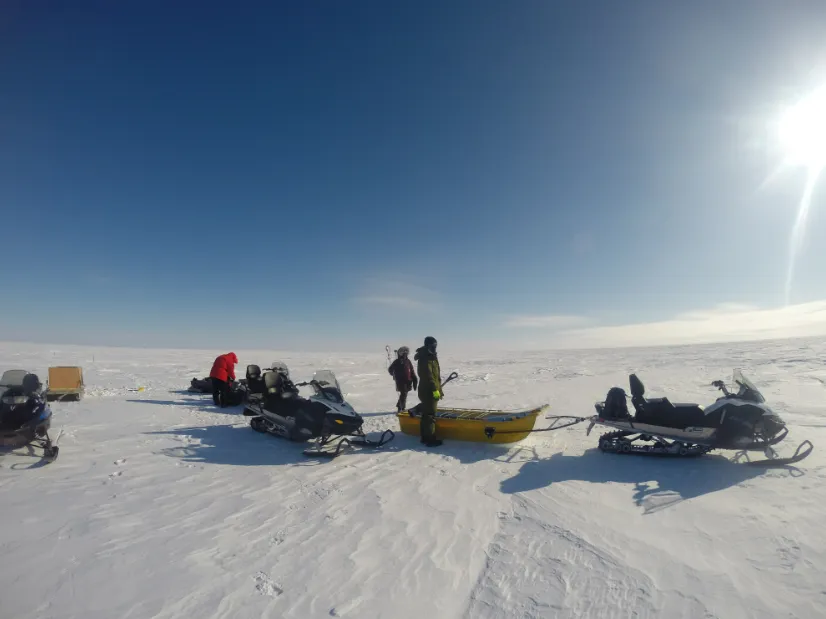
As of the publication of this post, NSIDC scientists Julienne Stroeve and Andrew Barrett are in Cambridge Bay, Canada on a satellite validation campaign. Efforts focus on ground measurements of snow depth over sea ice, ice thickness, and snow structure in order to validate the joint French/Indian AltiKa Ka band radar altimeter. Coincident aircraft Ka band and LiDAR measurements allow researchers to connect measurements on the ground with those made by the satellite. Air temperatures have ranged from -20 to -5 degrees Celsius (-4 to 23 degrees Fahrenheit), with wind chills from -40 to -20 degrees Celsius (-40 to -4 degrees Fahrenheit). Dr. Stroeve will then join another field campaign operating out of Alert, Canada for further validation of AltiKa and CryoSat2 over the Lincoln Sea.
Arctic sea ice thickness
A key early indicator for the upcoming melt season is the thickness of the sea ice. An assessment of available information suggests a fairly thin ice cover, not surprising given the warm temperatures over much of the Arctic Ocean during the winter.
Satellite data from the European Space Agency (ESA) CryoSat-2 radar altimeter, which is processed into sea ice thickness estimates at the University College London’s Center for Polar Observing and Modeling (CPOM) indicates ice along much of the Siberian coast with thicknesses of 1.5 to 2.0 meters (4.9 to 6.6 feet) or less. This is not atypical for seasonal ice; however this band of <2.0 meters of ice covers a much larger region and extends much farther north than it used to—well north of 80 degrees N latitude on the Atlantic side of the Arctic. NASA’s Operation IceBridge has also been collecting data over the past month. That data will not be available for a few weeks; a key focus of some flights has involved collaboration with ESA to collect coincident data with CryoSat-2 to help validate the satellite estimates.
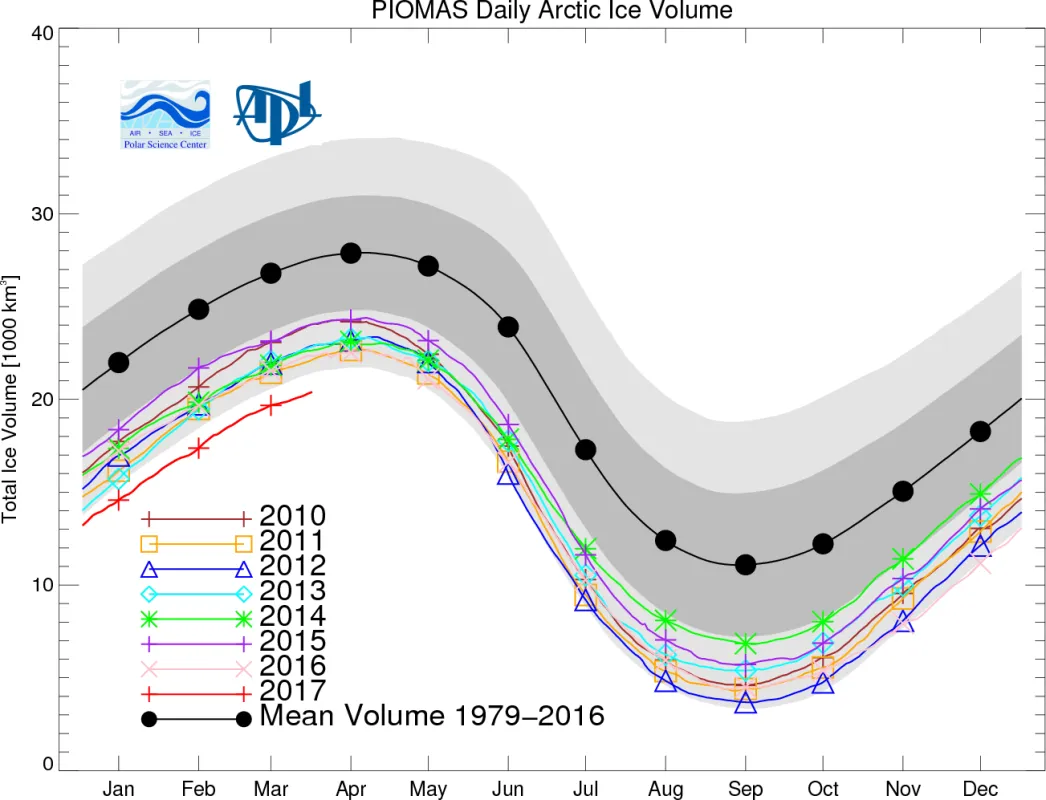
Another way to estimate thickness and total ice volume is with a combination of observations and a model, which is done by the University of Washington Polar Science Center’s University of Washington Polar Science Center’s Pan-Arctic Ice Ocean Modeling and Assimilation System (PIOMAS). The model uses observed sea ice concentration fields to constrain the model and estimates thickness and total volume via physical simulations in the model. It shows that sea ice volume has been at record low levels throughout 2017 so far (Figure 5).
Sea ice loss and Atlantic layer heat
For many years, scientists have pondered how much of the sharp decline in summer sea ice extent and volume is due to “top down” forcing—a warmer atmosphere leading to more summer melt and less winter growth, versus “bottom up” forcing, in which ocean heat is brought to bear on the underside of the ice. There is a great deal of heat in the Arctic Ocean from waters that are imported from the Atlantic. As fairly warm and salty Atlantic water enters the Arctic Ocean it dives underneath the relatively fresh Arctic Ocean surface layer. Because the fresh surface layer has a fairly low density, the vertical structure of the Arctic Ocean is very stable. As such, it is hard to mix this Atlantic heat upwards to melt ice or keep it from forming in the first place. However, new work by an international team led by Igor Polyakov of the University of Alaska Fairbanks provides strong evidence that Atlantic layer heat is now playing a prominent role in reducing winter ice formation in the Eurasian Basin, which is manifested as more summer ice loss. According to their analysis, the ice loss due to the influence of Atlantic layer heat is comparable in magnitude to the top down forcing by the atmosphere.
Antarctic ice extent low, but on the rise
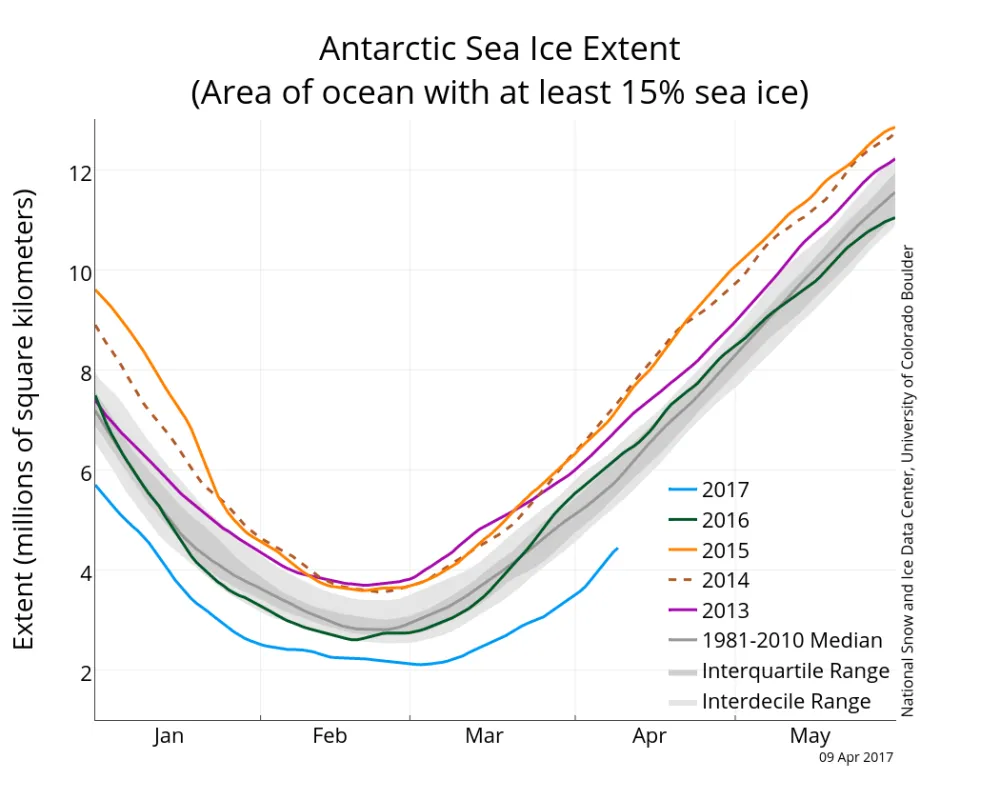
Following the record-low seasonal sea ice minimum, Antarctic sea ice extent has sharply risen, but extent is still far below average, and set daily record low values throughout the month of March. Regionally, sea ice recovered to near average conditions in the Weddell Sea and around much of the coast of East Antarctica. The primary region of below average extent was in the Ross, Amundsen, and Bellingshausen Sea regions, as has been the case throughout the spring and summer. This appears to be related to warmer-than-average sea surface temperatures.
Additional reading
Polyakov, I., A.V. Pnyushkov, M.B. Alkire, I.M. Ashik, T.M. Baumann, E.C. Carmack and 10 others. 2017. Greater role for Atlantic inflows on sea-ice loss in the Eurasian Basin of the Arctic Ocean. Science, doi:10.1126/science.aai8204.
