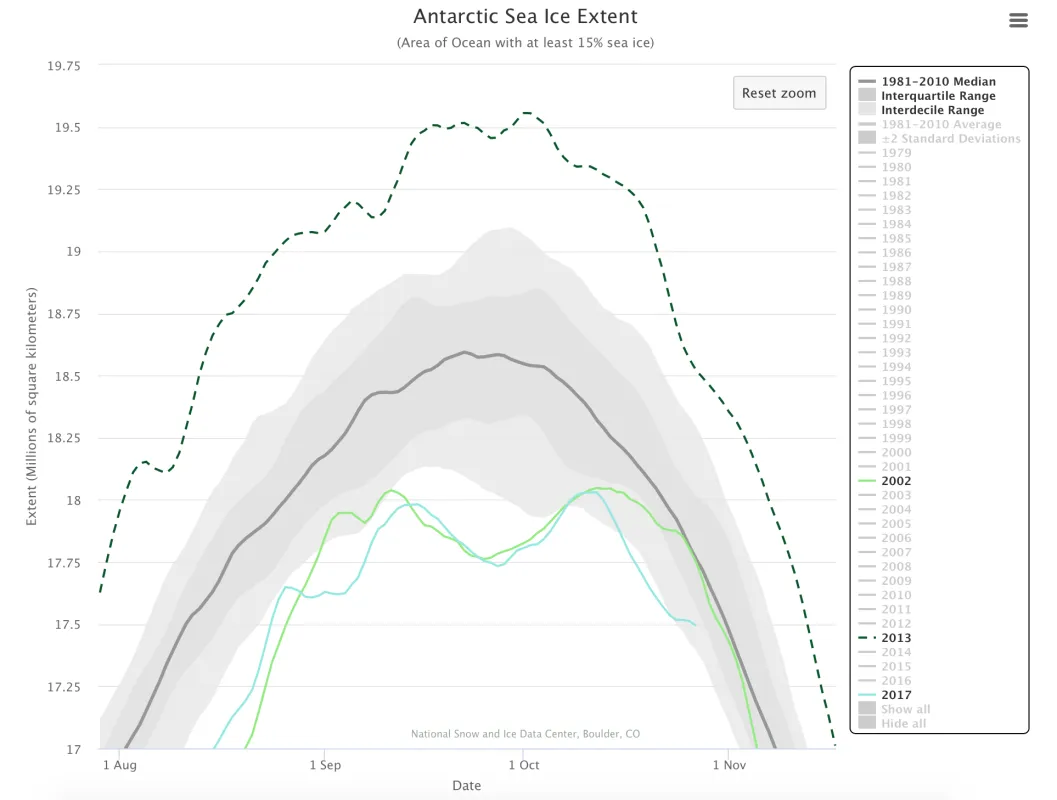
Rapid expansion of the Arctic sea ice cover is the norm for October as solar input dwindles and the remaining heat in the upper ocean is released upwards, warming the lower atmosphere and escaping to space. Because of late season growth, the seasonal Antarctic maximum we previously reported as occurring on September 15 was exceeded, with a new maximum set on October 11 and 12. This is the second-lowest and second-latest seasonal maximum extent in the satellite record.
Overview of conditions
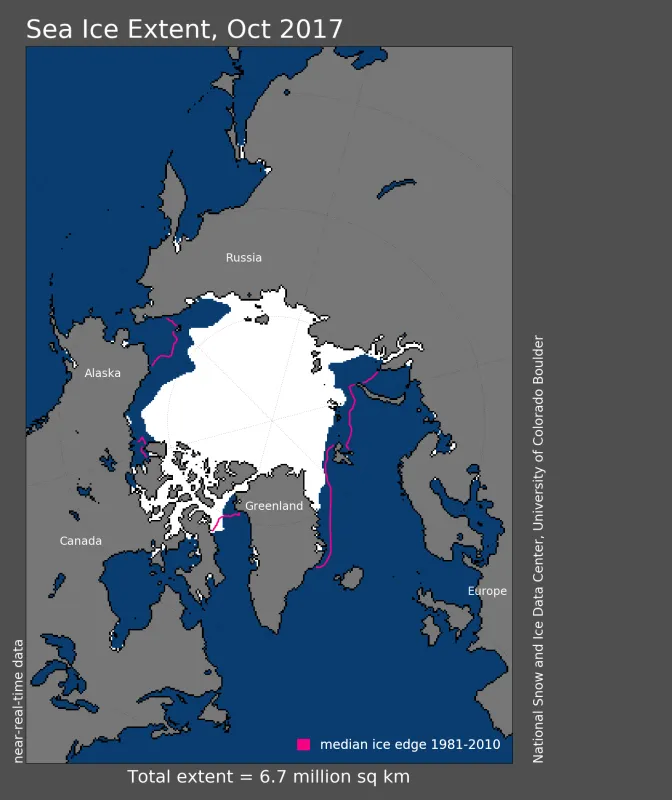
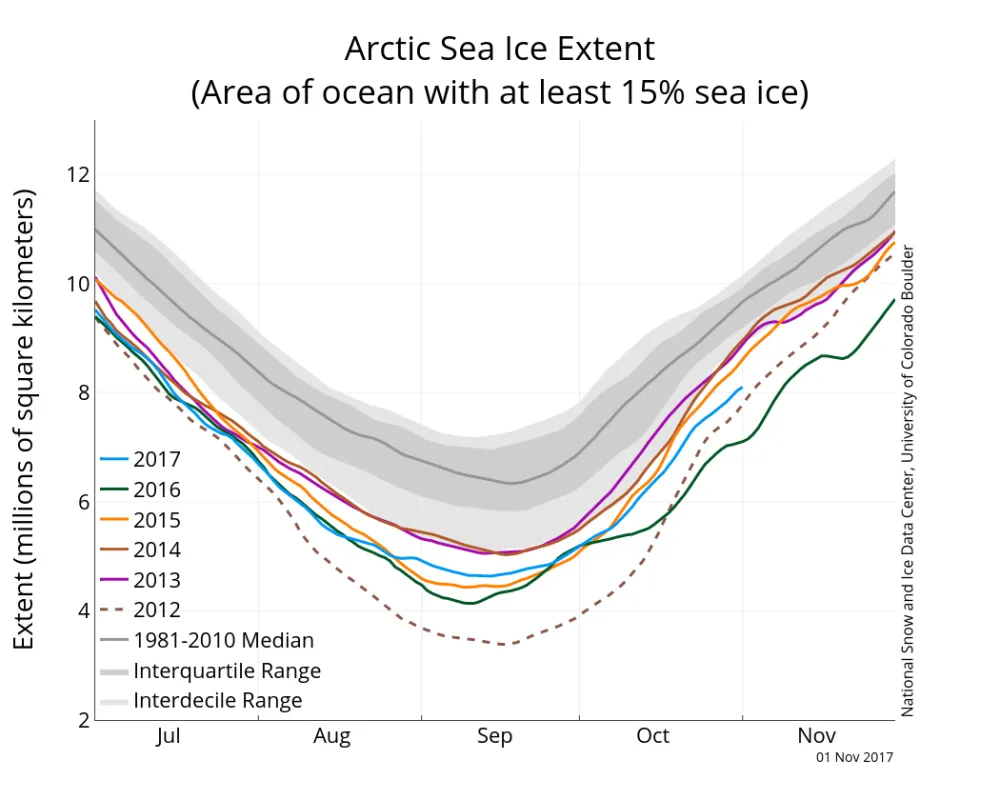
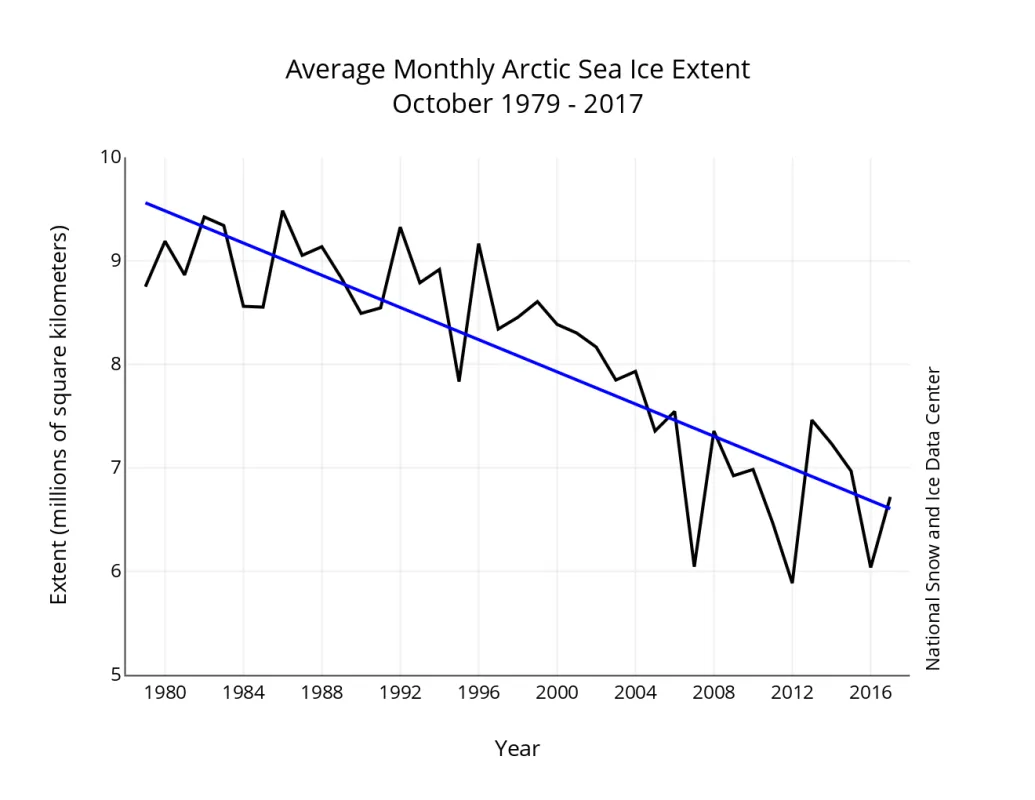
Arctic sea ice extent for October 2017 averaged 6.71 million square kilometers (2.60 million square miles), the fifth lowest in the 1979 to 2017 satellite record. This was 1.64 million square kilometers (633,000 square miles) below the 1981 to 2010 average and 820,000 square kilometers (317,000 square miles) above the record low October extent recorded in 2012. By the end of October, extent remained below average throughout most of the Arctic except within the Laptev Sea, which is fully ice covered. Ice growth over the month was most prominent within the Beaufort, East Siberian, and Laptev Seas and within Baffin Bay. In the Chukchi, Kara, and Barents Seas, the rate of ice growth was slower. Ice extent also remains far below average in the East Greenland Sea.
Conditions in context
Ice growth during October 2017 averaged 94,200 square kilometers (36,000 square miles) per day. This was 5,100 square kilometers (2,000 square miles) per day faster than the average rate of ice growth for the month. Total ice extent for the month remains more than 2 standard deviations below the 1981 to 2010 average.
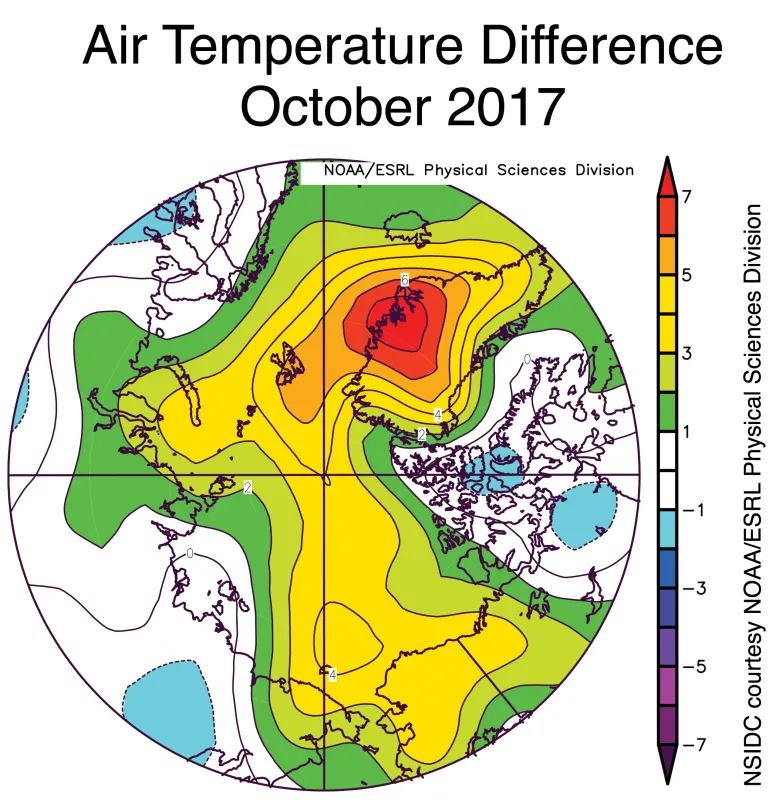
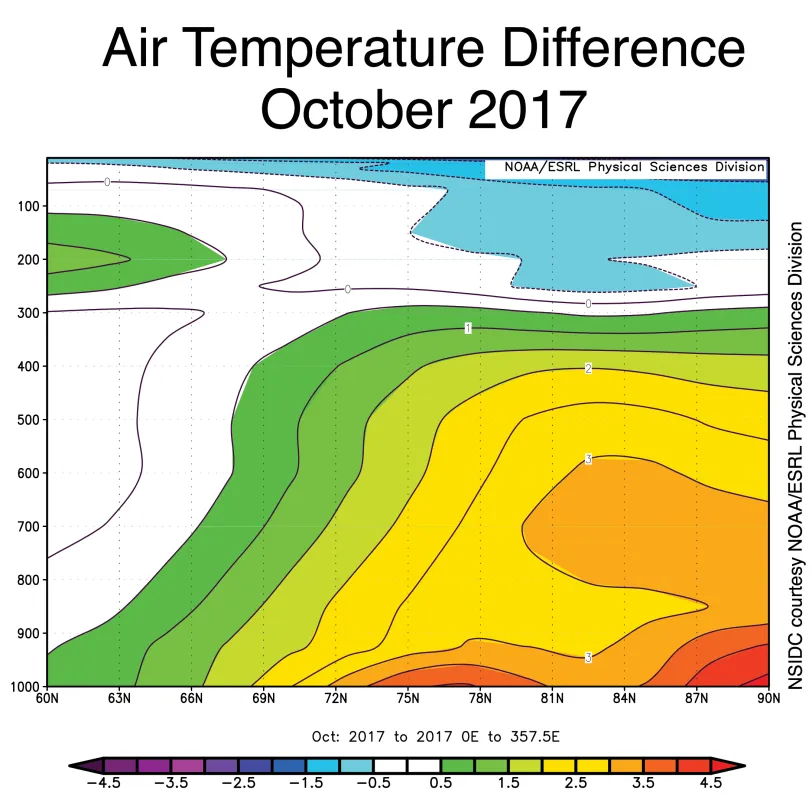
October air temperatures at 925 hPa (about 3,000 feet above sea level) were 2 to 4 degrees Celsius (4 to 7 degrees Fahrenheit) above average over most of the Arctic Ocean and up to 7 degrees Celsius (13 degrees Fahrenheit) above average over the East Greenland Sea. Unusually high temperatures over the East Greenland Sea appear to largely reflect the transport of warm air from Eurasia, driven by the combination of above average sea level pressure over the Kara and Barents Seas, and below average pressure over the North Atlantic and Greenland. Elsewhere, above average near surface air temperatures reflect in part the exchange of heat from the ocean to the atmosphere as the ocean cools and sea ice forms, such as within the Chukchi Sea. A plot of temperatures as a function of both height and latitudes shows that the above average air temperatures for the Arctic as a whole extend up to approximately 9,200 meters (30,000 feet) high in the atmosphere.
October 2017 compared to previous years
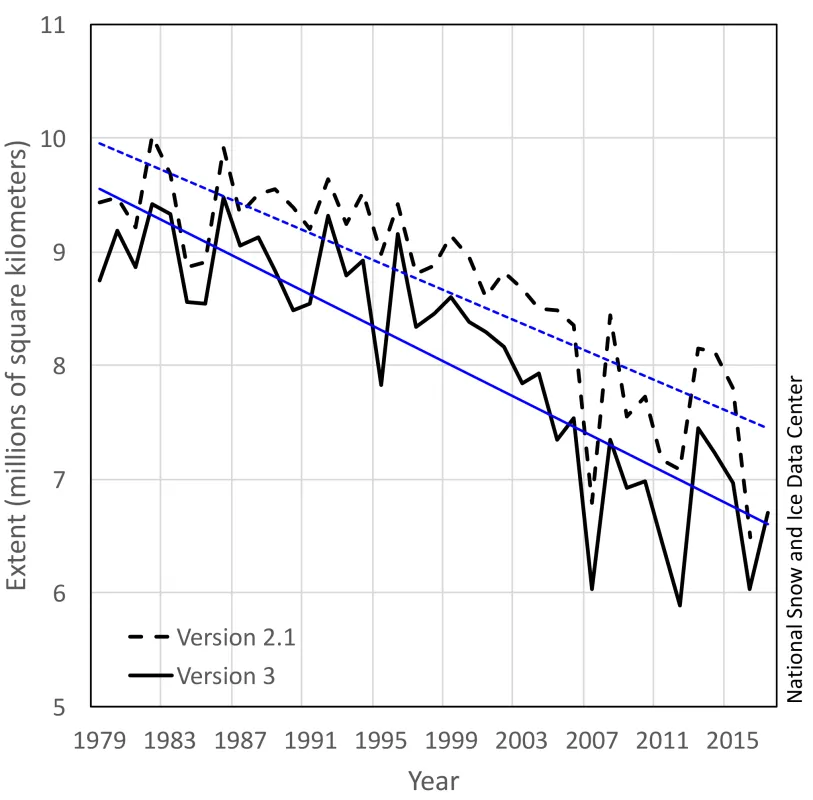
The linear rate of sea ice decline for October is 77,600 square kilometers (30,000 square miles) per year, or 9.3 percent per decade relative to the 1981 to 2010 average. While this appears as an increase in the rate of October ice retreat compared to the trend reported last year, it is not a climate signal but is rather largely a result of using a different averaging method to derive the monthly average sea ice extent values (see below).
Effects of snow salinity on CryoSat-2 ice freeboard estimates
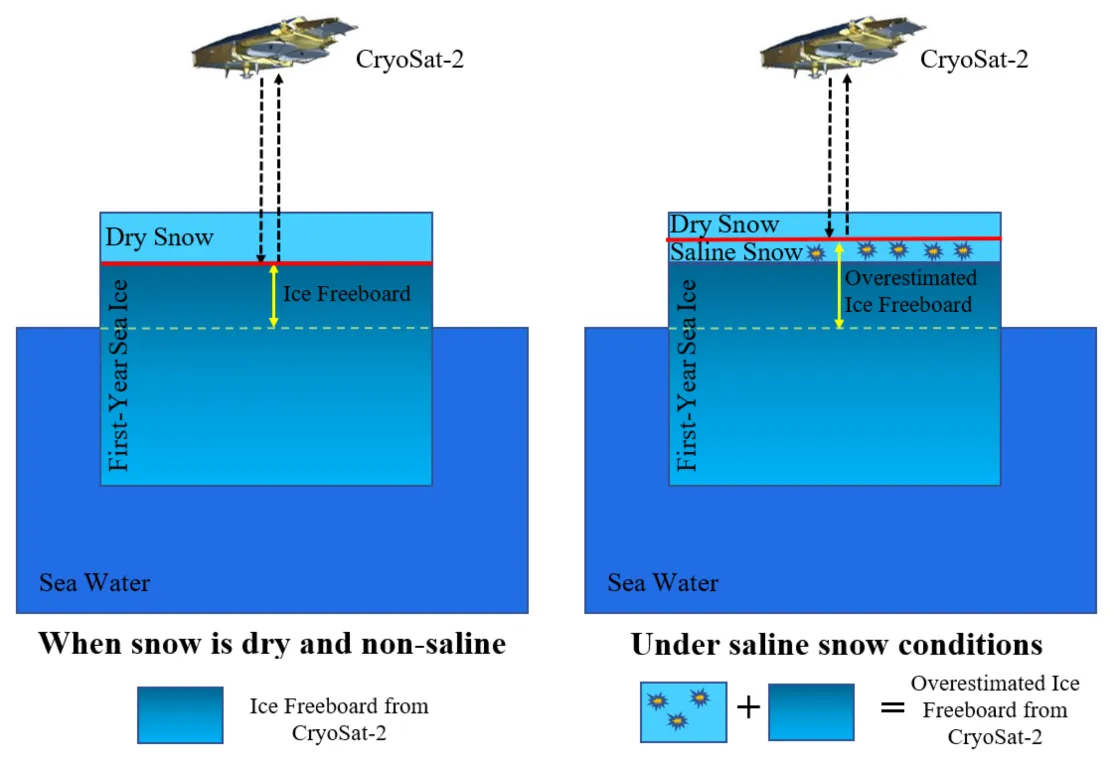
After the end of sea ice melt season, the ocean cools and new sea ice forms. The ice crystals that form expel salt into the water. Some of this salt, or brine, is also expelled upwards to the surface of the ice or into snow that has fallen since the ice formed. The brine is then wicked upwards into the snowpack, leading to a slightly saline snowpack, ranging from 1 to 20 parts per thousand (standard seawater is about 35 parts per thousand). This saline snow is a strong reflector of radar energy.
A recent study led by the Cryosphere Climate Research Group at the University of Calgary investigated the impact of snow salinity on retrieving sea ice thickness from radar altimeters, such as CryoSat-2. The study shows that the snow layers observed over much of the Arctic’s first-year ice are salty enough to reflect the radar pulse from CryoSat-2, a radar altimeter used to measure sea ice thickness and ice sheet elevation. They calculate that a correction factor could compensate for this effect, and improve sea ice thickness measurements. While snow salinity is important, other factors, such as surface roughness and ice density also contribute to uncertainties in ice thickness, and they can potentially cancel each other out. Continued comparisons to observed thickness data is crucial to better quantify these uncertainties.
Antarctica’s double-humped sea ice maximum
In our last post, we noted that Antarctic sea ice may have reached its maximum extent for the year on September 15, at 17.98 million square kilometers (6.94 million square miles). However, after two weeks of decline, extent increased again reaching a second and final maximum of 18.03 million square kilometers (6.96 million square miles) on October 11 and 12. This is tied with 2002 for the latest maximum on record and is the second lowest Antarctic maximum extent in the satellite data record, slightly higher than 1986. Interestingly, 2002 had a similar Bactrian maximum pattern.
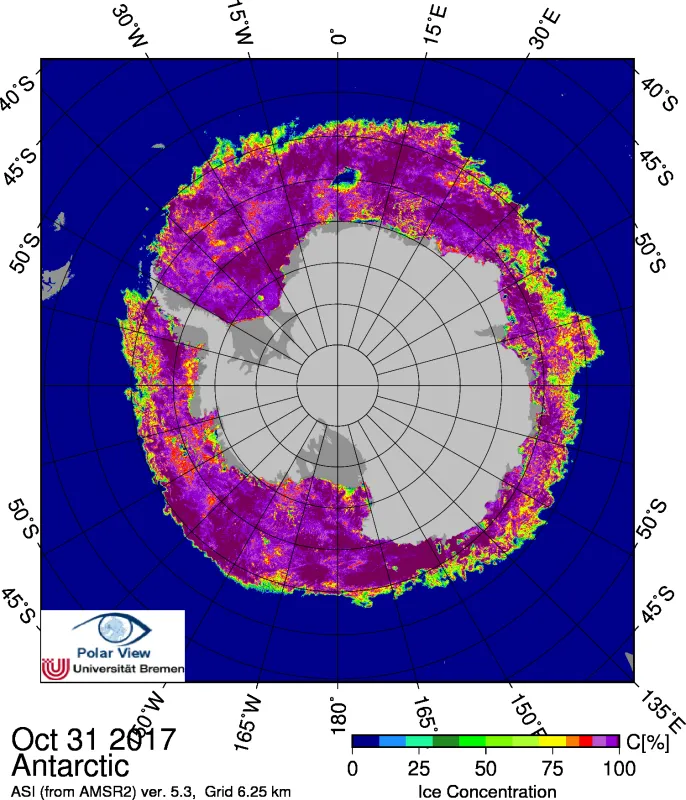
The Maud Rise polynya (or Weddell Sea polynya) continues to be a significant feature of the sea ice cover near 5°E longitude and 65°S. The feature appeared around September 13 and grew to its approximate current extent by September 17. Its current size remains about 30,000 square kilometers (12,000 square miles).
Winds and ocean temperatures continue to drive Antarctic sea ice variability. Since there is no land boundary to the north of the Antarctic continent, sea ice in the Southern Hemisphere is free to expand toward the equator until it reaches water temperatures that are high enough to melt sea ice. As a result, changes in winds or ocean temperatures can have a large influence on the amount of sea ice year to year. Changes in winds related to the positive phase of the Southern Annular Mode (SAM) appear to explain the positive trend in total Antarctic sea ice extent. When the SAM is in a positive phase during austral summer, stronger than average westerly winds blow around the Antarctic continent, and sea ice is pushed both westward and slightly northward due to the Coriolis effect. In addition, below average sea surface temperatures persist through the summer and lead to increased sea ice growth the following autumn, while the negative phase precedes higher sea surface temperatures and reduced sea ice growth. A new study suggests the negative SAM mode during 2016/2017 austral summer largely explained the record minimum Antarctic sea ice extent observed in March 2017.
Revised computation of the monthly mean extent
We have updated the way the monthly average sea ice extent is calculated in the NSIDC Sea Ice Index, the source for our sea ice extent estimates. The monthly average total extent (and area) are now computed as an average of the daily values over the month. Historically, the monthly mean sea ice extent has been calculated based on the monthly mean averaged sea ice concentration field. While there is a rationale for both approaches, the new method is more intuitive and eliminates unusual and unexpected results in months when there is rapid ice growth and retreat. Most of the new monthly mean extents are smaller than the previous values with a mean extent difference between -0.45+0.24 and -0.23+0.16 million square kilometers for the Arctic and Antarctic, respectively. The largest differences for the Arctic occur during the month of October due to the rapid ice growth rates typical at that time of year, with the largest difference of -1.20 million square kilometers in October 2012. Changes in rankings and trends were much smaller because the new method tends to affect all years of a given month in a similar manner. October is also the month with the largest trend difference, increasing in magnitude from -7.4 percent per decade to -9.3 percent per decade. Changes in Arctic trends for other months are much smaller.
Similarly, in the Antarctic, differences in averaging methods results in the largest changes during the month of December when the ice cover is rapidly receding. The largest difference of -1.27 million square kilometers occurs in December 1981. The largest changes in the trends are for January and December with a change in value from +2.7 to +3.5 and +1.2 to +1.9 percent per decade, respectively. For more detailed information on the impacts of the revised averaging methods on trends and rankings, please see NSIDC Special Report 19.
Further reading
Nandan, V., T. Geldsetzer, J. Yackel, M. Mahmud, R. Scharien, S. Howell, J. King, R. Ricker, and B. Else. 2017. Effect of snow salinity on CryoSat-2 Arctic first-year sea ice freeboard measurements: Sea ice brine-snow effect on CryoSat-2. Geophysical Research Letters. doi:10.1002/2017GL074506.
Doddridge, E. W. and J. Marshall. 2017. Modulation of the seasonal cycle of Antarctic sea ice extent related to the Southern Annular Mode. Geophysical Research Letters, 44, 9761–9768. doi: 10.1002/2017GL074319.
Windnagel, A., M. Brandt, F. Fetterer, and W. Meier. 2017. Sea Ice Index Version 3 Analysis. NSIDC Special Report 19.
