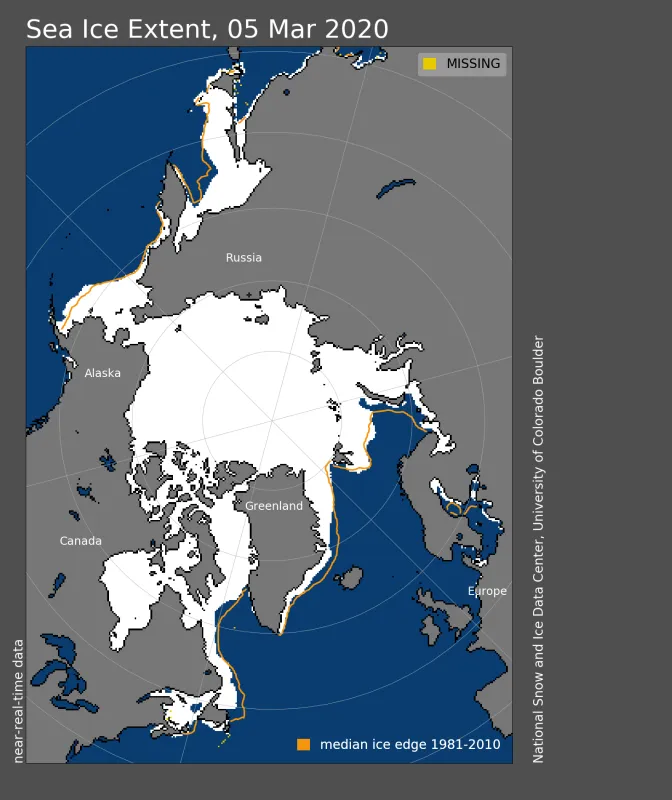
Arctic sea ice appears to have reached its annual maximum extent on March 5. The 2020 maximum sea ice extent is the eleventh lowest in the 42-year satellite record, but the highest since 2013. The Antarctic minimum sea ice extent, which was noted in the previous post, was indeed reached on February 22. NSIDC will present a detailed analysis of the 2019 to 2020 winter sea ice conditions in our regular monthly post in early April.
Overview of conditions
On March 5, 2020, Arctic sea ice likely reached its maximum extent for the year, at 15.05 million square kilometers (5.81 million square miles), the eleventh lowest in the 42-year satellite record. This year’s maximum extent is 590,000 square kilometers (228,000 square miles) below the 1981 to 2010 average maximum of 15.64 million square kilometers (6.04 million square miles) and 640,000 square kilometers (247,000 square miles) above the lowest maximum of 14.41 million square kilometers (5.56 million square miles) set on March 7, 2017. Prior to 2020, the four lowest maximum extents occurred from 2015 to 2018.
The date of the maximum this year, March 5, was seven days before the 1981 to 2010 median date of March 12.
Table 1. Ten lowest maximum Arctic sea ice extents (satellite record, 1979 to present)
| Rank | Year | In millions of square kilometers | In millions of square miles | Date |
|---|---|---|---|---|
| 1 | 2017 | 14.41 | 5.56 | March 7 |
| 2 | 2018 | 14.47 | 5.59 | March 17 |
| 3 | 2016 2015 | 14.51 14.52 | 5.60 5.61 | March 23 February 25 |
| 5 | 2011 2006 | 14.67 14.68 | 5.66 5.67 | March 9 March 12 |
| 7 | 2007 2019 | 14.77 14.78 | 5.70 5.71 | March 12 March 13 |
| 9 | 2005 2014 | 14.95 14.96 | 5.77 5.78 | March 12 March 21 |
For the Arctic maximum, which typically occurs in March, the uncertainty range is ~34,000 square kilometers (13,000 square miles), meaning that extents within this range must be considered effectively equal.
Maximum extent is not predictive of minimum extent
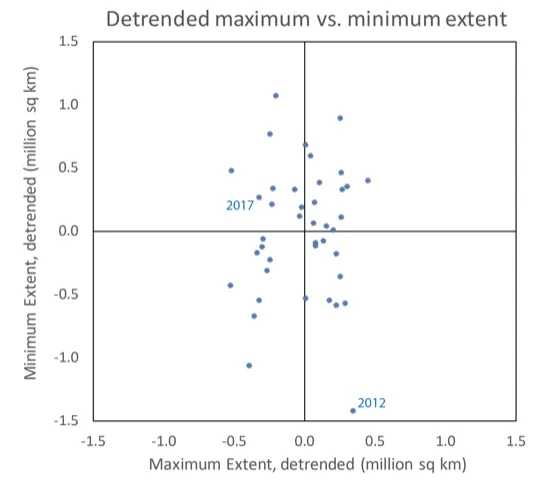
Often there is a debate as to whether the maximum extent in March is predictive of the minimum extent in September. Both have statistically significant downward trends, so it is expected that both will tend to have low extents relative to the long-term averages. However, the specific maximum extent in any given year does not correlate to the minimum extent. When the trend is removed from both time series or de-trended, there is essentially no relation between the two, showing the year-to-year variability in extent. Plotting the de-trended maximum versus minimum extent (Figure 2) shows a near-random distribution. In other words, a relatively high maximum is not necessarily followed by a relatively high minimum. One example is 2012, where the maximum extent ranked only eighth lowest in 2012, and now sixteenth lowest in 2020, but the minimum was a record low for the satellite record. Similarly, 2017 has the lowest maximum in the satellite record, but the minimum ranked only seventh lowest at the time, and now is at the tenth lowest maximum extent. The reason why the seasonal maximum extent and the September minimum extent are not correlated is largely because summer weather conditions strongly shape the September minimum.
Final analysis pending
Please note this is a preliminary announcement of the sea ice maximum. At the beginning of April, NSIDC scientists will release a full analysis of winter conditions in the Arctic, along with monthly data for March.

