While the first half of August saw a rapid pace of Arctic sea ice loss, the pace slowed during the latter half of the month as mostly cooler conditions set in. Antarctic sea ice extent increased during the second half of the month.
Overview of conditions
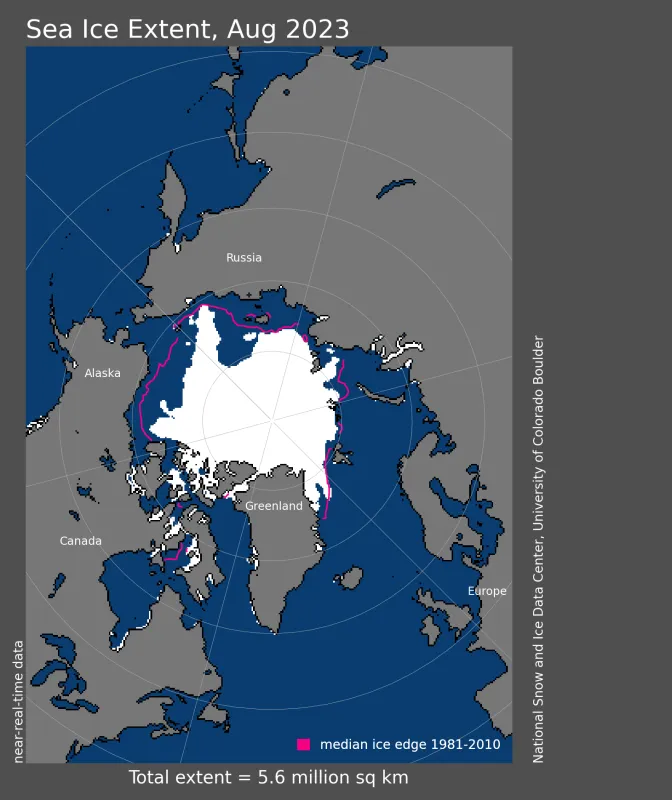
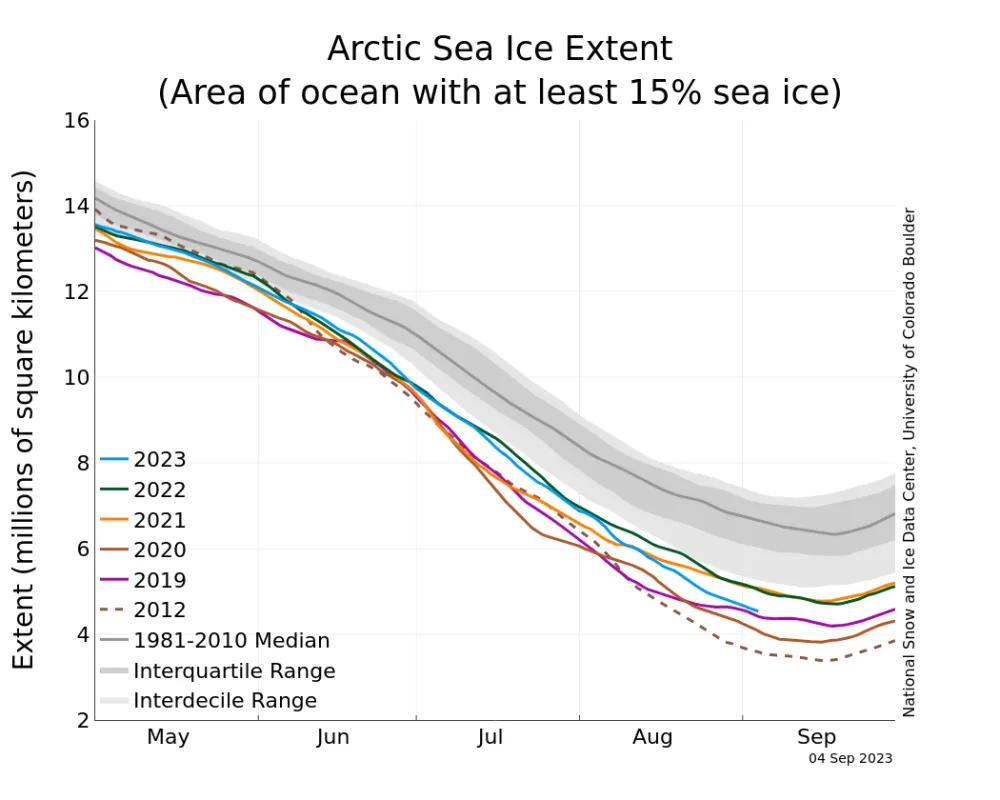
August Arctic sea ice extent averaged 5.57 million square kilometers (2.15 million square miles), or the eighth lowest in the 45-year satellite record (Figure 1a). Extent was 1.63 million square kilometers (629,000 square miles) below the 1981 to 2010 reference period and 850,000 square kilometers (328,000 square miles) above the previous record low for the month set in 2012. As of the end of August, 2.24 million square kilometers (860,000 square miles) of sea ice was lost in the Arctic.
As is typical during the latter half of August, the pace of ice loss slowed (Figure 1b). Nevertheless, the daily ice loss rate of 72,100 square kilometers (27,800 square miles) per day was faster than the 1981 to 2010 average of 57,200 square kilometers (22,100 square miles) per day.
At month’s end, the ice edge remained considerably farther north than average in the Beaufort, Chukchi and East Siberian Seas, while in the Kara and Barents Seas the ice edge was near its typical location, albeit farther north in a few scattered regions. In the East Greenland Sea the ice was also well north of its usual position, in large part because of reduced ice export out of Fram Strait. While the ice edge in the Laptev Sea was near average, large areas of low ice concentration and open water were present.
The southern Northwest Passage, known as Amundsen’s route, remains nearly ice free, and the northern deepwater route between M’Clure Strait and Lancaster Sound has less ice than the previous record low for this time of year set in 2011. However, some ice still clogs M’Clure Strait and ice in the Beaufort Sea hinders easy access.
Conditions in context
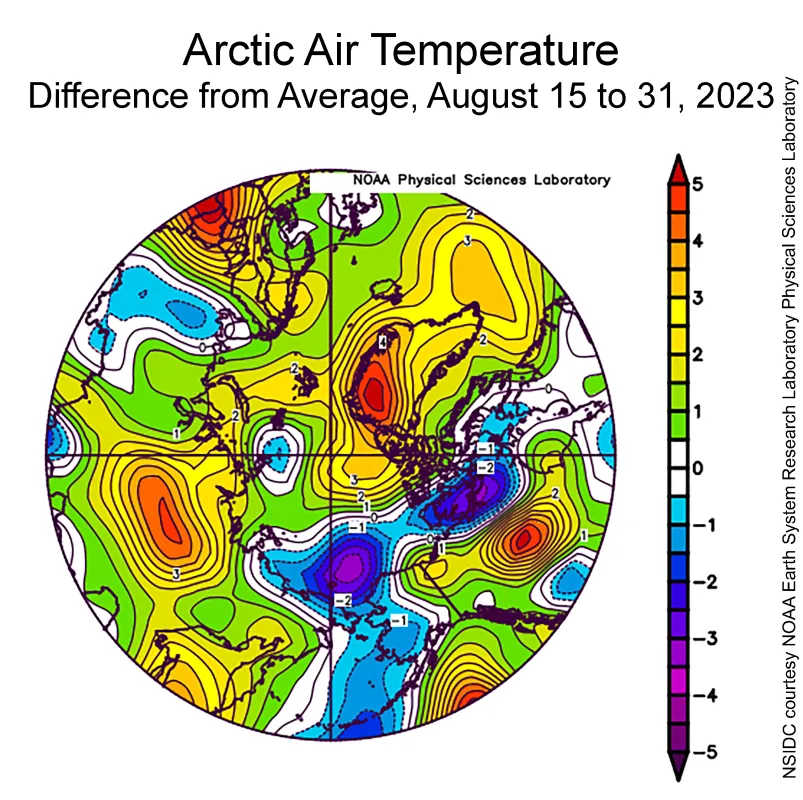
During the second half of August, air temperatures at the 925 millibar level (about 2,500 feet above the surface) averaged 1 to 5 degrees Celsius (2 to 9 degrees Fahrenheit) below average in the Chukchi and East Siberian Seas, whereas above-average air temperatures prevailed in northern Greenland at 1 to 6 degrees Celsius (2 to 11 degrees Fahrenheit) (Figure 2a). Patches of warm conditions persisted in the Kara and Barents Seas of 1 to 3 degrees Celsius (2 to 5 degrees Fahrenheit) above average, though cool conditions were nearby. This contrasts with the pattern observed in the first half of the month when temperatures were below average north of Greenland, above average in the Chukchi and East Siberian Seas, and considerably above average in the Kara and Barents Seas.
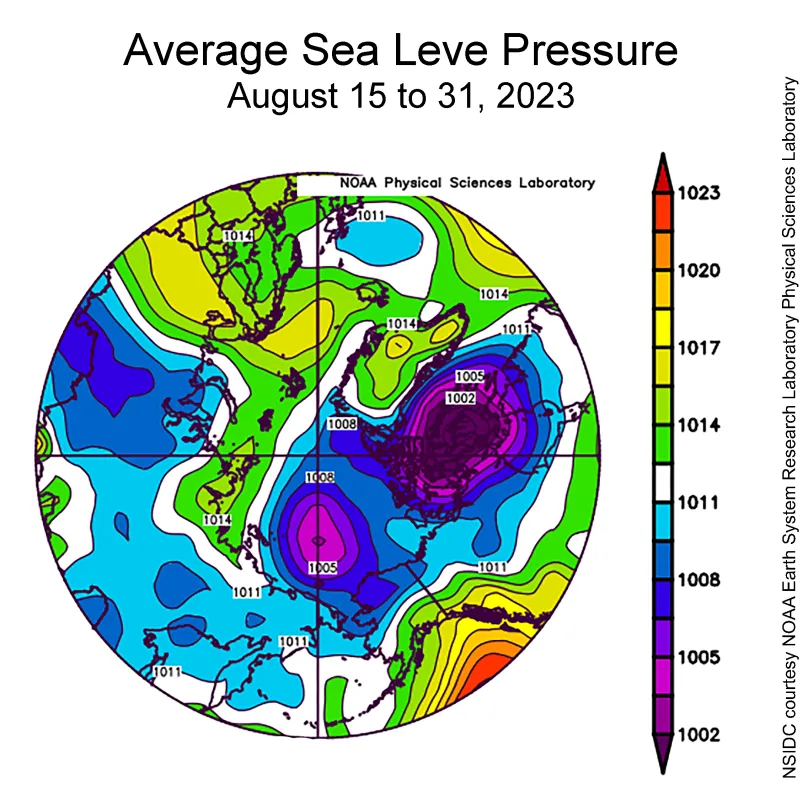
Conditions shifted with the development of prominent areas of low sea level pressure over northern Canada and the Central Arctic Ocean; the latter feature is typical for this time of year (Figure 2b). By contrast, high pressure lingered over Greenland, the Norwegian Sea, and extended eastward along the Russian coast into the Laptev Sea. The high pressure over the Norwegian Sea and the implied winds from the south helped to transport warm air northward and also inhibited ice transport out of Fram Strait. Low pressure over the central Arctic Ocean helped to transport cold air southwards, contributing to the cool conditions over the Chukchi Sea.
August 2023 compared to previous years
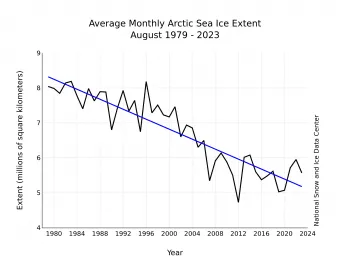
The downward linear trend in Arctic sea ice extent in August over the 45-year satellite record is 71,400 square kilometers (27,600 square miles) per year, or 9.9 percent per decade relative to the 1981 to 2010 average (Figure 3). Based on the linear trend, since 1979, August has lost 3.14 million square kilometers (1.21 million square miles) of ice. This is roughly equivalent to twice size of state of Alaska or the country of Iran.
Cascading impacts of changing sea ice conditions on marine ecosystems
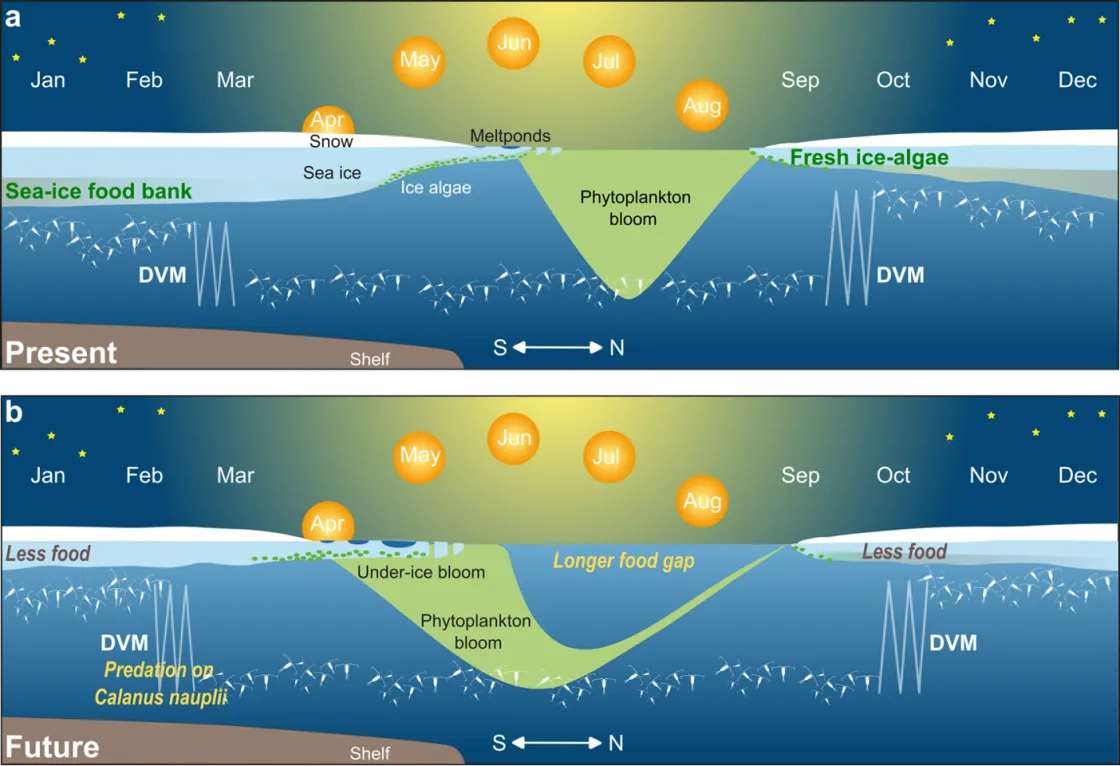
The largest biomass migration on Earth each day happens within our oceans. Zooplankton, including tiny copepods and krill, migrate during the night towards the ocean surface to feed and then retreat to deeper depths during daylight to avoid predation. In the Arctic, however, the alternation of winter’s polar night and summer’s polar day results in a seasonal migration pattern. During the polar day, zooplankton primarily feed on phytoplankton blooms but during the polar night, they travel to the underside of the ice to feed on ice algae. As sea ice shrinks and thins, more light enters the ocean and shifts the seasonal migration. According to researchers at the Alfred Wegener Institute (AWI) and National Snow and Ice Data Center (NSIDC) scientist Julienne Stroeve, zooplankton prefer to stay at depths where light levels are below a certain intensity. Using mooring data deployed at the end of the year-long Multidisciplinary drifting Observatory for the Study of Arctic Climate (MOSAiC) expedition, they quantify this critical light threshold. Using this threshold in climate model simulations, they conclude that as sea ice continues to thin, the ocean level at which this critical light threshold is reached deepens earlier in the year, resulting in zooplankton remaining at depth for longer before coming to the surface to feed on sea ice algae. Currently, the zooplankton begin their springtime downward migration after nauplius larvae of the copepod C. hyperboreus have migrated to the surface and developed to copepodites. As the ice cover reduces, this springtime migration will start earlier. This will change their feeding habits, perhaps feeding on the C. hyperboreus nauplii before they have fully developed. Changing light levels will also shift the biomass and seasonality of ice algae and phytoplankton, the food sources for zooplankton. Since zooplankton feed the fish that feed the seals and whales, this change can cascade through the marine ecosystem.
Northwest Passage
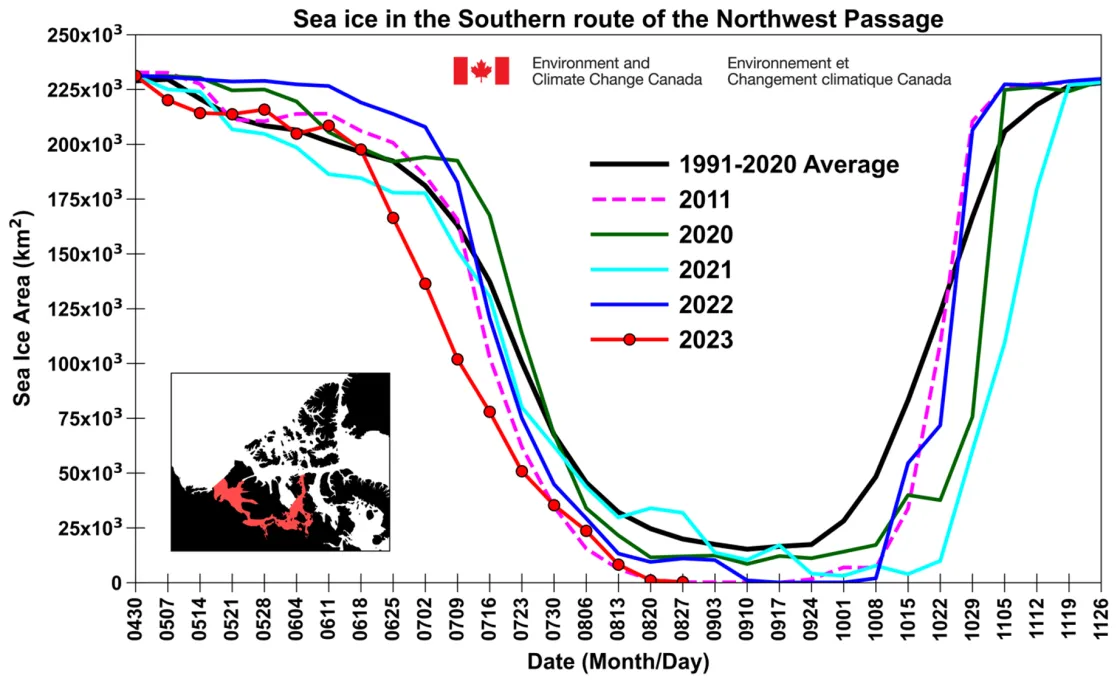
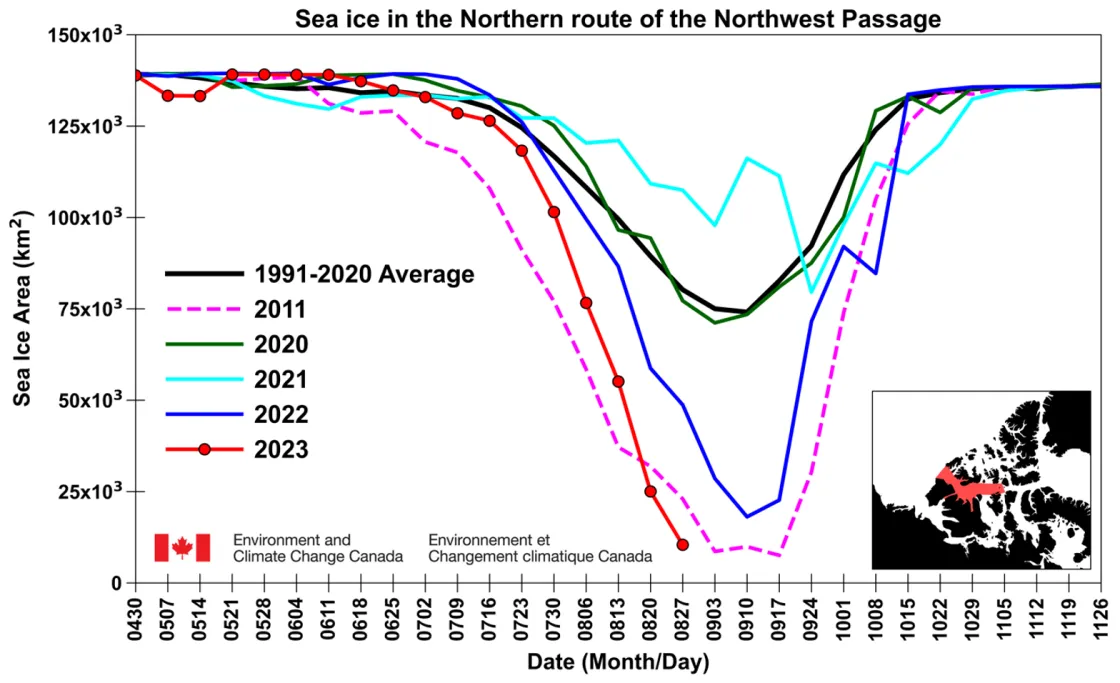
As of August 28, the southern route of the Northwest Passage, known as Amundsen’s route, is almost completely free of sea ice (Figure 5a). The sea ice area in the northern route (deep water) is currently tracking just above 2011 record low conditions (Figure 5b). The route is almost sea ice free with the exception of the vicinity of the western end of M’Clure Strait. Although ice conditions have been very light this year as well as in 2022, it is important to note that ice conditions can be highly variable. While light ice years in the Northwest Passage may occur more frequently as the Arctic continues to warm, the processes of sea ice transport and the aging of seasonal first year ice that lead to heavy ice years in the Northwest Passage, such as in 2021 and 2020, still continue to operate.
Floe-ing with the landscape
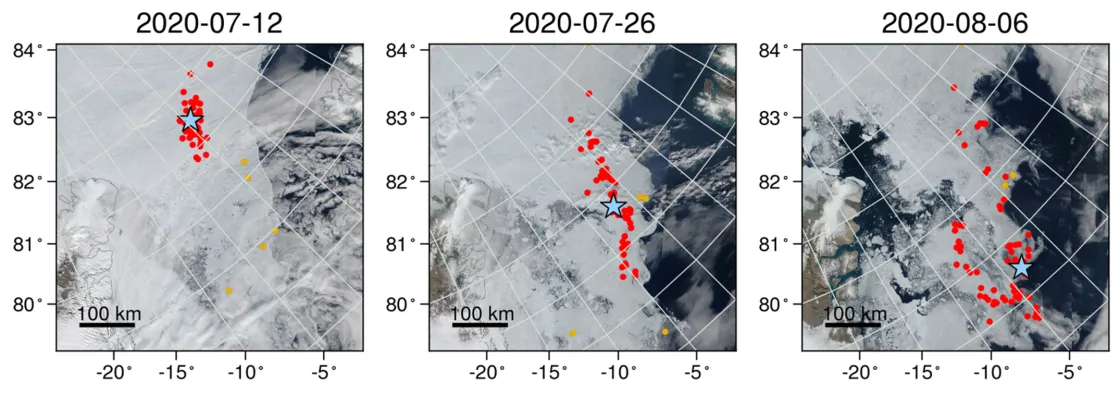
A recent paper led by colleagues at Brown University highlights the tight coupling between sea ice and ocean dynamics in the Fram Strait region. Fram Strait—the passage between Greenland and the Svalbard archipelago—is the key deepwater connection between the Arctic and Atlantic Oceans. It is also the primary region where sea ice is exported from the Arctic Ocean into the Atlantic. Figure 6 shows an ensemble of drifting buoys that were deployed as part of the international Multidisciplinary drifting Observatory for the Study of Arctic Climate (MOSAiC) expedition in Fall 2019 in the Laptev Sea. The buoys were carried westward by the Transpolar Drift Stream, and then flushed through Fram Strait and into the East Greenland Sea during spring and summer 2020. The authors documented clear changes in sea ice dynamics as the buoys crossed over undersea features, such as the Yermak Plateau north of Svalbard and the East Greenland Continental Shelf. These changes are concentrated at frequencies corresponding to tides and inertial oscillations, which show how the seafloor topography influences sea ice. The importance of ocean currents for the sea ice drift was further shown using a new ice tracking algorithm called Ice Floe Tracker. The team showed an increased role for ocean forcing relative to wind forcing on marginal ice zone sea ice in shallow seas and near the edge of the continental shelf.
Antarctic growth accelerates
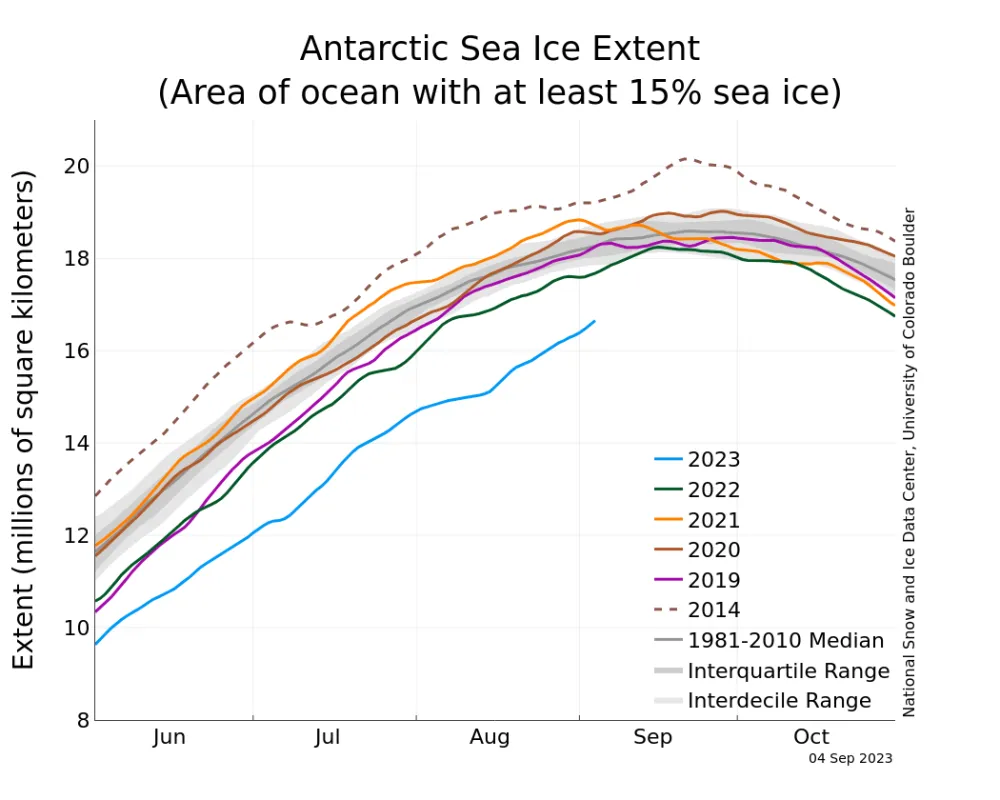
After a brief period of slow growth during the first half of August, ice growth quickened in the Southern Hemisphere. While the total Antarctic sea ice extent is still tracking at record low levels, the ice extent has increased more than average in the Bellingshausen and Amundsen Seas as well as in the Pacific Ocean. Elsewhere the ice edge remains further poleward than average.
References
Flores, H., G. Veyssière, G. Castellani, et al. 2023. Sea-ice decline could keep zooplankton deeper for longer. Nature Climate Change, doi:10.1038/s41558-023-01779-1
Howell, S. E. L., D. G. Babb, J. C. Landy, and M. Brady. 2022. Multi-year sea ice conditions in the Northwest Passage: 1968-2020. Atmosphere-Ocean, 1, 15, doi:10.1080/07055900.2022.2136061
Howell, S. E. L., D. G. Babb, J. C. Landy, G. W. K. Moore, B. Montpetit, and M. Brady. 2023. A comparison of Arctic Ocean sea ice export between Nares Strait and the Canadian Arctic Archipelago. Journal of Geophysical Research: Oceans, 128, e2023JC019687, doi:10.1029/2023JC019687
Watkins, D. M., A. C. Bliss, J. K. Hutchings, and M. M. Wilhelmus. 2023. Evidence of abrupt transitions between sea ice dynamical regimes in the East Greenland marginal ice zone. Geophysical Research Letters, 50, e2023GL103558, doi:10.1029/2023GL103558
