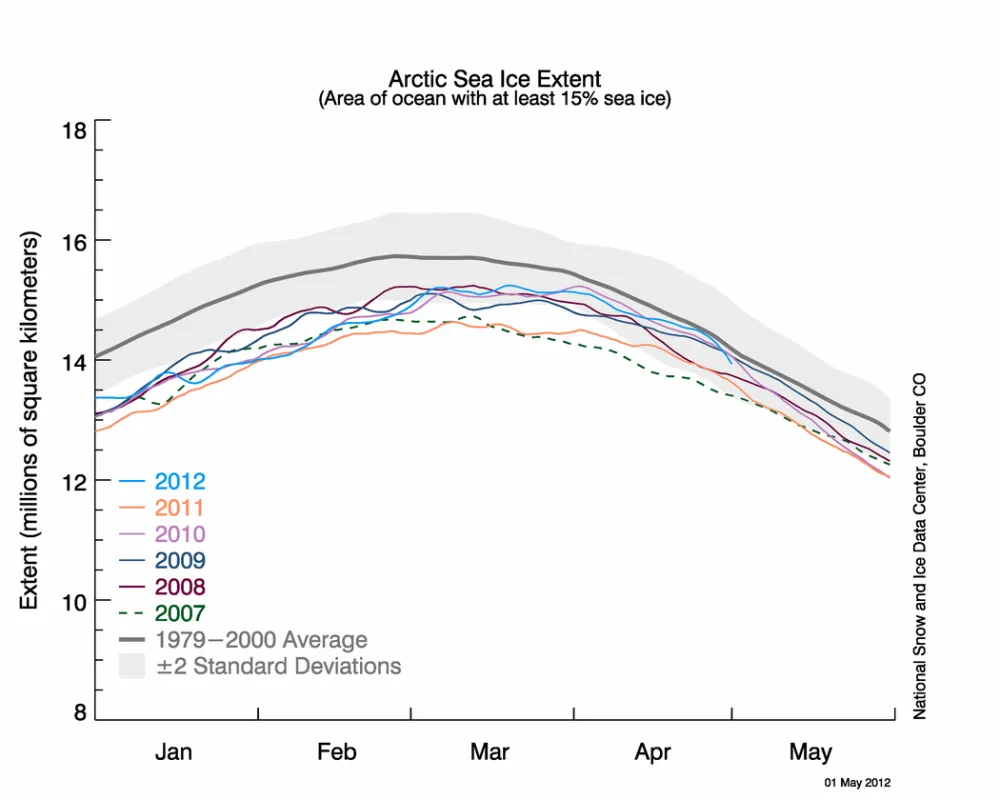
Arctic sea ice extent declined slowly through the first three weeks of April, compared to recent years. The slow decline through March and the first few weeks of April meant that by mid-April, ice extent was at near-average levels. However, much of the extensive ice cover is thin ice that will melt quickly once temperatures rise in the Arctic. Over the past week, extent has started to fall sharply.
Overview of Conditions
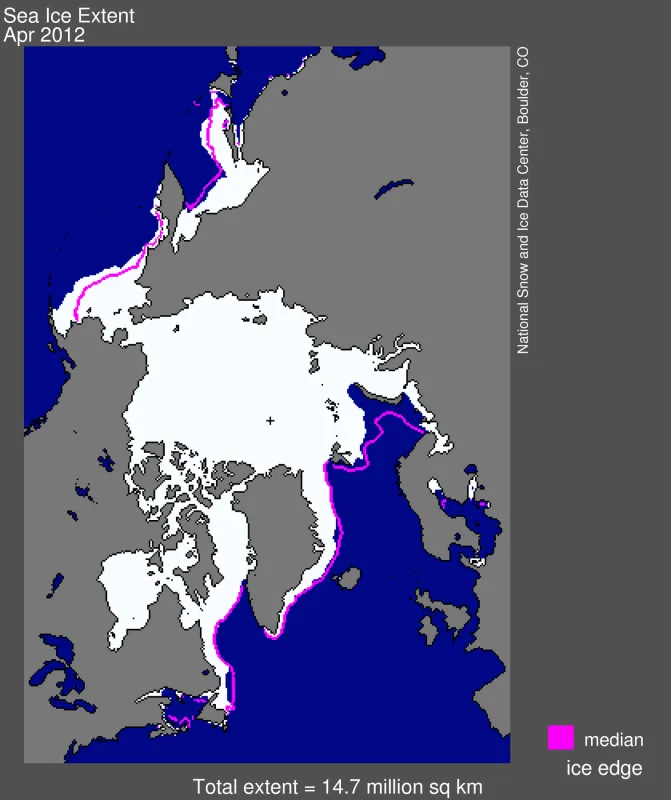
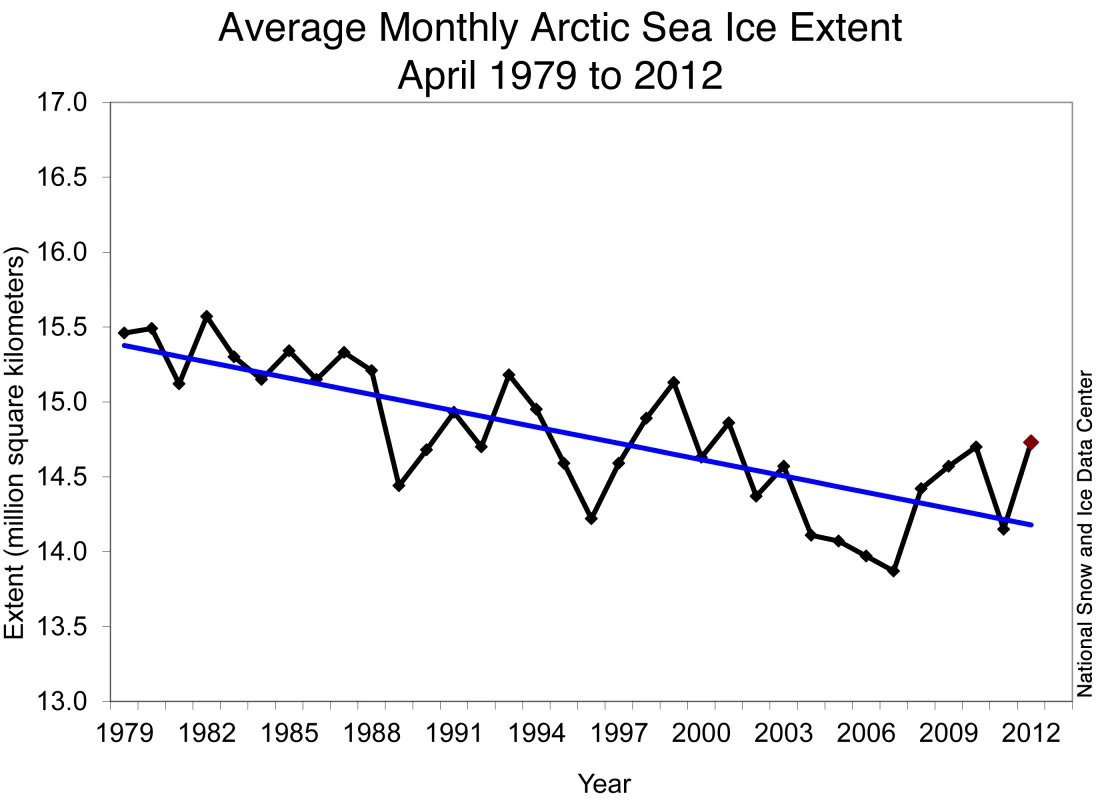
Arctic sea ice extent in April 2012 averaged 14.73 million square kilometers (5.69 million square miles). Because of the very slow rate of ice loss through the last half of March and the first three weeks of April, ice extent averaged for April ranked close to average out of 34 years of satellite data. It was the highest average ice extent for the month since 2001, only 270,000 square kilometers (104,000 square miles) below the 1979 to 2000 average extent. April ice extent was 860,000 square kilometers (330,000 square miles) above the record low for the month, which happened in 2007.
In April, ice cover remained unusually extensive in the Bering Sea, continuing a pattern that persisted over the winter. Ice extent was also slightly higher than average in Baffin Bay and part of the Sea of Okhotsk. As in recent winters, ice extent was well below normal in the Barents Sea, compensating for the extensive ice in the Bering Sea.
As discussed in previous posts, the high Bering Sea ice extent this winter stemmed from unusually low air temperatures and persistent winds that helped to push ice southwards. During April, atmospheric conditions changed, warming the air to near-average temperatures for this time of year and slowing the strong southerly winds.
During April, air temperatures over most of the Arctic were higher than usual, particularly over the central Arctic Ocean. Over the Bering Sea and parts of the East Greenland and Norwegian seas, temperatures ranged from average to slightly below average.
Conditions in context
Overall, the Arctic lost 1.07 million square kilometers (413,000 square miles) of ice during April, somewhat less than the 1979 to 2000 average April loss of 1.21 million square kilometers (467,000 square miles). The average daily rate of ice loss was 35,600 square kilometers (13,700 square miles) per day. On April 24, ice extent was only 118,000 square kilometers (45,6000 square miles) below the 1979 to 2000 average for that day, although the difference has increased since then.
While ice conditions approached the 1979 to 2000 average levels for this time of year, the high ice extent will have little influence on how much ice melts this summer. Much of the ice cover is recently formed thin ice that will melt out quickly. Research has shown that sea ice extent in spring does not tell us much about ice extent the following summer. More important to the summer melt is the thickness of the ice cover, and summer weather.
April 2012 compared to past years
Arctic sea ice extent for April 2012 was near average for the month in the satellite record, but was the highest since 2001. Including the year 2012, the linear rate of decline for April ice extent over the satellite record is 2.6% per decade.
Antarctic sea ice spread by strong winds
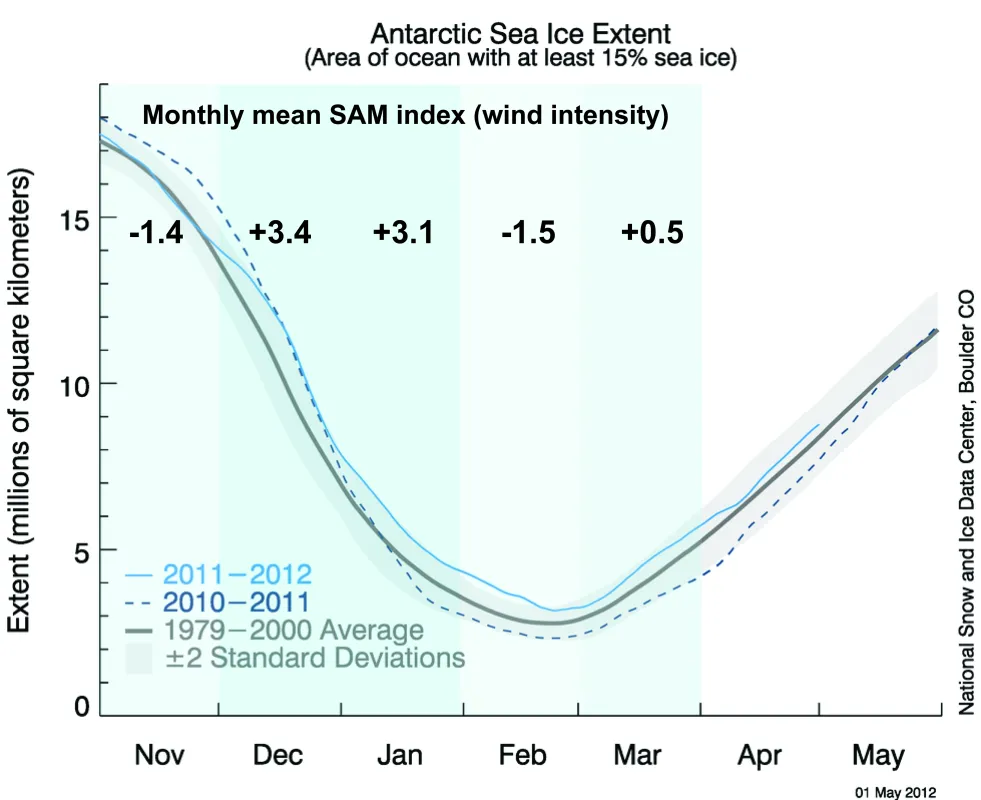
The sea ice cover that surrounds the continent of Antarctica has been higher than average through most of the Southern Hemisphere summer (December to March). Ice extent declined much more slowly than usual in late November and remained above average through December and January, although it did not reach record highs for those months. At its minimum extent in March, Antarctic sea ice remained above average. Ice extent was the highest in the Weddell Sea and the northwestern Ross Sea.
The high ice extent likely stemmed from unusually strong winds that circled the continent of Antarctica during most the southern summer. These circumpolar winds tend to push the ice out from the continent, increasing the extent of the ice, although not necessarily the volume. Air temperatures in December and January were close to average over most of the sea ice-covered water. Researchers approximate the circumpolar wind intensity by an index called the Southern Annular Mode (SAM). A positive value for SAM indicates strong circumpolar winds around the continent; negative values indicate weaker winds. This index was at a record high for the two months of December 2011 and January 2012, at the same period of the higher-than-normal seasonal extents.
Cryosat provides new ice thickness data
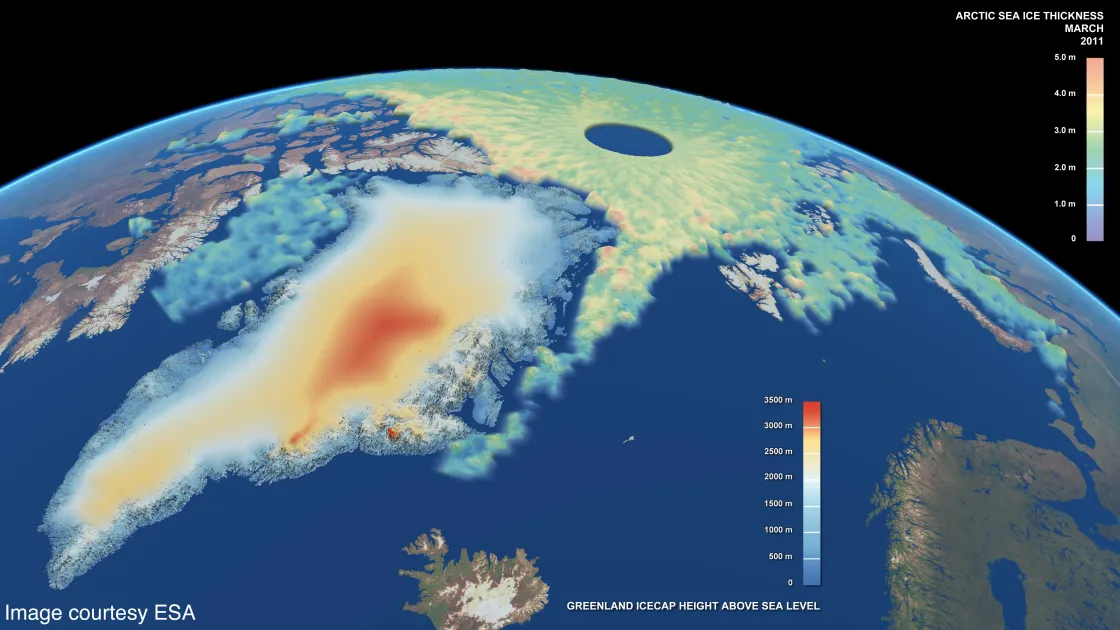
NSIDC data provide a long-term record of the Arctic and Antarctic sea ice cover. But researchers also want to know how thick the ice cover is, since thinner ice melts faster than thicker ice. Ice thickness measurements are more limited than ice extent, because researchers can only sample small regions in person, and there have only been a few satellite sensors that can measure ice thickness. For example, the NASA ICESat satellite recorded Arctic sea ice thickness between 2003 and 2008, but the mission ended in 2009, and the follow-on mission is not expected to begin until 2016. In the meantime, NASA is filling some of the data gap with airplane-borne instruments as part of Operation IceBridge.
The European Space Agency (ESA) has released initial data from the radar altimeter on their CryoSat-2 satellite. Last week, ESA released the first calibrated maps of Arctic sea ice thickness capturing thickness changes through the winter from October 2010 through March 2011. In the coming years, CryoSat-2 will provide monthly fields of thickness that will allow scientists to track the evolution of the ice cover.
Further Reading
Kwok, R., G. F. Cunningham, M. Wensnahan, I. Rigor, H. J. Zwally, and D. Yi. 2009. Thinning and volume loss of the Arctic Ocean sea ice cover: 2003–2008, J. Geophys. Res., 114, C07005, doi:10.1029/2009JC005312.
Kwok, R., G. F. Cunningham, S. S. Manizade, and W. B. Krabill. 2012. Arctic sea ice freeboard from IceBridge acquisitions in 2009: Estimates and comparisons with ICESat, J. Geophys. Res., 117, C02018, doi:10.1029/2011JC007654.
Kwok, R., and G. F. Cunningham. 2008. ICESat over Arctic sea ice: Estimation of snow depth and ice thickness, J. Geophys. Res., 113, C08010, doi:10.1029/2008JC004753.
Laxon, S., N. Peacock, and D. Smith. 2003. High interannual variability of sea ice thickness in the Arctic region, Nature, 424, 947-950, October, doi:10.1038/nature02063.
