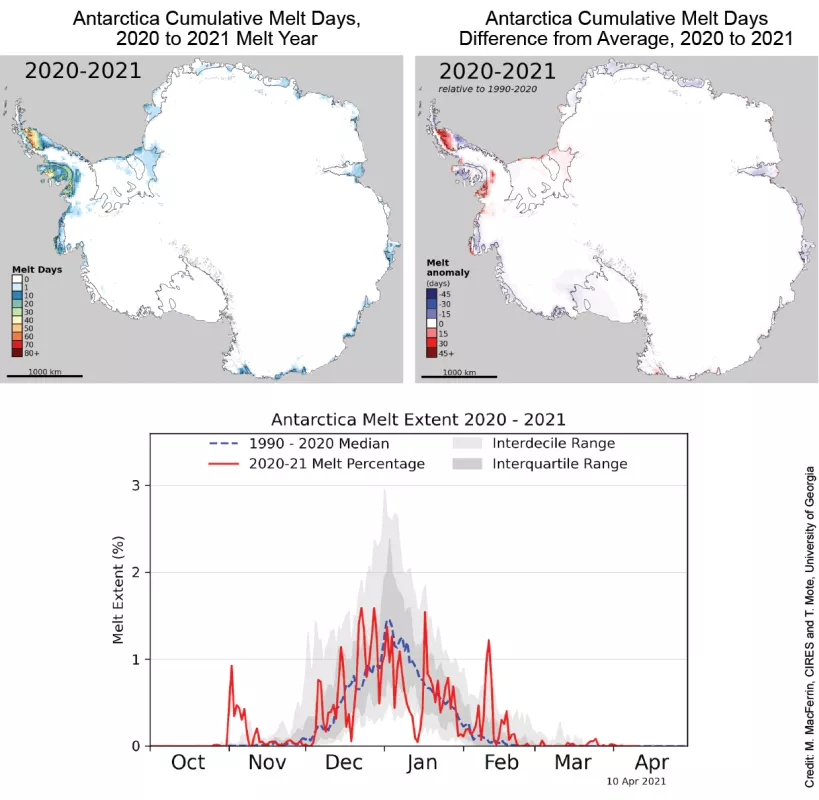
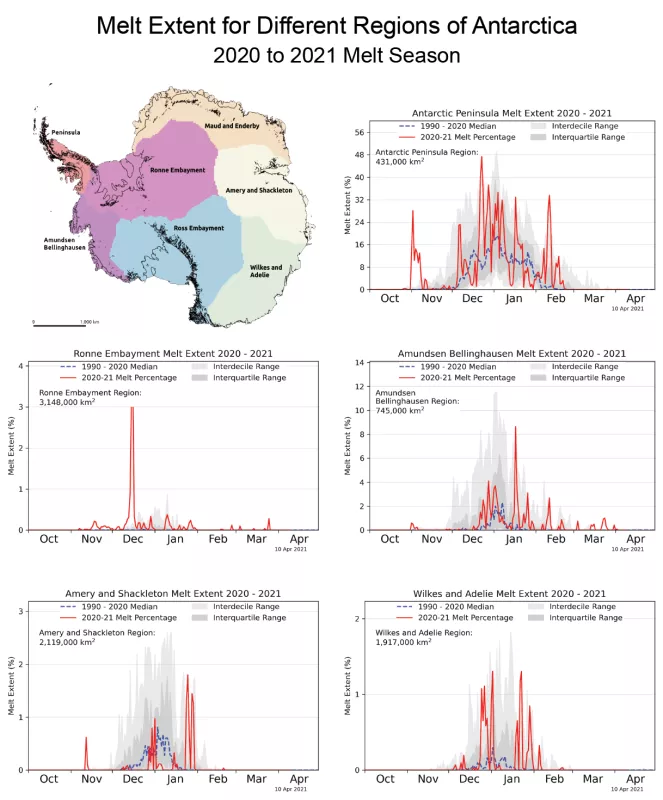
With the exception of the northern and southern Antarctic Peninsula, the Antarctic melt season for 2020 to 2021 was unremarkable and below the 1990 to 2020 average. While the Peninsula melt season began with several strong melt events in early November, both that region and several others had little melt in January, which is usually the peak of the season. In mid-December, strong winds from the north brought warm conditions as far as the South Pole, resulting in a large but brief event in the northern Filchner Ice Shelf.
Overview of conditions
Since mid-February, melting on the Antarctic continent dropped to almost nil, capping a season that started with a few intense melt events in the Peninsula, the Amery Ice Shelf, and the Filchner Ice Shelf. In the Peninsula, over the northern Larsen C and Larsen B remnant ice shelves, there were 30 days more melt days than during the 1990 to 2020 reference period. The mid-peninsula regions, including the George VI Ice Shelf and the Wilkins Ice Shelf, had near-average to below-average melt seasons. By contrast, the southern area of the Peninsula had an above average number of melt days, notably in the area of Stange Ice Shelf. Elsewhere, it is the absence of melt that is most notable: the Amery Ice Shelf had 5 to 10 days below average melt days; the Roi Baudoin Ice Shelf had about 10 days below average; and in the northeastern Ross Ice Shelf there was essentially zero extensive surface melting recorded. However, in the Filchner Ice Shelf and Brunt ice shelf, a brief but extensive melt event occurred in mid-December that reached far to the south on the ice shelf surface, covering the entire length of the shelf.
Conditions in context
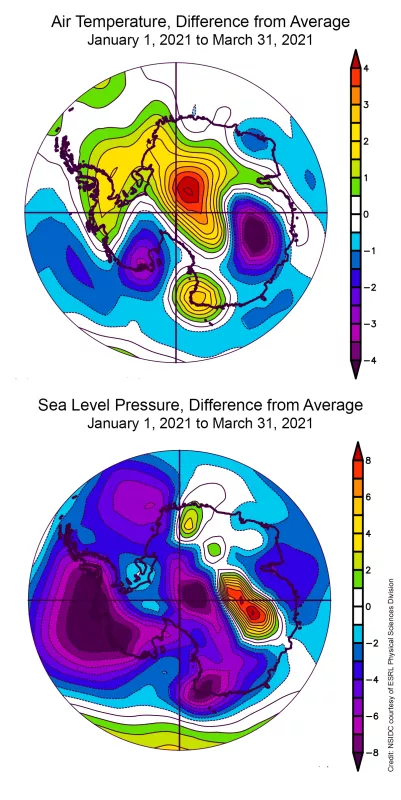
Antarctic climate for the last part of the melt season, from January 1 to March 31, exhibited near-average to cool conditions near the coast, where the majority of surface melting tends to occur. However, conditions were above average near the South Pole and Weddell Sea (Figure 2, top). An atypical and intense Amundsen Sea low-pressure drove strong winds from the east along the coast of the West Antarctic Ice Sheet and kept the eastern Ross Ice Shelf cooler than average (Figure 2, bottom). Warm conditions in eastern Wilkes Land triggered a few significant melt events, and slightly above-average melting.
Warm event on the Filchner Ice Shelf
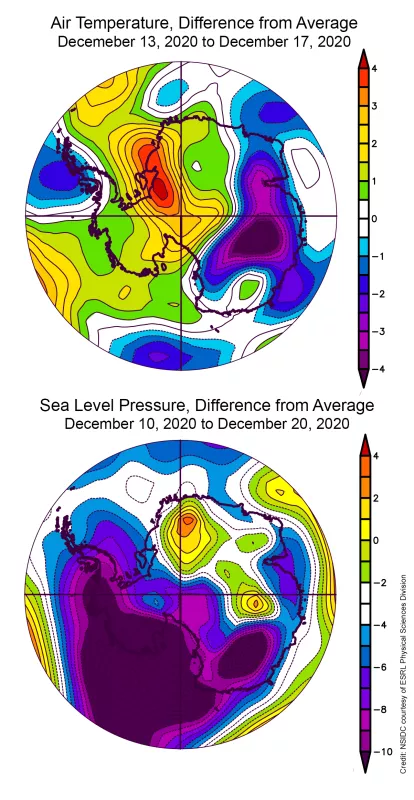
An unusually large area of melting occurred on the Filchner Ice Shelf in mid-December, induced by strong winds from the north. The Filchner Ice Shelf is a relatively narrow ice shelf region on the eastern side of Berkner Island and the large Ronne Ice Shelf. High air pressure in Queen Maud Land and a large low-pressure area stretching across the Ronne Ice Shelf drove the wind pattern, bringing warm conditions all along Coats Land and as far as the South Pole (Figure 3). The South Pole remained well below freezing, but temperatures were still above average during this period. Temperatures from December 13 to December 17 averaged more than 3.5 degrees Celsius (6.3 degrees Fahrenheit) above the 1981 to 2010 reference period for the area. Surface melting was indicated as far south as Support Force Glacier at 83 degrees South. This pattern where low pressure over the eastern Amundsen Sea, Antarctic Peninsula, and western Weddell brings warm winds inland is an example of a climate trend as noted by our colleagues Kyle Clem and Ryan Fogt and others in a 2020 paper.
Further reading
Clem, K. R., R. L. Fogt, J. Turner, B. R. Lintner, G. J. Marshall, J. R. Miller and J. A. Renwick. 2020. Record warming at the South Pole during the past three decades. Nature Climate Change, 10(8), 762-770, doi:10.1038/s41558-020-0815-z.


