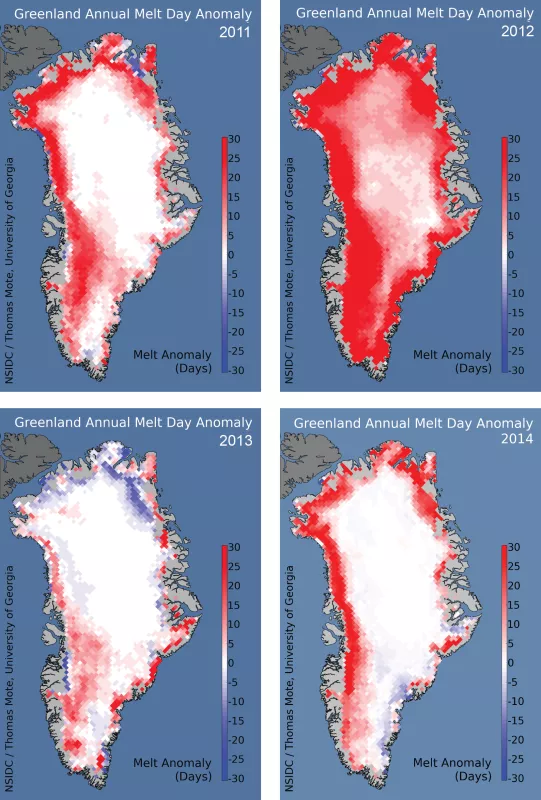
Melt extent in Greenland was well above average in 2014, tying for the 7th highest extent in the 35-year satellite record. Overall, climate patterns favored intense west coast and northwest ice sheet melting, with relatively cool conditions in the southeast.
Overview of conditions
Melt extent for the Greenland Ice Sheet in 2014 was similar in its regional pattern and intensity to the year 2011, with above average melting in northwestern and western Greenland, and average to below-average southeastern melt. This regional pattern of melting was more or less consistent for June, July, and August. The year 2014 stood in strong contrast to 2012, a record melt year for all areas, and to 2013, when much cooler conditions prevailed in the north. However, unlike the other three years, surface melting in 2014 was generally confined to low elevation areas near the coast.
Conditions in context
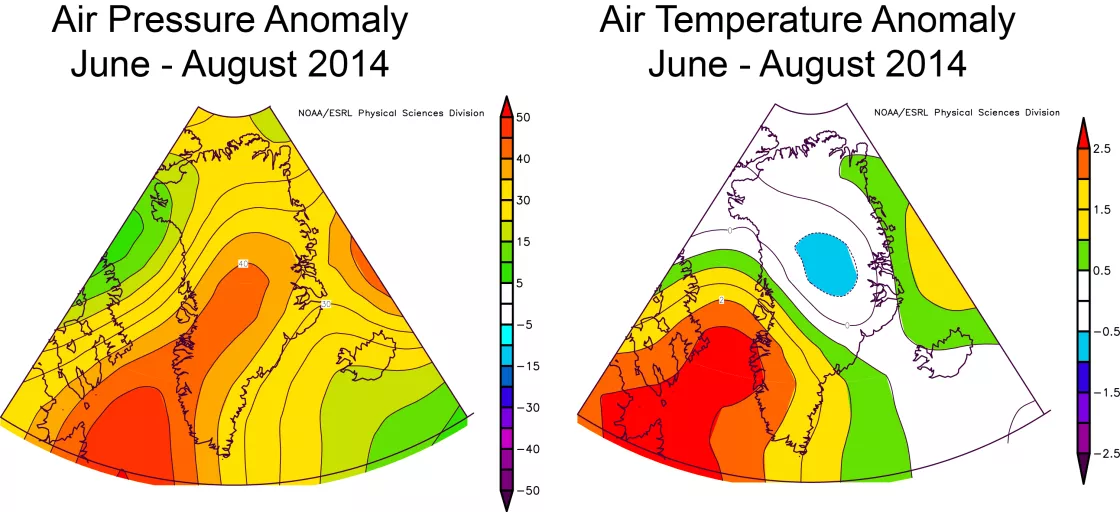
Weather conditions were dominated by high pressure across the entire island but particularly in the southwest. Previously we noted the association between widespread surface melt and periods of high pressure (see our August post). Unsurprisingly, warm conditions prevailed near the areas of highest melting in the southwest. A few sites in southwestern Greenland (e.g. Kangerlussuaq) experienced the warmest summer on record in 2014, surpassing 2012 (see the NOAA Arctic Report Card for 2014). While average temperatures were 1 to 2 degrees Celsius (2 to 4 degrees Fahrenheit) warmer than the 1981 to 2010 average over the southwestern coast, conditions were near average over much of the northwest and northern ice sheet. Yet these areas also experienced above average melt extents, consistent with greater absorption of sunlight since 2009 due to darker snow affecting the frequency of surface melting for Greenland.
Greenland in 2014 compared to previous years
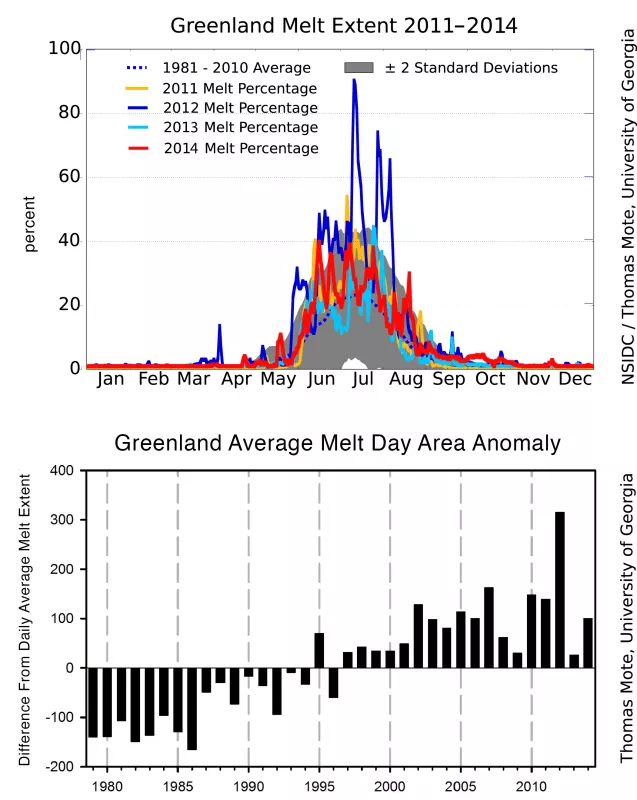
Comparing the seasonal progression of the four most recent years, the recent tendency for greater-than-average melt extent is apparent, as are the rapid variations in melt extent mid-year. The melt season of 2014 had a series of moderately extensive melt events early on, but did not undergo the expansive areas of surface melt on the high parts of the ice sheet as in 2012. Relative to the 35 years of continuous satellite measurements, 2014 is tied with 2006 for seventh highest, and is well above the 1981 to 2010 average. Melt area total (the sum of daily melt extents for the entire June through August period) was approximately 100,000 square kilometers (38,600 square miles) above the 1981 to 2010 average. The top eight melt extent years have all occurred since 2002.
NAO you tell me
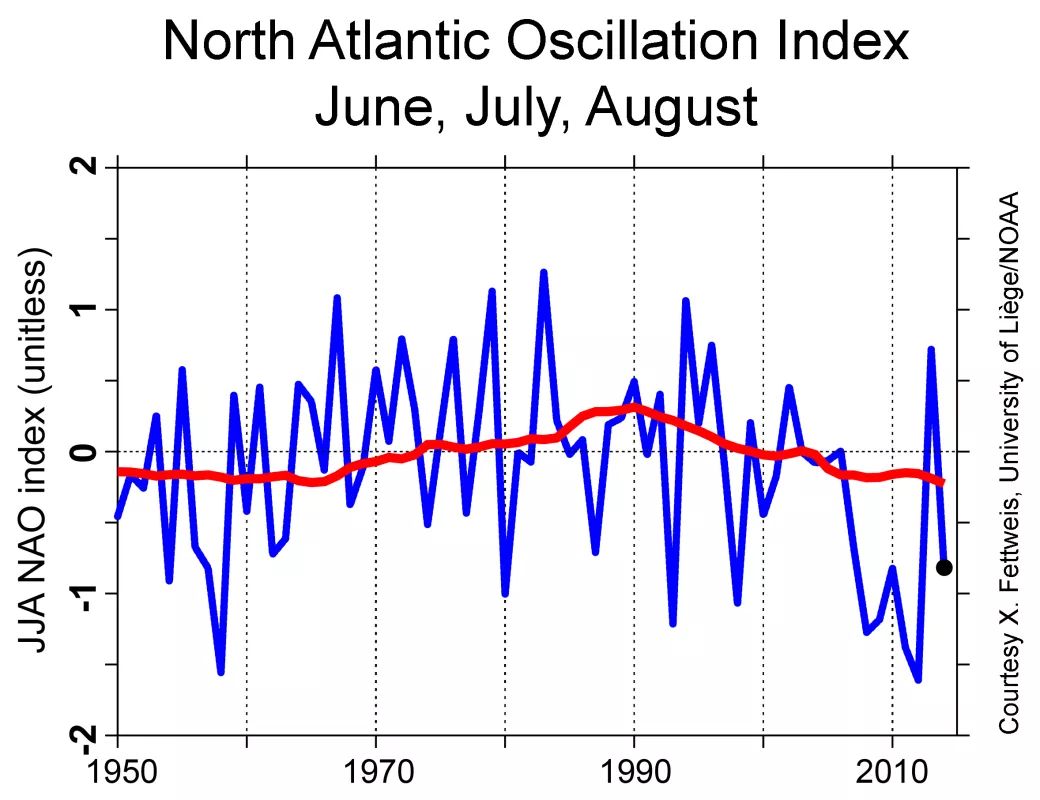
Recent trends towards increased surface melting in Greenland coincide with a trend in the summertime North Atlantic Oscillation (NAO) pattern, a large-scale climate feature with wide influence over conditions in Greenland. The NAO index is a measure of the strength of the pattern, arbitrarily deemed positive when the main feature of the pattern, low pressure over Greenland and the central Arctic, is stronger than average, and negative when high pressure patterns prevail. Negative values of the NAO climate index are associated with anticyclonic circulation (high pressure, clockwise in the northern hemisphere) over Greenland, producing a tendency to draw warm air from the south along the west coast of Greenland and generally into the North Atlantic. While the NAO has been thought to be a more important feature during the cold season, recent studies find it to be an important metric at other times of the year, through its circulation control on mid-year heat and clear sky delivery to Greenland. Although summer 2014 had a moderately negative index NAO value, a period of neutral conditions occurred mid-summer at the time of the maximum melt. In contrast, during the summer of 2012 the NAO was intensely negative throughout the whole summer season. This explains why summer 2014 melt was not exceptional, while its average June through August NAO index was negative. However, in mid-June and mid-August, when the NAO was the lowest, some strong anticyclonic conditions resulted in very warm events for the season, consistent with the persistent warm conditions and extensive melting induced by negative NAO conditions.
A darker mood
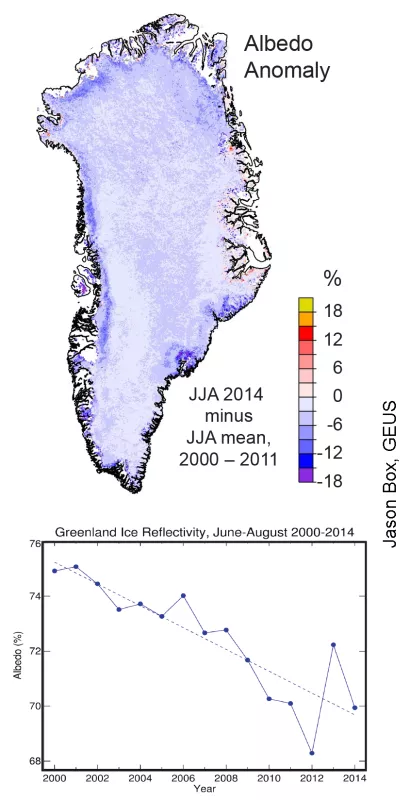
Greenland’s snow and ice was significantly darker in the summer of 2014 than in 2013, and similar to 2011. This darkening trend is apparent in the comparison of the past 15 years of average summer (June through August) reflectivity, shown in Figure 5b. The darker snow absorbs more sunlight, leading to earlier melt onset and overall more melting, even if air temperature conditions are similar to previous years (as was the case in northwestern Greenland in 2014). Darker snow is a result of increased soot, dust, and even microbes in the snow, and the general trend of warmer summer conditions. Snow also darkens over time as jagged snowflakes evolve into rounder snow crystals. The larger snow grain size allows more light to be absorbed by the snow.
Mapping melt from space
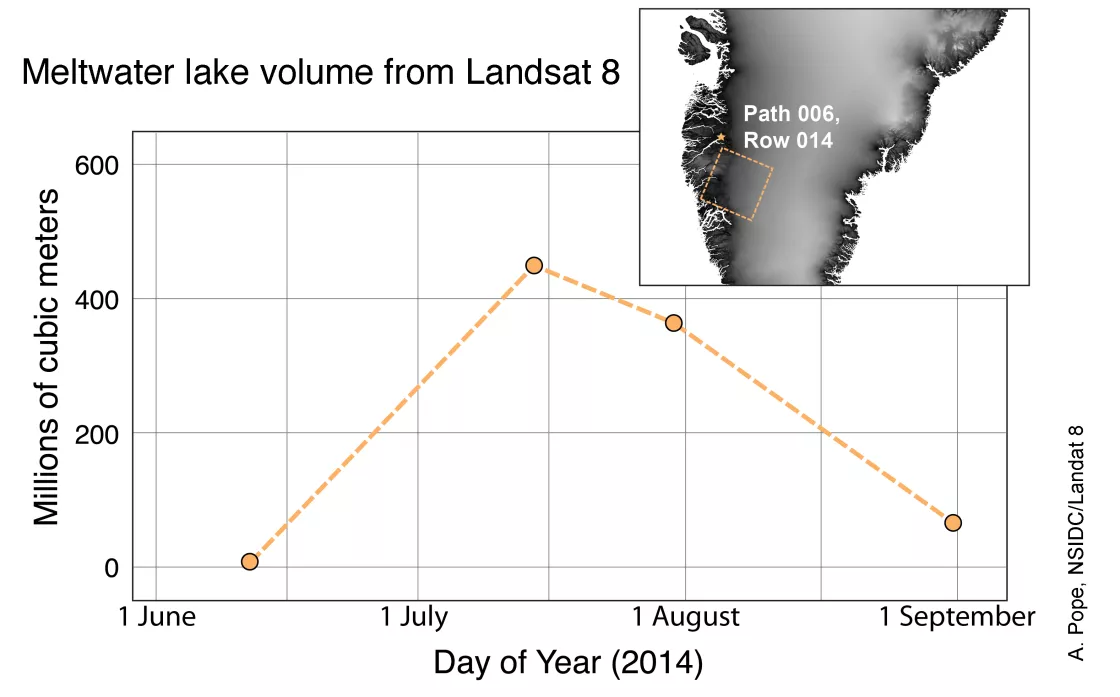
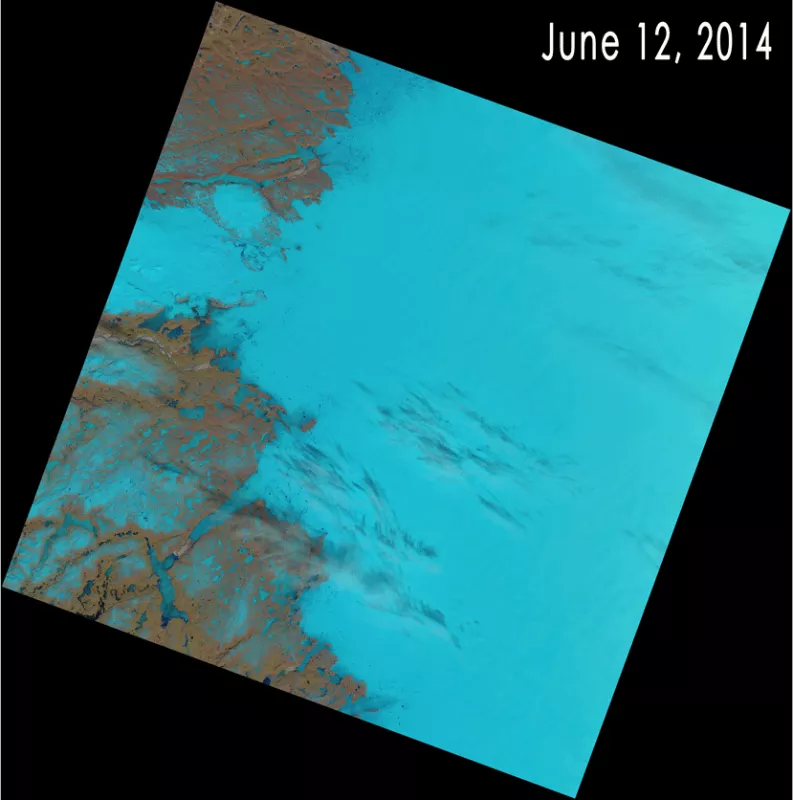
Landsat 8, launched in February of 2013, is proving to be a very useful tool for tracking changes in the ice sheets. A pair of ongoing studies at University of Colorado Boulder seeks to determine the best methods for mapping melt lake extent and depth, and both are making extensive use of Landsat 8. Melt lake volume is determined by both absorption of light in the lake water in a single color of the satellite images, or by assessing the ratio of two color channels of the image. Total meltwater volume pattern through the summer changes with latitude, elevation, and summer weather conditions.
Further reading
Arctic Report Card: Update for 2014. https://arctic.noaa.gov/report-card/
Box, J. E., X. Fettweis, J. C. Stroeve, M. Tedesco, D. K. Hall, and K. Steffen. 2012. Greenland ice sheet albedo feedback: thermodynamics and atmospheric drivers. The Cryosphere 6, 821-839, doi:10.5194/tc-6-821-2012.
Dumont, M., E. Brun, G. Picard, M. Michou, Q. Libois, J. R. Petit, M. Geyer, S. Morin, and B. Josse. 2014. Contribution of light-absorbing impurities in snow to Greenland's darkening since 200. Nature Geoscience 7, 509-512, doi:10.1038/ngeo2180.
Moussavi, M., W. Abdalati, A. Pope, and T. Scambos. 2015 in prep. Spaceborne derivation and validation of supraglacial lake volume along the western margin of the Greenland Ice Sheet. Remote Sensing of Environment, in preparation.
Pope, A., T. Scambos, M. Moussavi, M. Tedesco, M. Willis, and D. Shean. 2015 in prep. Estimating supraglacial lake depth using Landsat 8. The Cryosphere, in preparation.
