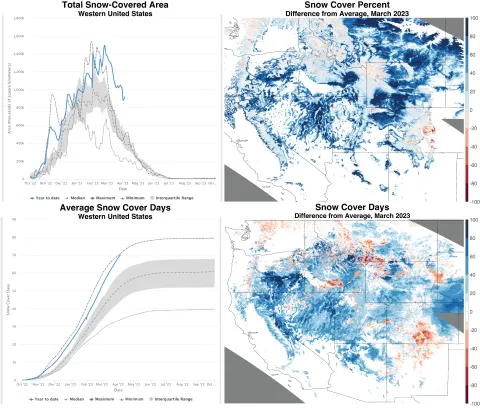
Figure 2. The upper left graph shows the total snow-covered area over the western United States in relation to the 23-year satellite data. The upper right map shows the difference between the snow cover percent for March averaged over the 23-year satellite record and the snow cover percent recorded in March 2023. Warm colors indicate below-average snow cover, cool colors indicate above-average snow cover, and white areas indicate little variation from the average. The lower left graph shows snow cover days over the western United States in relation to the 23-year satellite data. The lower right map shows the difference between the snow cover days of an average year and this year, summed from October 1, 2022, to March 31, 2023. Warm colors indicate below-average snow cover days, cool colors indicate above-average snow cover days, and white areas indicate little change from the average number of snow cover days. — Credit: Karl Rittger, Institute of Arctic and Alpine Research and Mary J. Brodzik, National Snow and Ice Data Center
