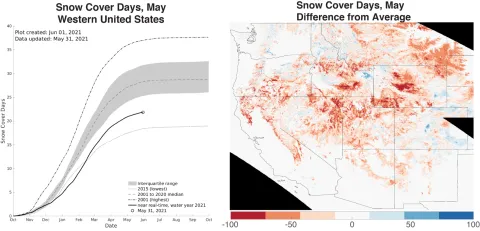
Figure 2. The left plot shows the snow cover days in context with the 21 year-satellite record. The map on the right shows the differences between the average year’s snow cover days and this year’s snow cover days summed from October 1, 2020, to May 31, 2021 with warmer colors indicating below average snow cover days, cooler colors indicating above average snow cover days, and white areas indicating little change from average. — Credit: Karl Rittger, Institute of Arctic and Alpine Research and Mary J. Brodzik, National Snow and Ice Data Center
