By Laura Naranjo
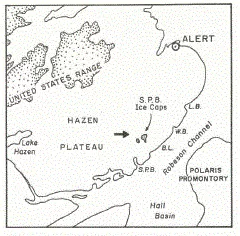
As a young graduate student, Mark Serreze spent the summers of 1982 and 1983 studying two ice caps near St. Patrick Bay on Ellesmere Island in Nunavut, Canada. These ice caps have dramatically shrunk over the past fifty years and and are likely to soon disappear entirely. Their imminent demise has hit Serreze, now NSIDC Director, at a personal level. Serreze reflected on his time there, and said, “I knew every quirk, nook, and cranny of those little ice caps. I had a very personal relationship with them.”
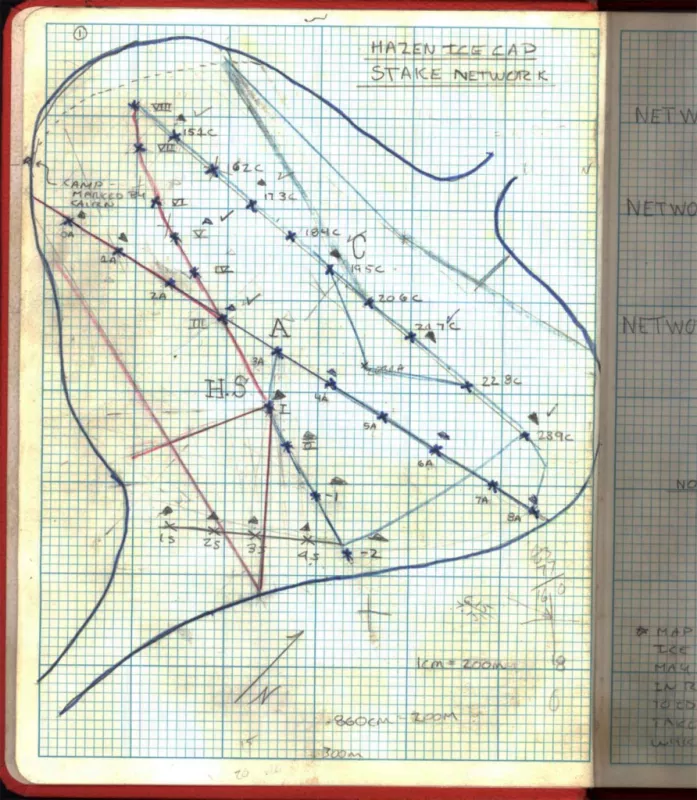
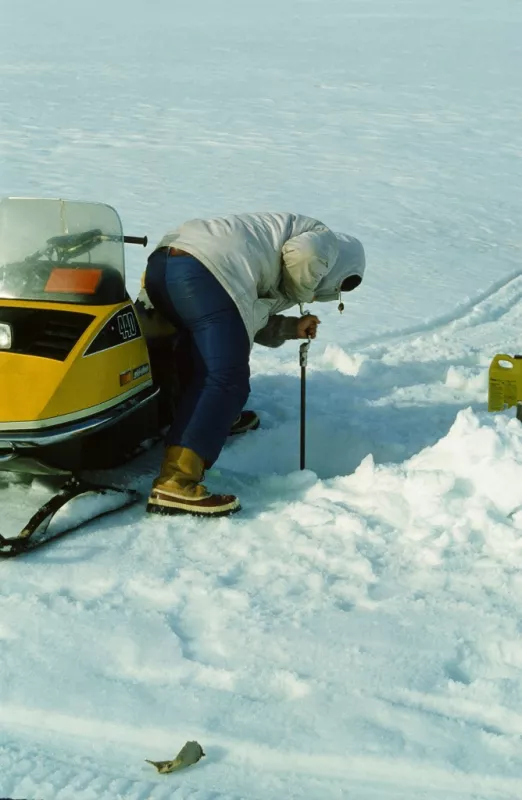
When Serreze first visited the ice caps, not many scientists were talking about global warming, and there was even some talk of global cooling. Under the guidance of renowned climate scientist Ray Bradley of the University of Massachusetts Amherst, Serreze focused on determining the impact of the St. Patrick Bay ice caps on the local climate. He wanted to test an idea: If the climate cooled a bit, feedback processes would kick in that would allow such ice caps to quickly grow. He hoped the process might shed some light on how the continental ice sheets of the Pleistocene initiated. As part of the study, Serreze and Bradley set up a series of stations to measure air temperature and the surface energy balance of the ice caps and surrounding tundra. They also installed a network of aluminum stakes on the larger of the two ice caps. Monitoring changes in the distance between the top of the stakes and the ice surface, together with measurements of the water equivalent of the overlying snow cover, would allow Serreze and future scientists to determine whether the ice cap was gaining or losing mass. Field assistant Mike Palecki helped Serreze to expand the stake network the next summer. The summer of 1982 was warm, and the ice cap lost mass. But 1983 was cooler, feeding the ice cap. Serreze left the ice caps in early August of 1983, never to return again.
A history of ice decline
The St. Patrick Bay ice caps sit on the Hazen Plateau of northeastern Ellesmere Island, between approximately 750 and 900 meters in elevation. Aerial photos taken in 1959 show the ice caps standing out sharply against the dark tundra. Surface dirt layers and stratigraphic layering are exposed, indicating that they were lying completely in the ablation zone where summer melt exceeds winter snow gains. This evidence indicated the ice caps were in decline (negative mass balance) when the photographs were taken. A very different picture emerged in the summer of 1972, when Canadian scientists Harold Serson and J. A. Morrison first surveyed the larger ice cap. They landed by helicopter in foul weather to find the ice cap totally covered with snow. They put in an initial set of eight mass balance stakes along a transect about two kilometers long partway across the ice cap. Scientists G. Hattersley Smith and A. Davidson visited the ice cap later that summer. They concluded that while the ice cap had been in decline, by the early 1970s it had returned to good health, thickening slightly and extending its margins a result of cooler summers over the previous decade. But this cool reprieve did not last. Researcher Simon (C. S. L.) Ommanney found overall mass losses for the 1974-1975 and 1975-1976 seasons.
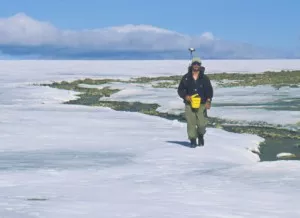
In the summer of 2001, University of Massachusetts scientists Carsten Braun and Doug Hardy returned to the Hazen Plateau. They used a portable GPS to measure the perimeter of both the St. Patrick Bay caps, and also the Simmons and Murray Ice Caps, another pair of small ice bodies lying to the south. A couple of years earlier, they had inserted stakes in both the Simmons and Murray Ice Caps. What they saw was disturbing. All of the ice caps were clearly losing mass. What stakes they could find from the St. Patrick Bay network had melted out; knowing how deep they had been originally inserted helped to pin down at least a minimum estimate of the mass loss. Hardy said, “Those summers on the Hazen Plateau were as close as we’ll ever come to old-style Arctic fieldwork; nobody will ever know the Simmons Ice Cap as intimately as Carsten did.”
Documenting the demise
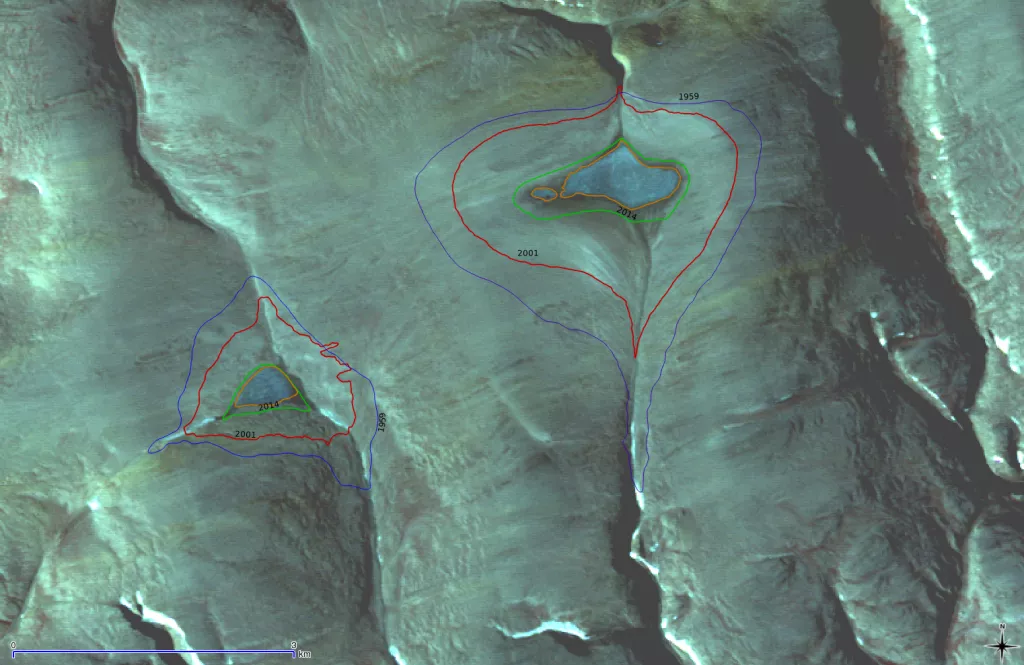
In the 1959 photographs of the St. Patrick Bay Ice Caps, the larger, heart shaped ice cap had an area of about 7.48 square kilometers, and the smaller one about 2.93 square kilometers. Based on the measurements taken by Carsten Braun and Doug Hardy, by 2001 the larger and smaller of the two ice caps had shrunk to 62 percent and 58 percent of their 1959 areas. The last fifteen years have not been kind. Imagery processed by NSIDC scientist Bruce Raup from the NASA ASTER (Advanced Spaceborne Thermal Emission and Reflection Radiometer) satellite instrument shows as of August 2015, the larger ice cap covered only 7 percent of the area that it did in 1959, and the smaller one was down to 6 percent of its original area. They shrank noticeably even between 2014 and 2015. This large one-year change appears to have been in direct response to the especially warm summer of 2015 over northern Ellesmere Island. The Simmonds and Murray Ice Caps have fared no better—they too have seen a remarkable recent shrinking.
ASTER data, with a resolution of 15 meters, are being used at NSIDC as part of the international Global Land Ice Measurements from Space (GLIMS) project, which surveys all of the world’s glaciers. “Mapping all the glaciers and ice caps is a big challenge, but as the climate changes it’s increasingly a moving target,” Raup said.
The St. Patrick Bay ice caps are not relicts of the last ice age, which peaked 15,000 to 25,000 years ago, depending on the region. Instead, the caps probably first formed several thousand years ago when the Arctic experienced a period of cooling following the Holocene Thermal Maximum, a warm interval lasting from 9,000 to 5,000 years ago. During the Little Ice Age, which spanned the sixteenth to the nineteenth centuries, the ice caps were likely several times larger than observed in 1959. They have been in an overall state of decline ever since, interrupted by periods of growth. While eventually they likely would have disappeared on their own, fossil fuel burning has contributed to a strongly warming Arctic in recent decades. The St. Patrick Bay ice caps, along with the Murray and Simmons Ice Caps, are feeling the heat. Serreze said, “While I’ve been to a lot of interesting places since 1983, a day has rarely gone by that I haven’t thought about my early adventures on the St. Patrick Bay ice caps. To think that they are likely to die before I do blows my mind.”
Readings
Bradley, R. S. and M. C. Serreze. 1987. Mass balance of two high Arctic ice caps. Journal of Glaciology 33: 123-128.
Braun, C., D. R. Hardy, and R. S. Bradley. 2004. Mass balance and area changes of four high Arctic plateau ice caps. Geografiska Annaler 86A: 43-52.
Hattersley-Smith, G. and H. Serson. 1973. Reconnaissance of a small ice cap near St. Patrick Bay, Robeson Channel, Northern Ellesmere Island, Canada. Journal of Glaciology 12, 417-421.
