How to import Polar Pathfinder Daily 25 km EASE-Grid Sea Ice Motion Vectors into ArcGIS
This article describes the actions to perform in order work with NSIDC-0116 in ArcGIS. At the time of writing, this tutorial is relevant for ArcMap10.5 and earlier. The following steps will show you how to prepare the binary files for import, format conversion, geolocation/projection, and display options for gridded vectors.
Step 1: Preparing the binary data for ArcToolbox functions
Gridded binary data require an accompanying header file to aid in describing the binary format to ArcTools. The header file can be created with your favorite text exitor. It must be saved with the same name as the data file you wish to bring into ArcGIS, but needs to have the .hdr extension. (e.g. "icemotion.grid.month.1978.11.s.v3.hdr"). The contents of the header file should be:
For Northern Hemisphere data files:
nrows 361
ncols 361
nbands 3
nbits 16
pixeltype signedint
byteorder I
layout bip
ulxmap -4512154.5
ulymap 4512154.5
xdim 25067.525
ydim 25067.525
For Southern Hemisphere data files:
nrows 321
ncols 321
nbands 3
nbits 16
pixeltype signedint
byteorder I
layout bip
ulxmap -4010804
ulymap 4010804
xdim 25067.525
ydim 25067.525
Optional:
NODATA 0
Adding the "no data" line will mask out all zeros.
* For more explanation on how the header content is developed, please navigate to the end of this document.
Step 2: Conversion to GeoTIFF
With your new header file placed in the same directory as your datafile, you are ready for conversion. Open the ArcToolbox and navigate: ArcToolbox > Conversion Tools > To Raster > Raster to Other Format (multiple). Select the binary file, and your preferred output workspace.
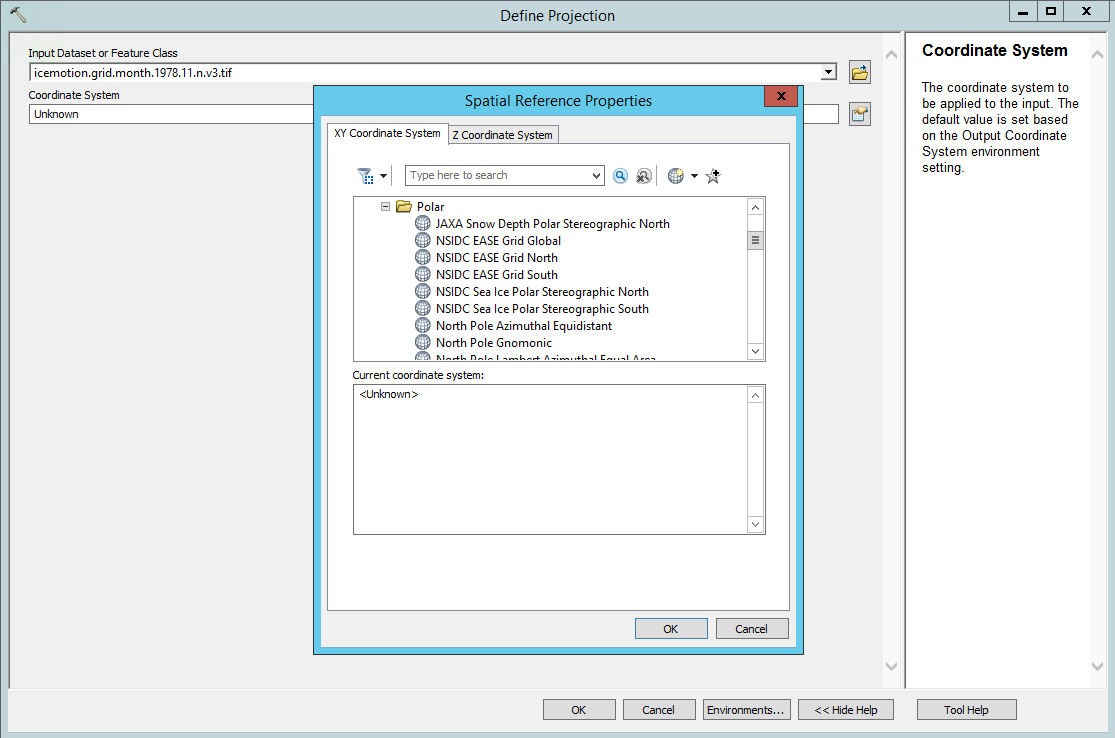
Step 3: Projection and geolocation of GeoTIFF
With Arctoolbox still open, navigate: ArcToolbox > Data Management > Projections and Transformations > Define Projection. Select the "NSIDC EASE Grid North/South", depending on your data. You can find this projection under Projection Coordinate Systems > Polar.
Step 4: Displaying Data in ArcGIS
Your data should now be properly aligned and projected within ArcGIS. However, the three bands of data are represented as an RGB image. From the documentation:
" [the data are stored as] three-item vectors (3, u, v). Each vector represents three variables:
- U Component (cm/sec)—Scaled by a factor of 10; divide by 10 to revert to original units.
- V Component (cm/sec)—Scaled by a factor of 10; divide by 10 to revert to original units.
- Third Variable—Varies for daily and mean grids (see below). For both daily and mean grids, a pixel value of 0 in the third variable indicates no vectors at that location."
In order to check that the vectors are properly represented, first download the browse image accompanying your data: https://daacdata.apps.nsidc.org/pub/DATASETS/nsidc0116_icemotion_vectors_v3/browse/.
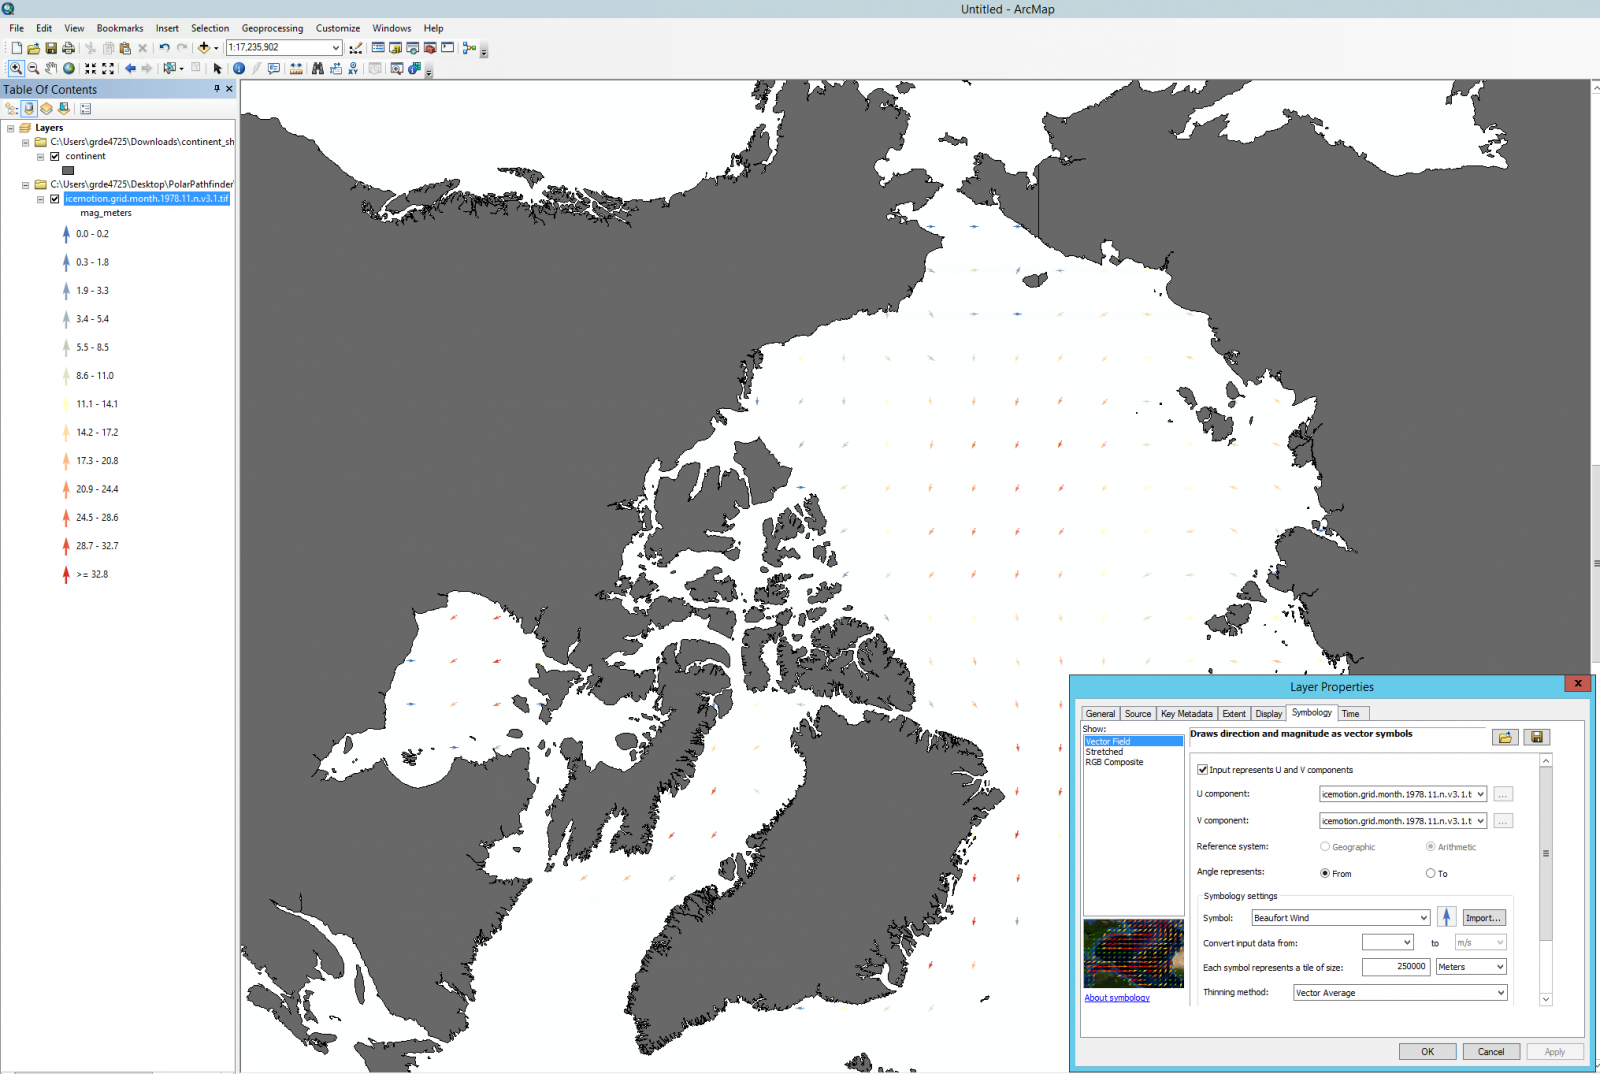
Next, right click on your .tif layer in the ArcGIS Table of Contents > Properties > Symbology Tab > Vector Field. Check the box that says "Input represents U and V component". The drop downs should automatically be set to the first and second band, or U and V, respectively. Ensure that "angle represents" = From. We recommend simply using one of the standard vector scales, such as "Beaufort Wind" to display the vectors, just remember the data are in cm/sec. Adjust the vector thinning as you see fit. Below is an example of monthly, northern hemisphere data, imported with NODATA 0 line added to the header file in step 1.
Done! On to the next file, or setting up batch processing, if you need to.
*Additional information on the header contents.
From the documentation: Data are stored in 2-byte integer binary format (little endian) and are pixel-interleaved three-item vectors (3, u, v). The resolution is 25km, and the i by j dimensions are given for both hemispheres. This information is enough to begin producing the header:
For the northern hemisphere:
nrows 361 ;given
ncols 361 ;given
nbands 3 ;"three item vectors"
nbits 16 ; "2-byte integer" 8 bits per byte
pixeltype signedint ; known integer which will have positive and negative directionality
byteorder I ;"little endian"
layout bip ;"pixel interleaved", BIP stands for Band Interleaved by Pixel
ulxmap -4512154.5 ; 361 25,067.525m resolution pixels -> 9049376.525m across, edge to edge. OR, 9024309m across from furthest grid cell center point.
If center of X is 0, then upper left X located at -4512154.5.
ulymap 4512154.5 ; 361 25,067.525m resolution pixels -> 9049376.525m across, edge to edge. OR, 9024309m across from furthest grid cell center point.
If center of Y is 0, then upper left Y located at 4512154.5.
xdim 25067.525 ; From the MapX Map Projection Parameters, the EASE North scale is defined as 200.5402 km/pixel.
For a nominal 25km grid, there are 8 pixels per map unit, such that 200540.2/8 = 25067.525.
ydim 25067.525 ; same as above, but read more in our Guide to EASE Grids
Last Updated May 2017