On September 13, Arctic sea ice appears to have reached its seasonal minimum extent of 4.64 million square kilometers (1.79 million square miles), the eighth lowest in the 38-year satellite record. The overall rate of ice loss this summer was slowed by a persistent pattern of low sea level pressure focused over the central Arctic Ocean.
Please note that this is a preliminary announcement. Changing winds or late-season melt could still reduce the Arctic ice extent, as happened in 2005 and 2010. NSIDC scientists will release a full analysis of the Arctic melt season, and discuss the Antarctic winter sea ice growth, in early October.
Overview of conditions

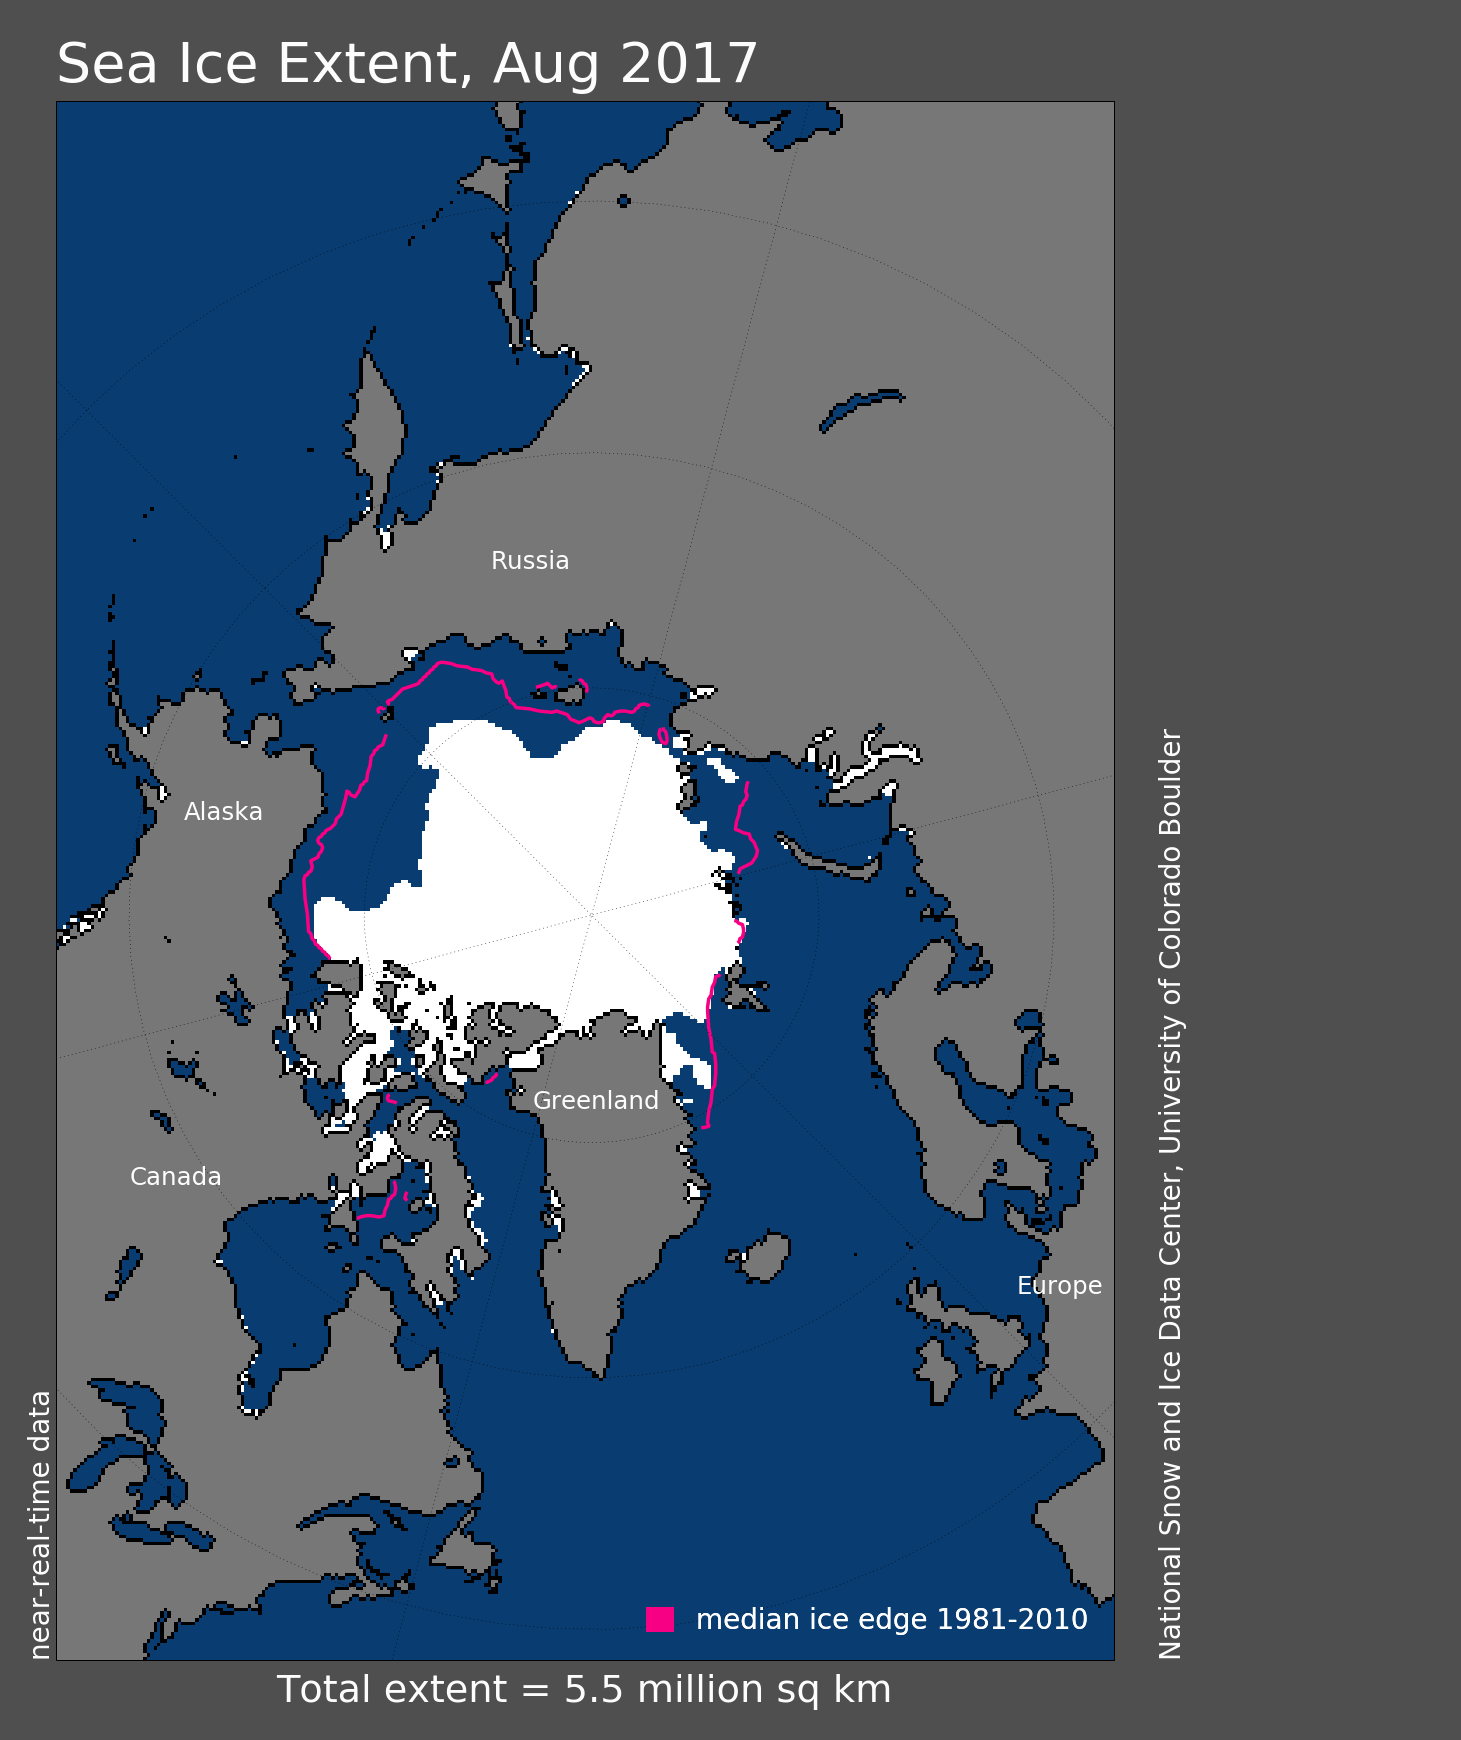
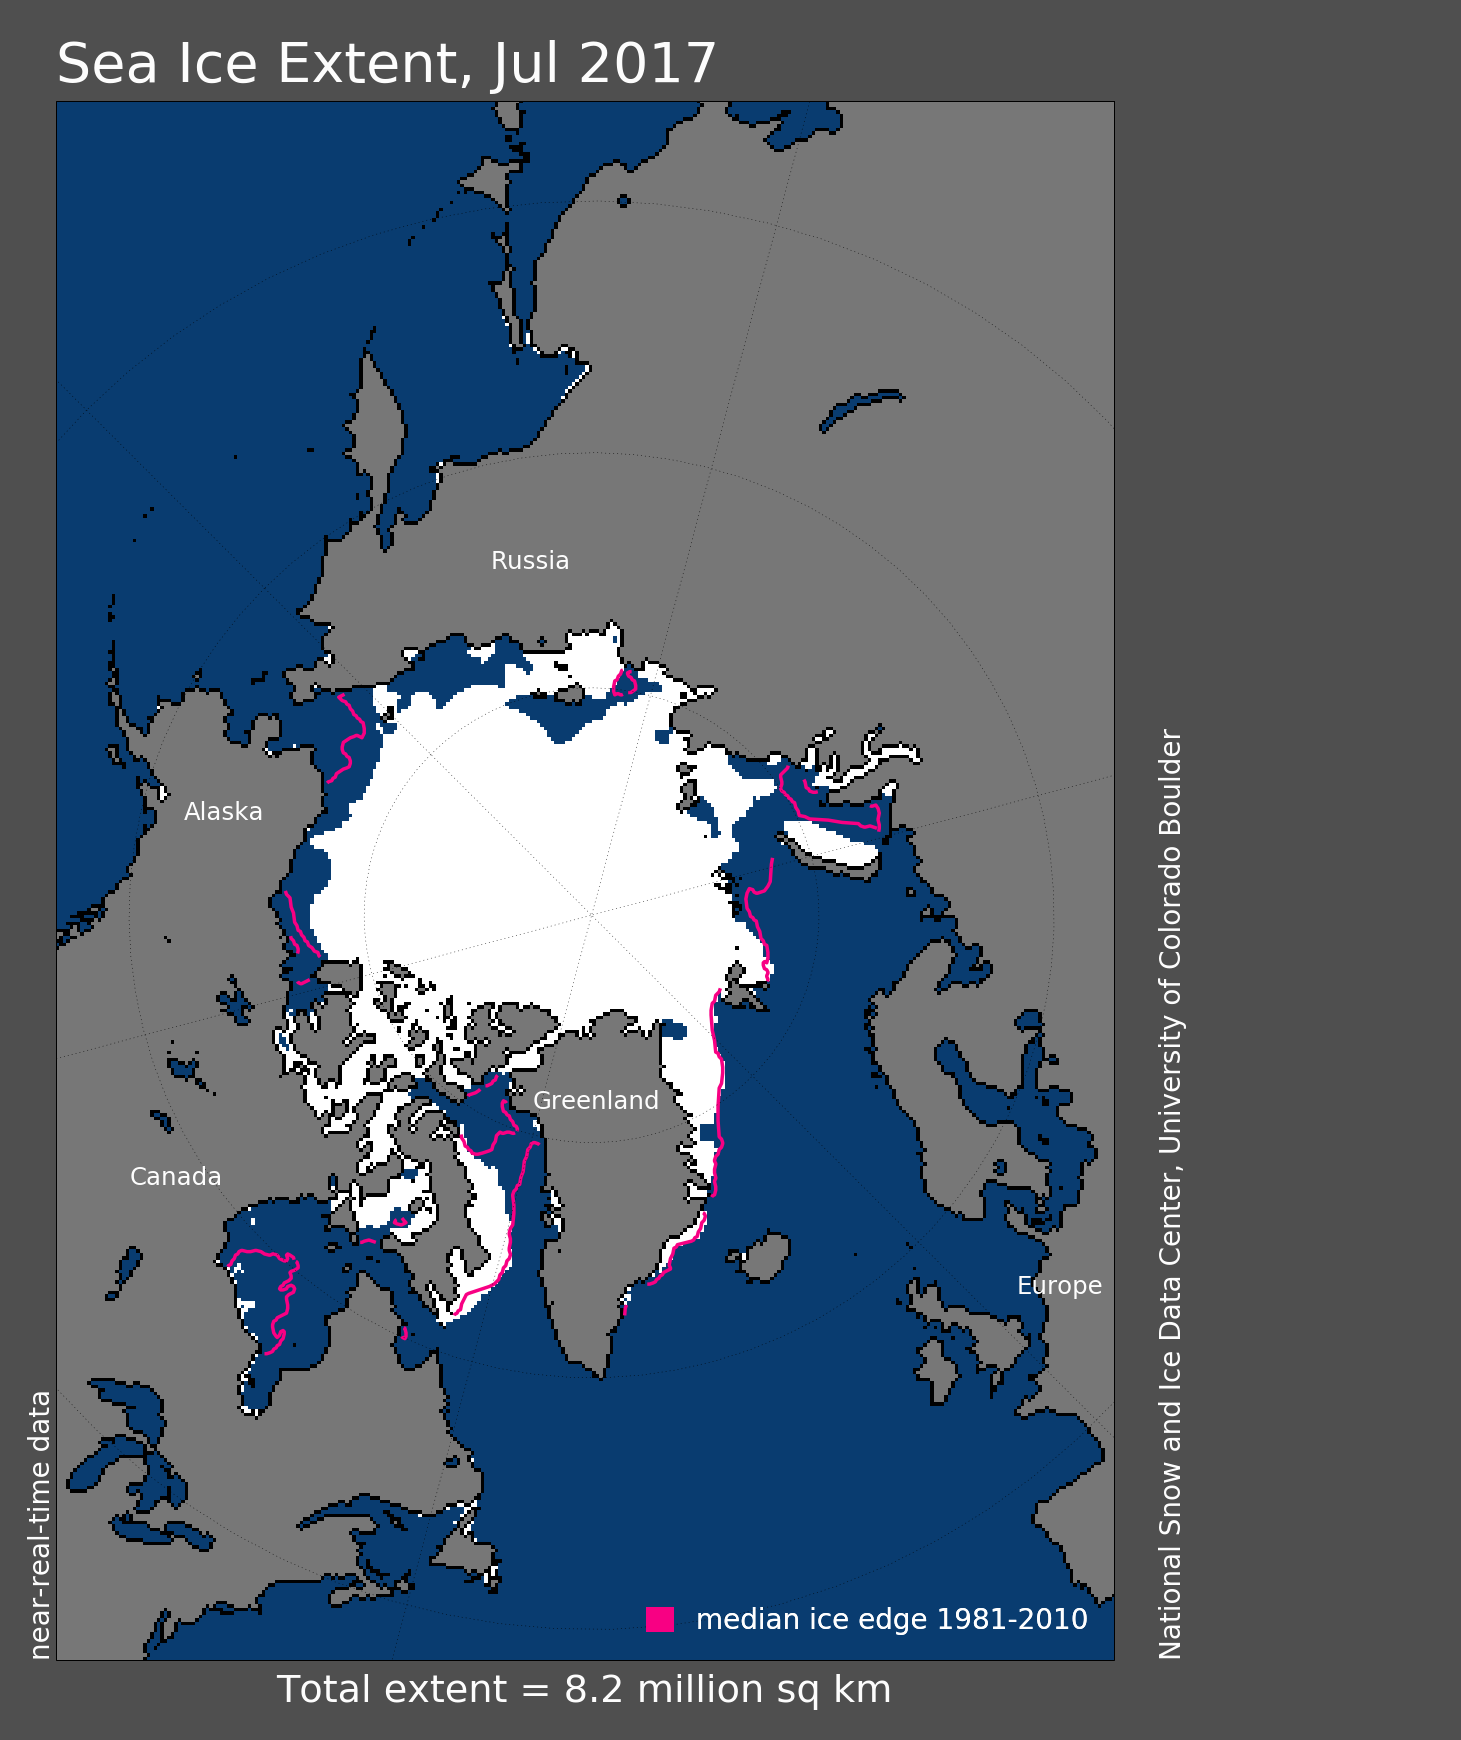
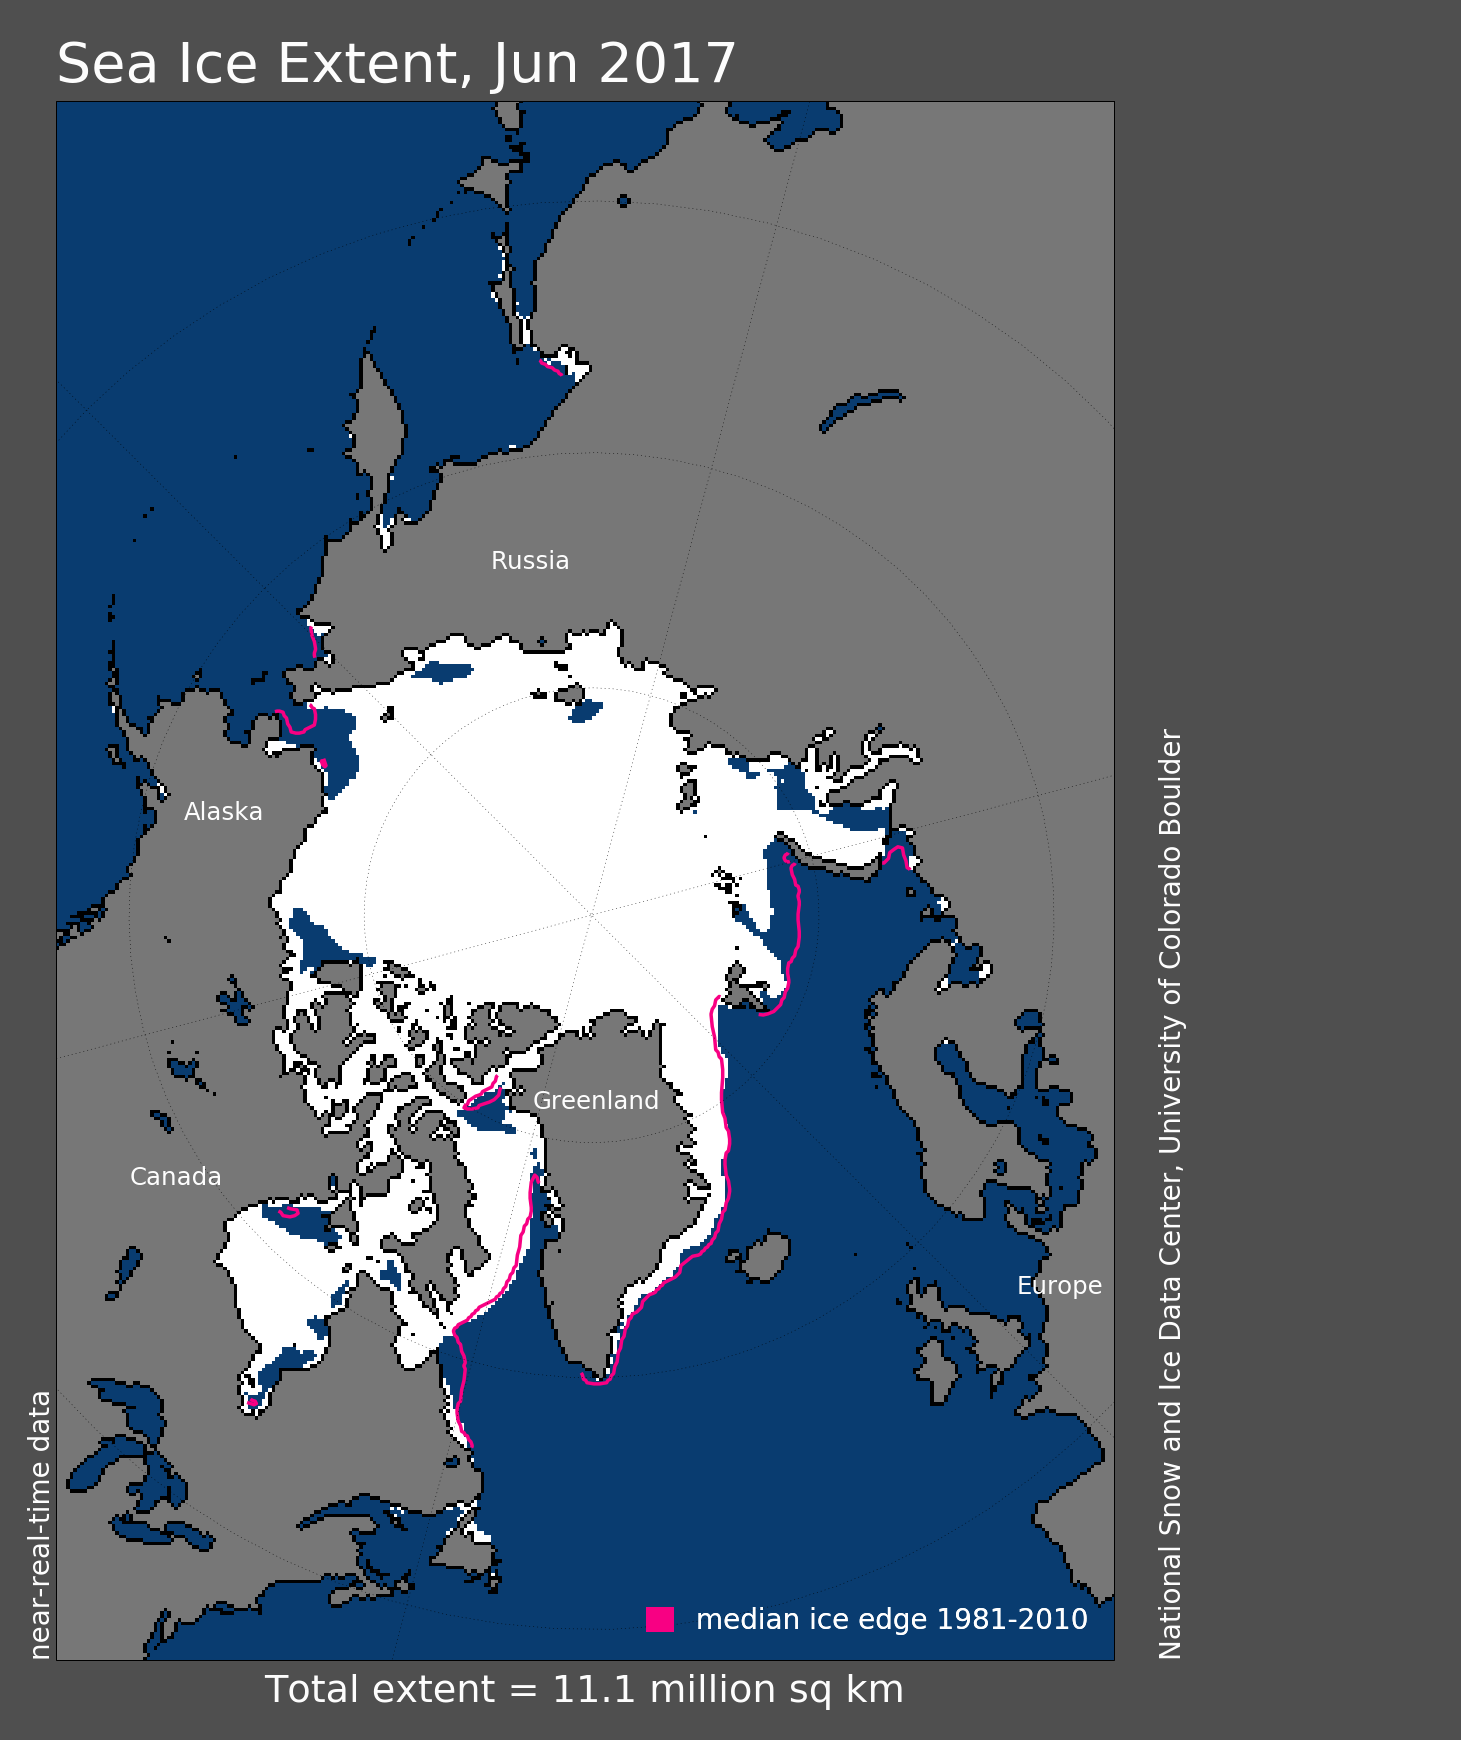
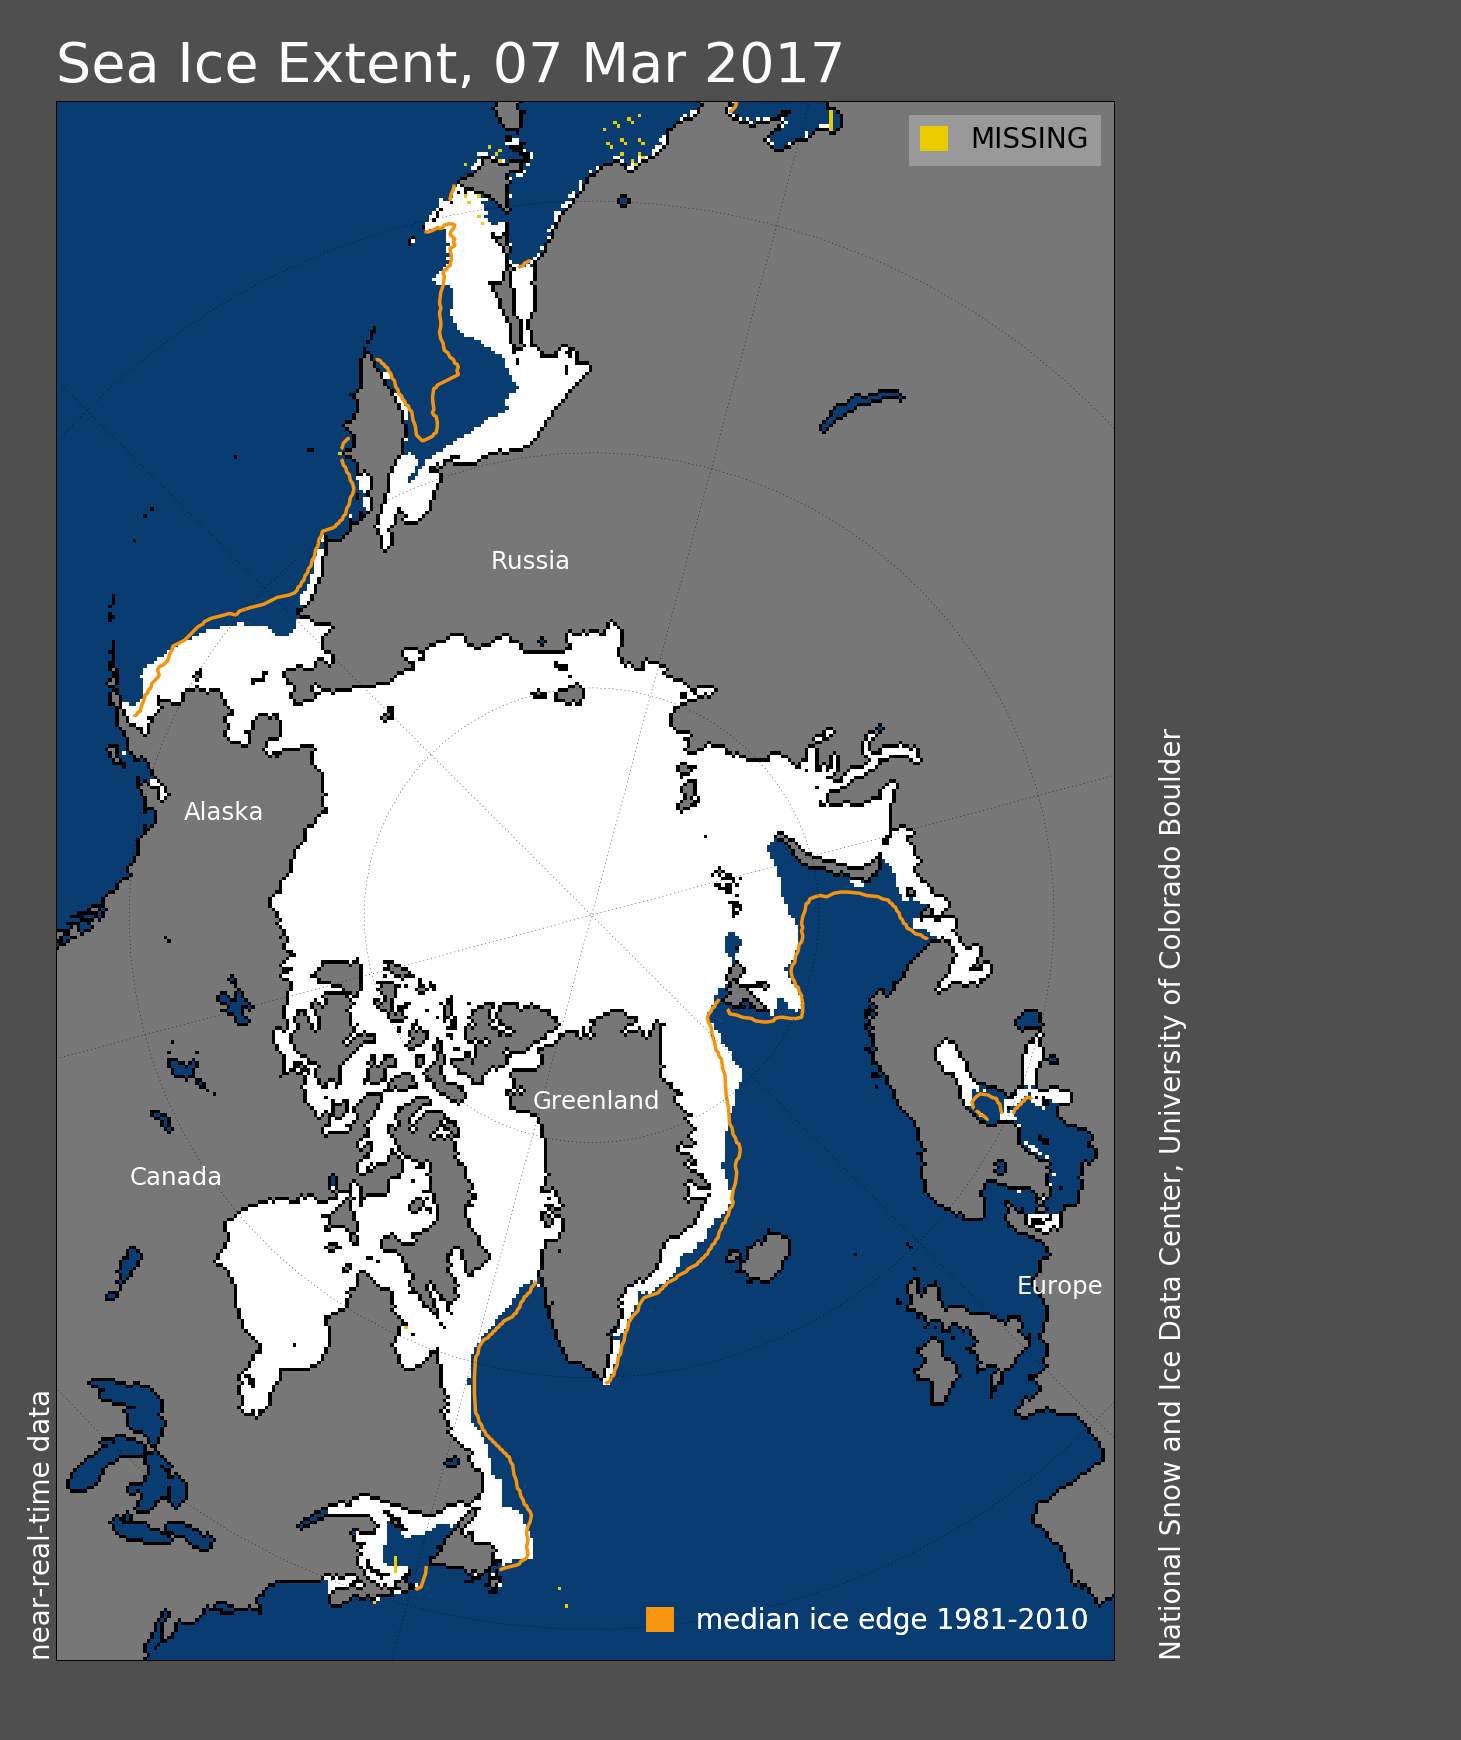
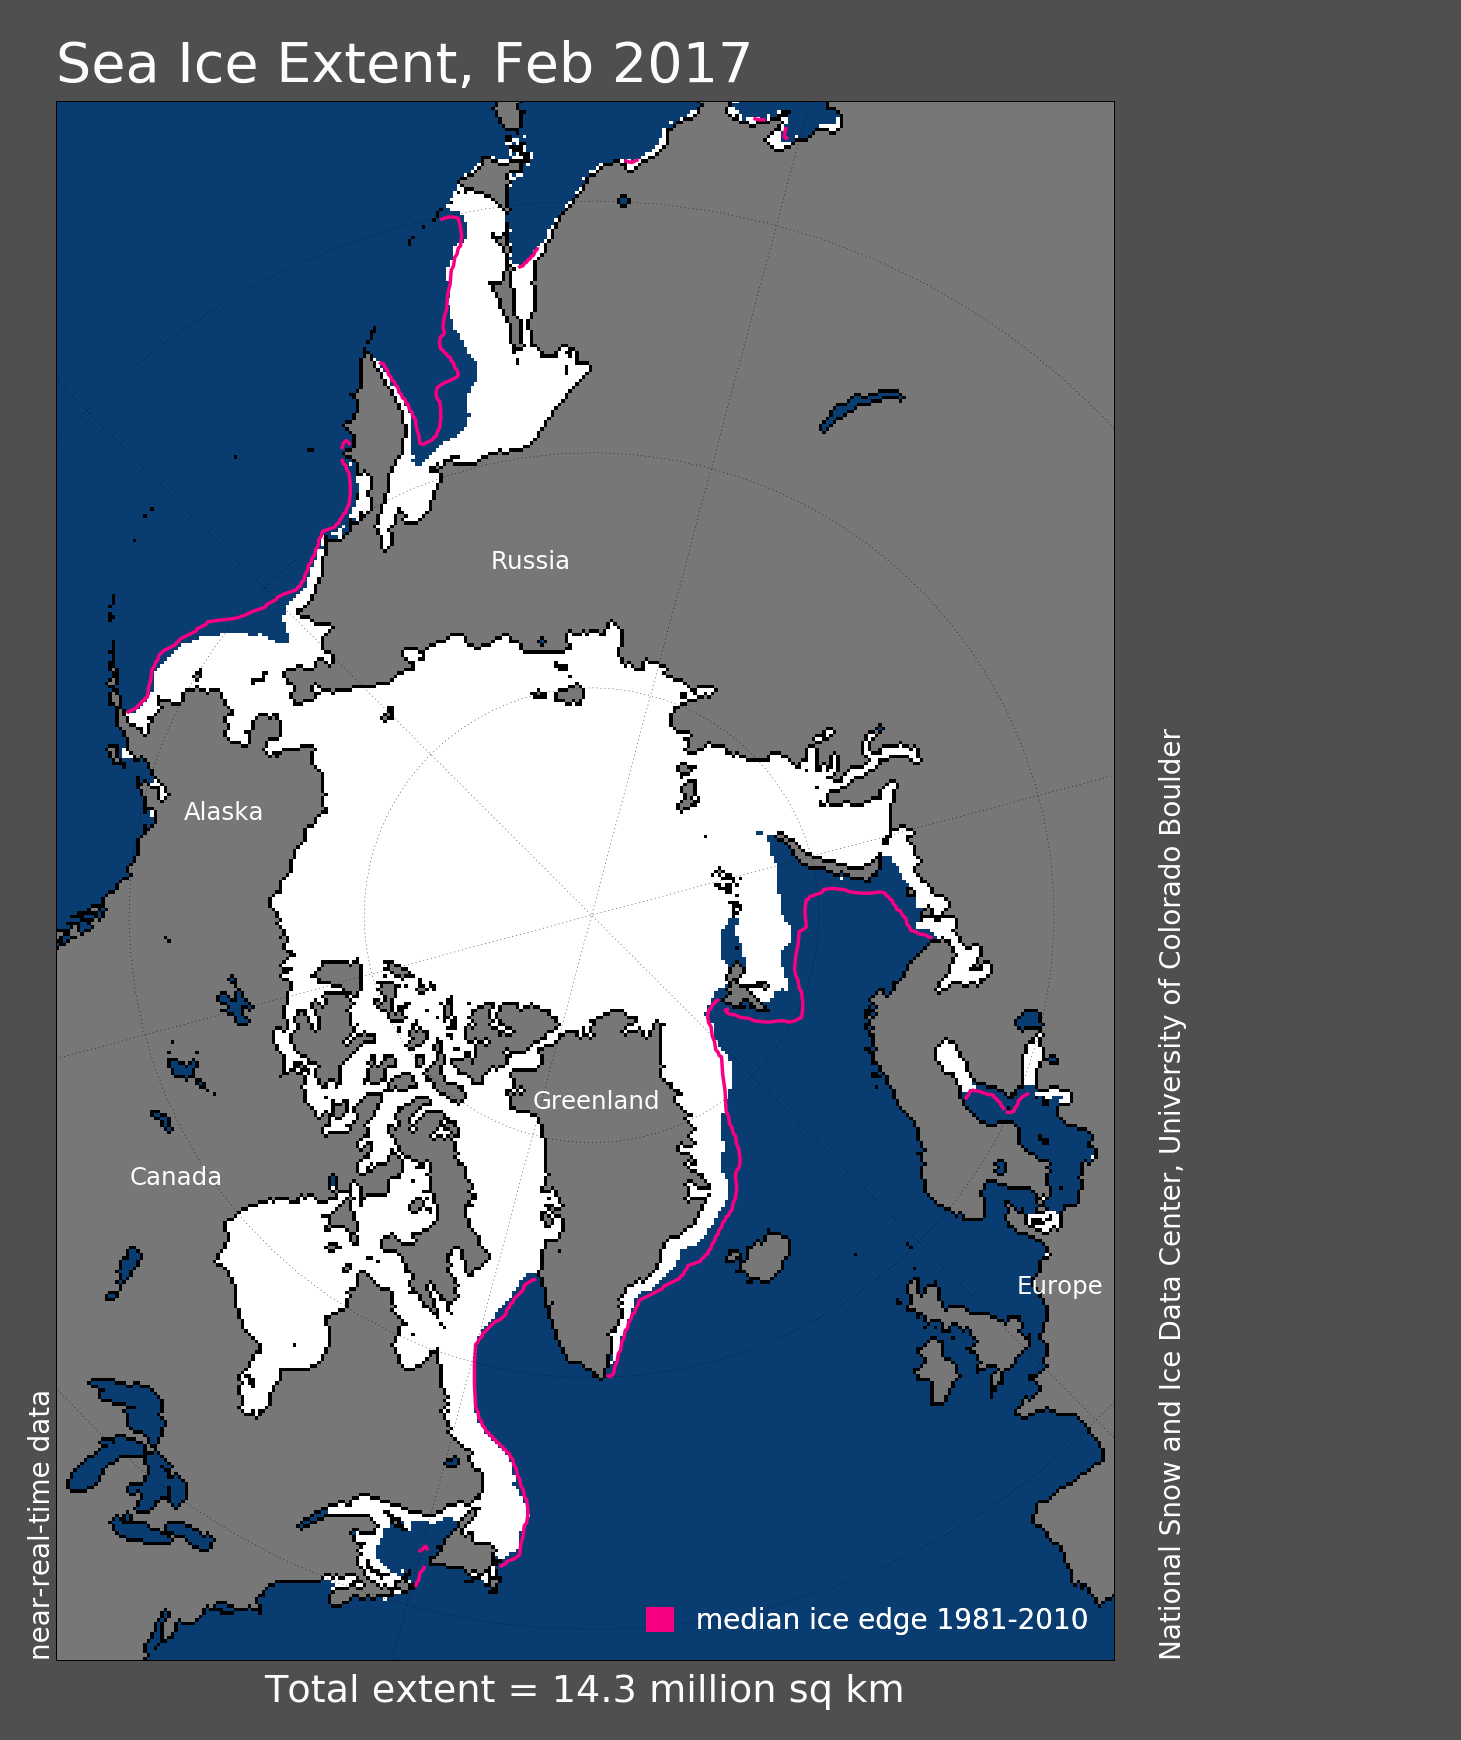
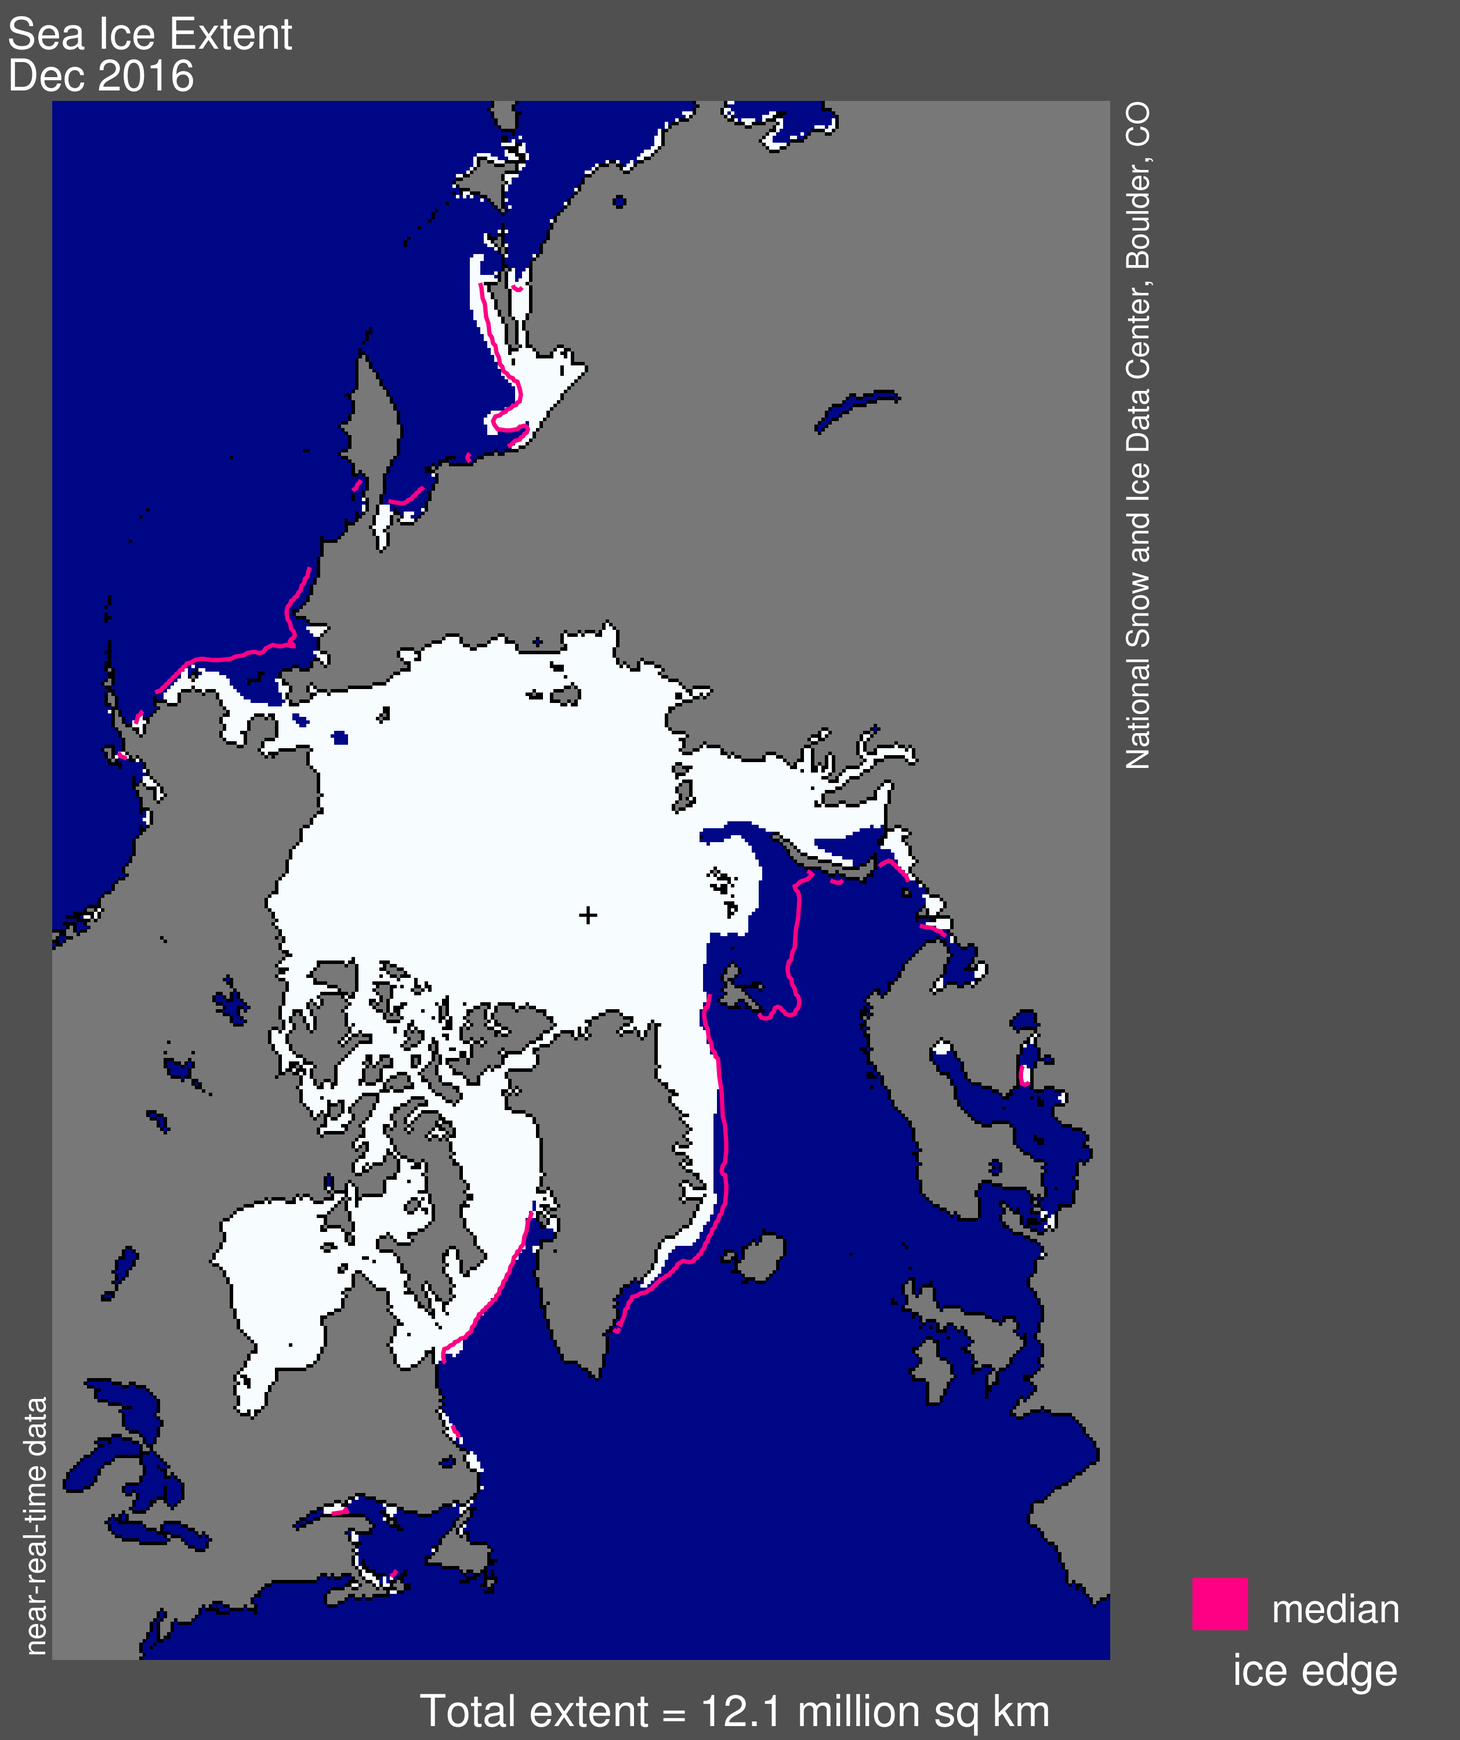
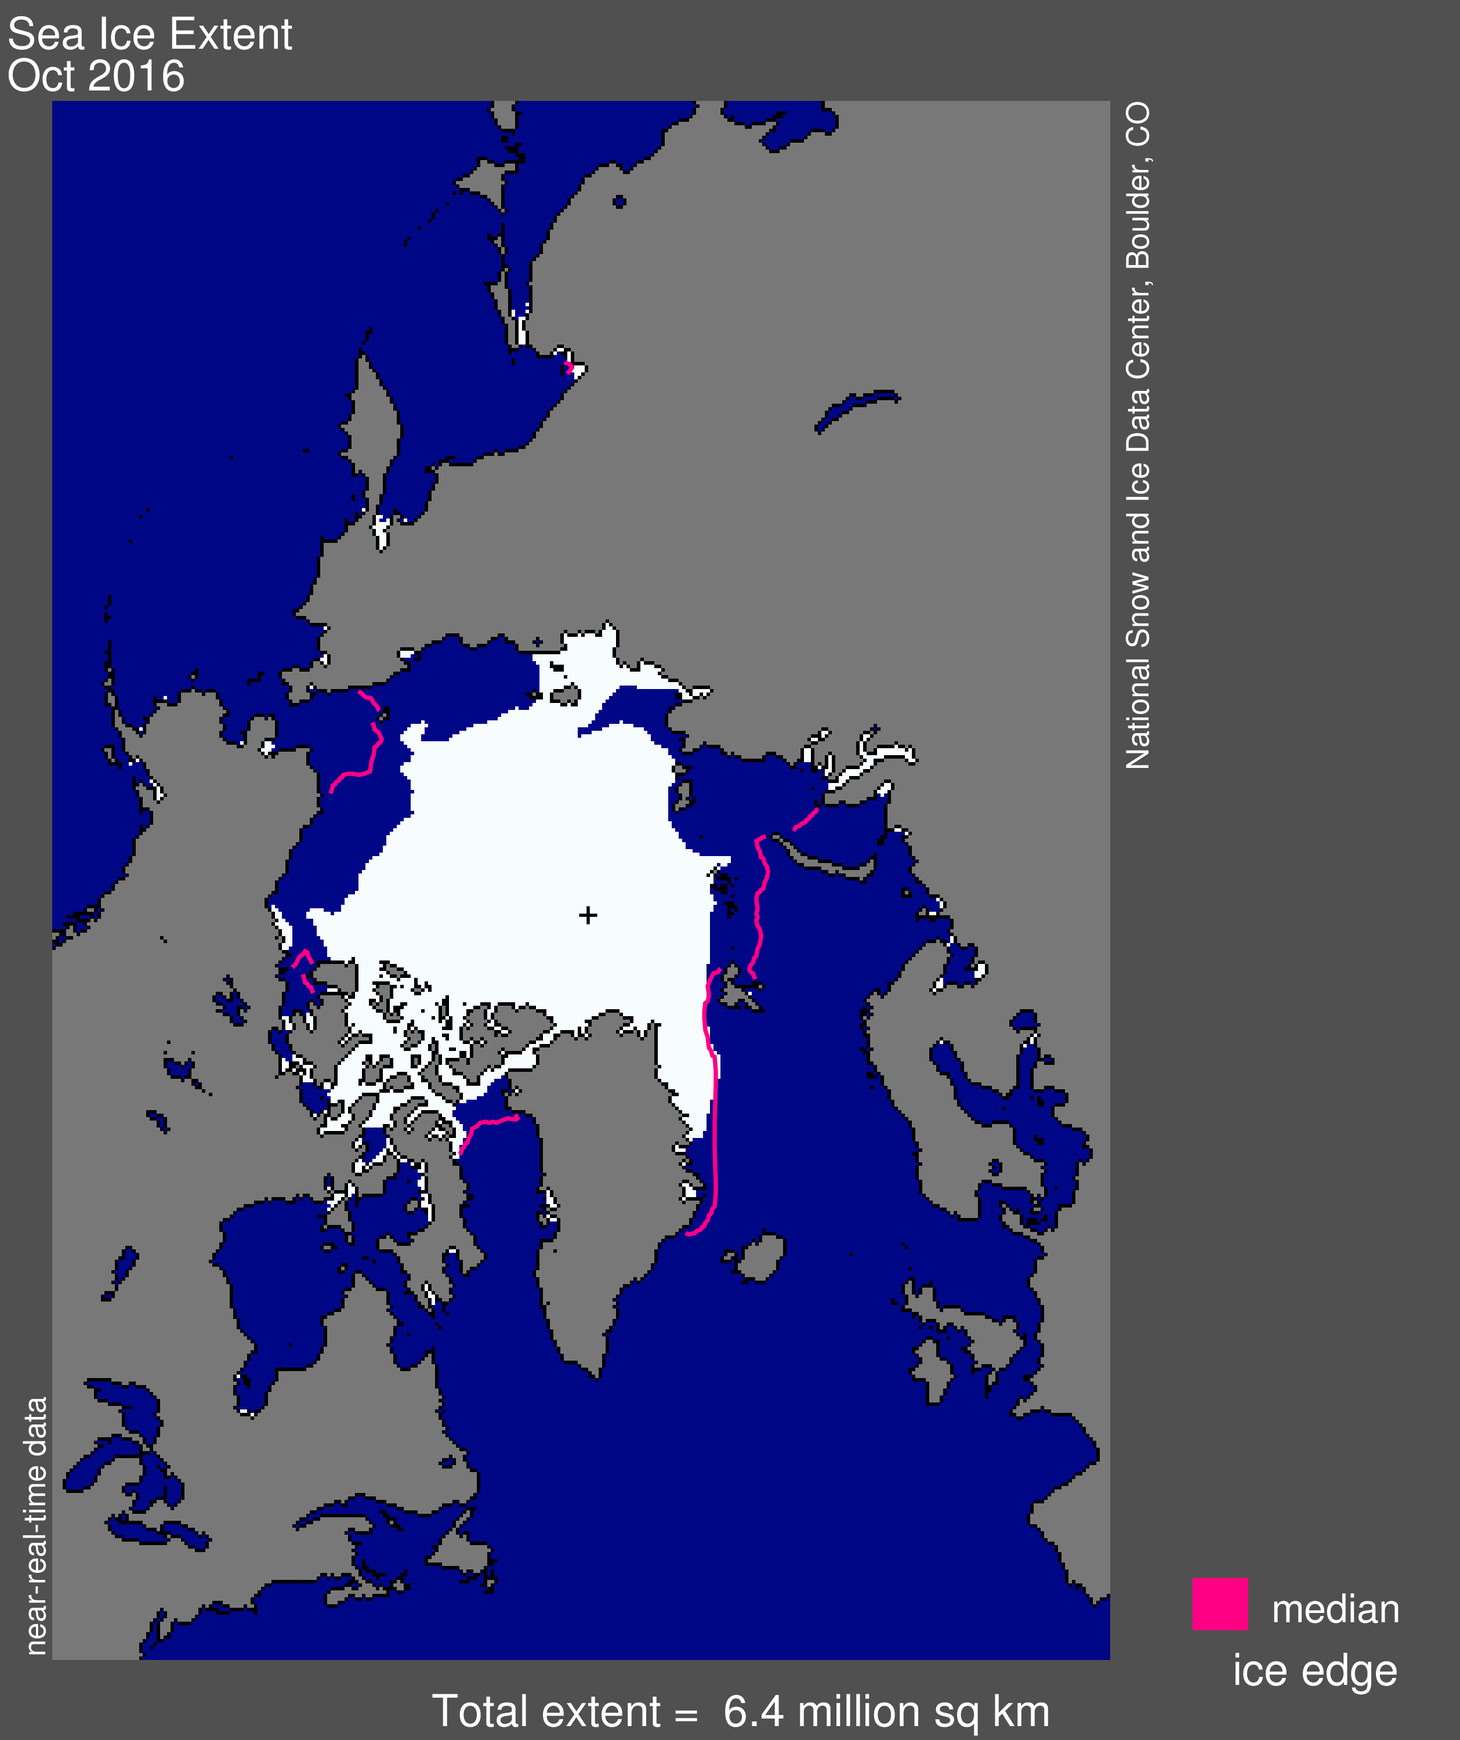
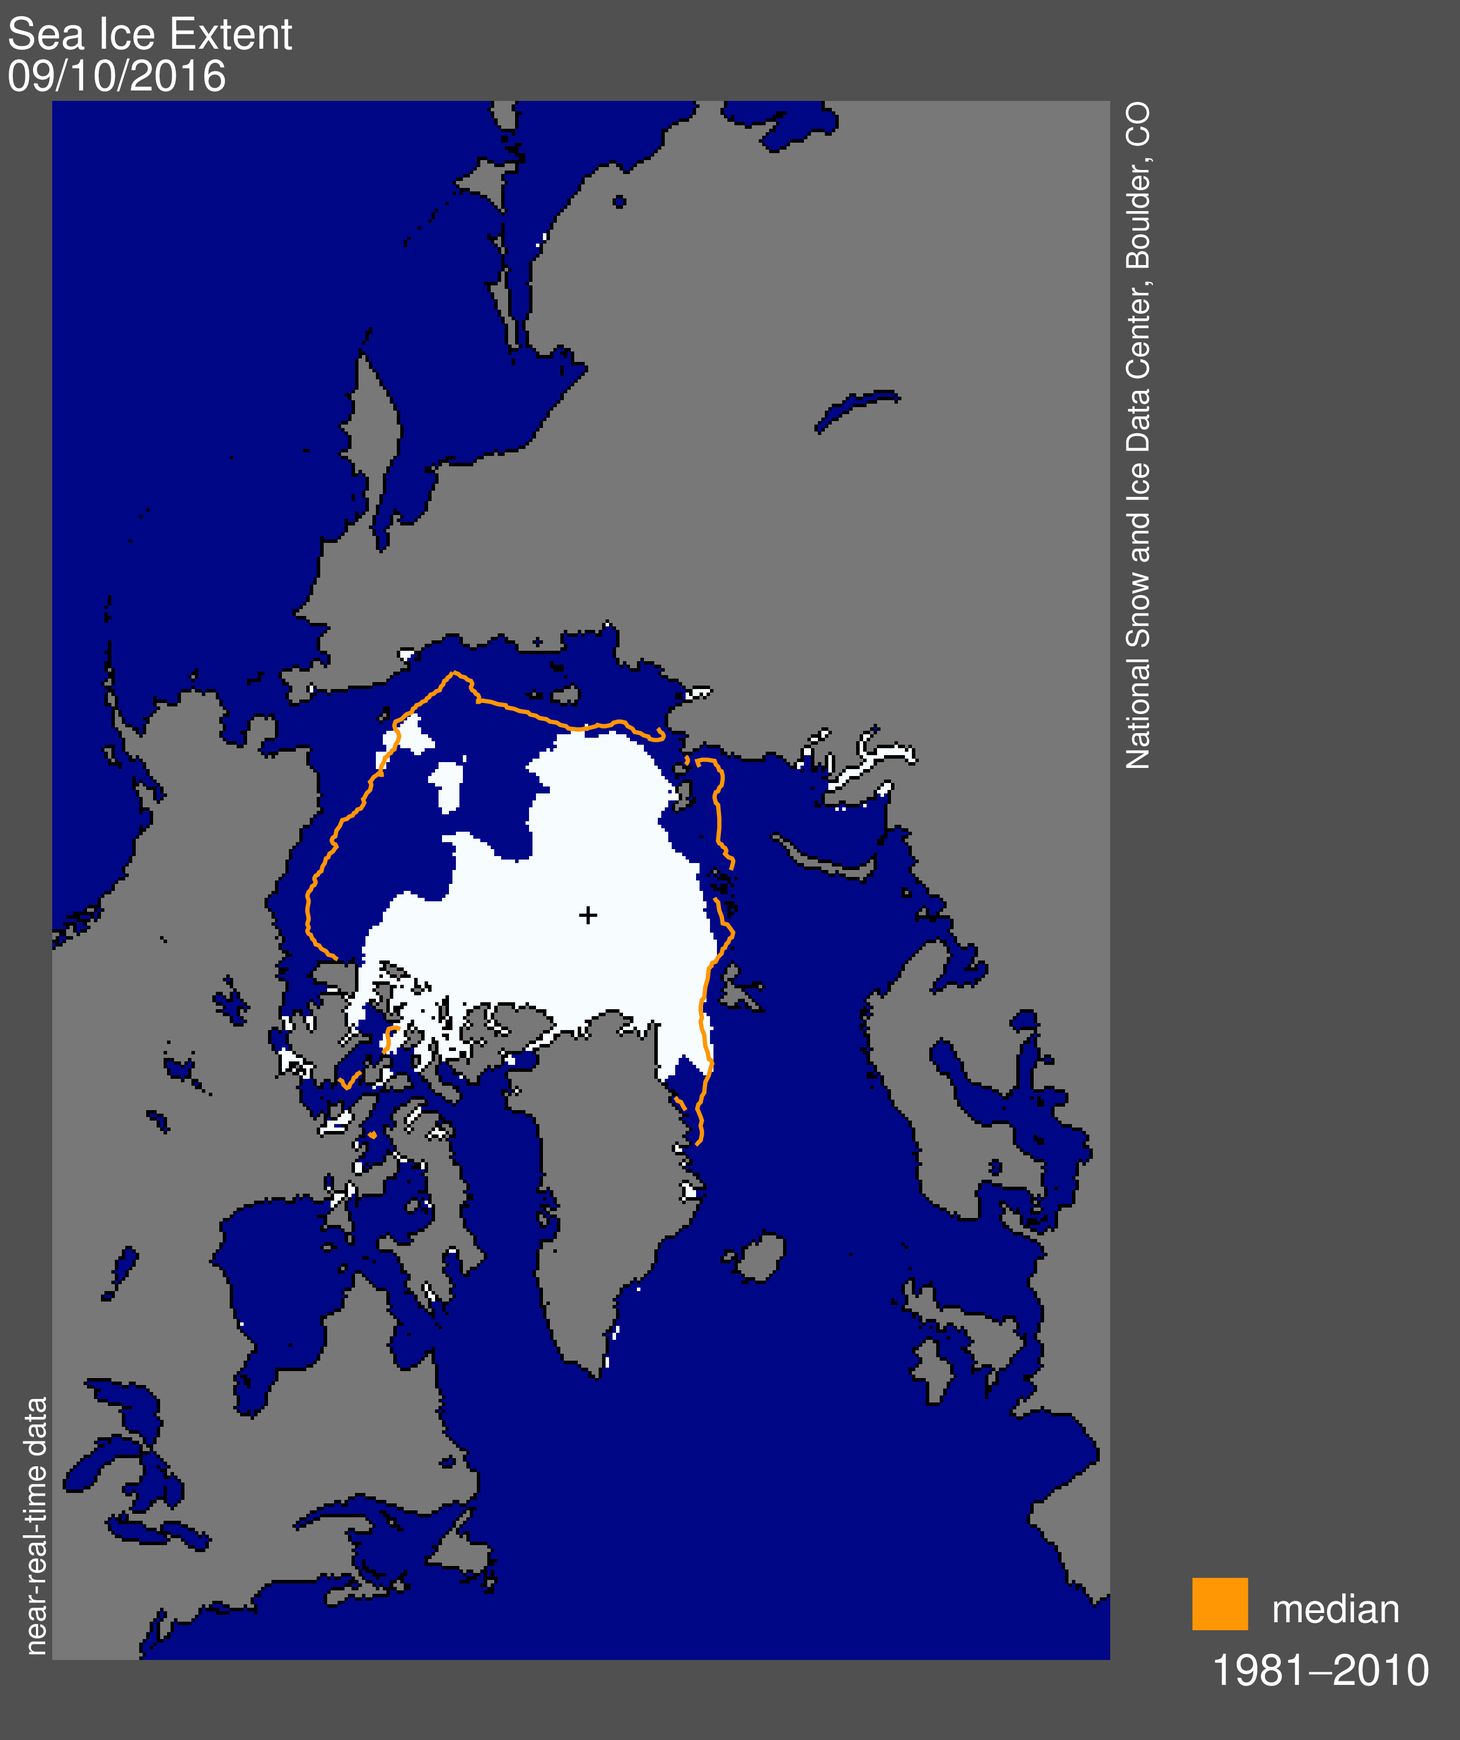
Figure 1. Arctic sea ice extent for September 13, 2017 was 4.64 million square kilometers (1.79 million square miles), the eighth lowest in the satellite record. The orange line shows the 1981 to 2010 average extent for that day. Sea Ice Index data. About the data
Credit: National Snow and Ice Data Center
High-resolution image
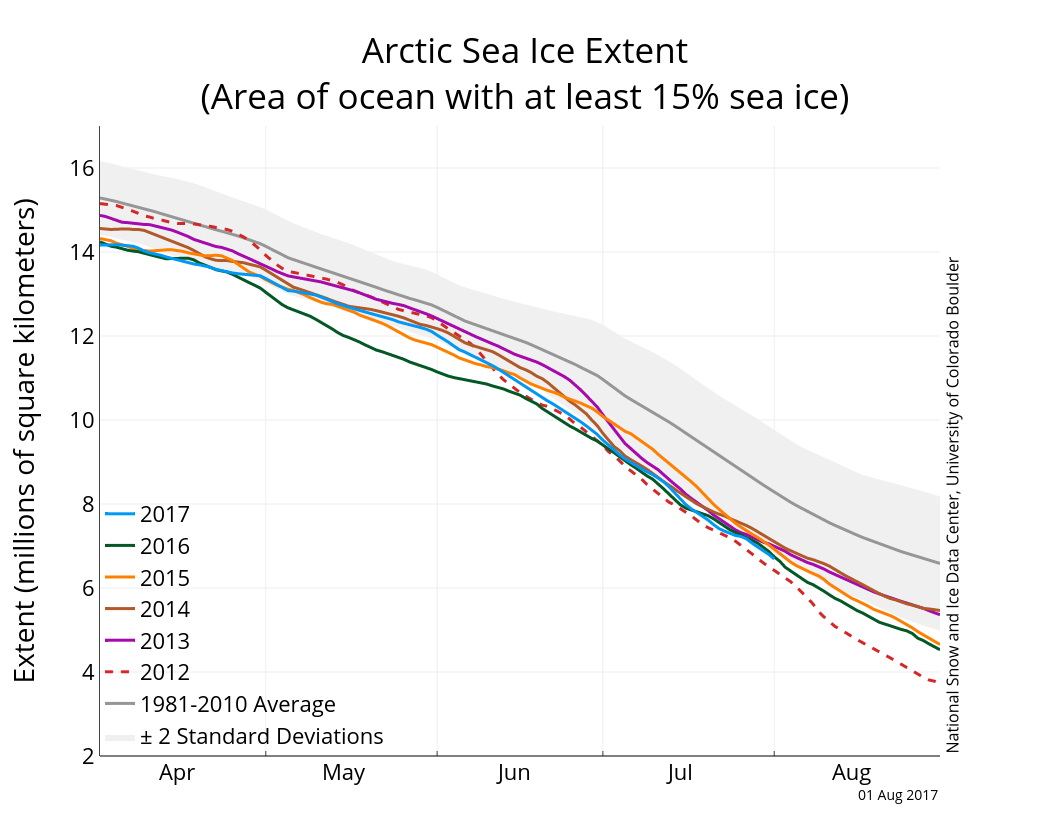
On September 13, 2017, sea ice extent reached an annual minimum of 4.64 million square kilometers (1.79 million square miles). This was 1.58 million square kilometers (610,000 square miles) below the 1981 to 2010 median extent for the same day, and 1.25 million square kilometers (483,000 square miles) and 500,000 square kilometers (193,000 square miles) above the 2012 and 2016 extents for the same day, respectively.
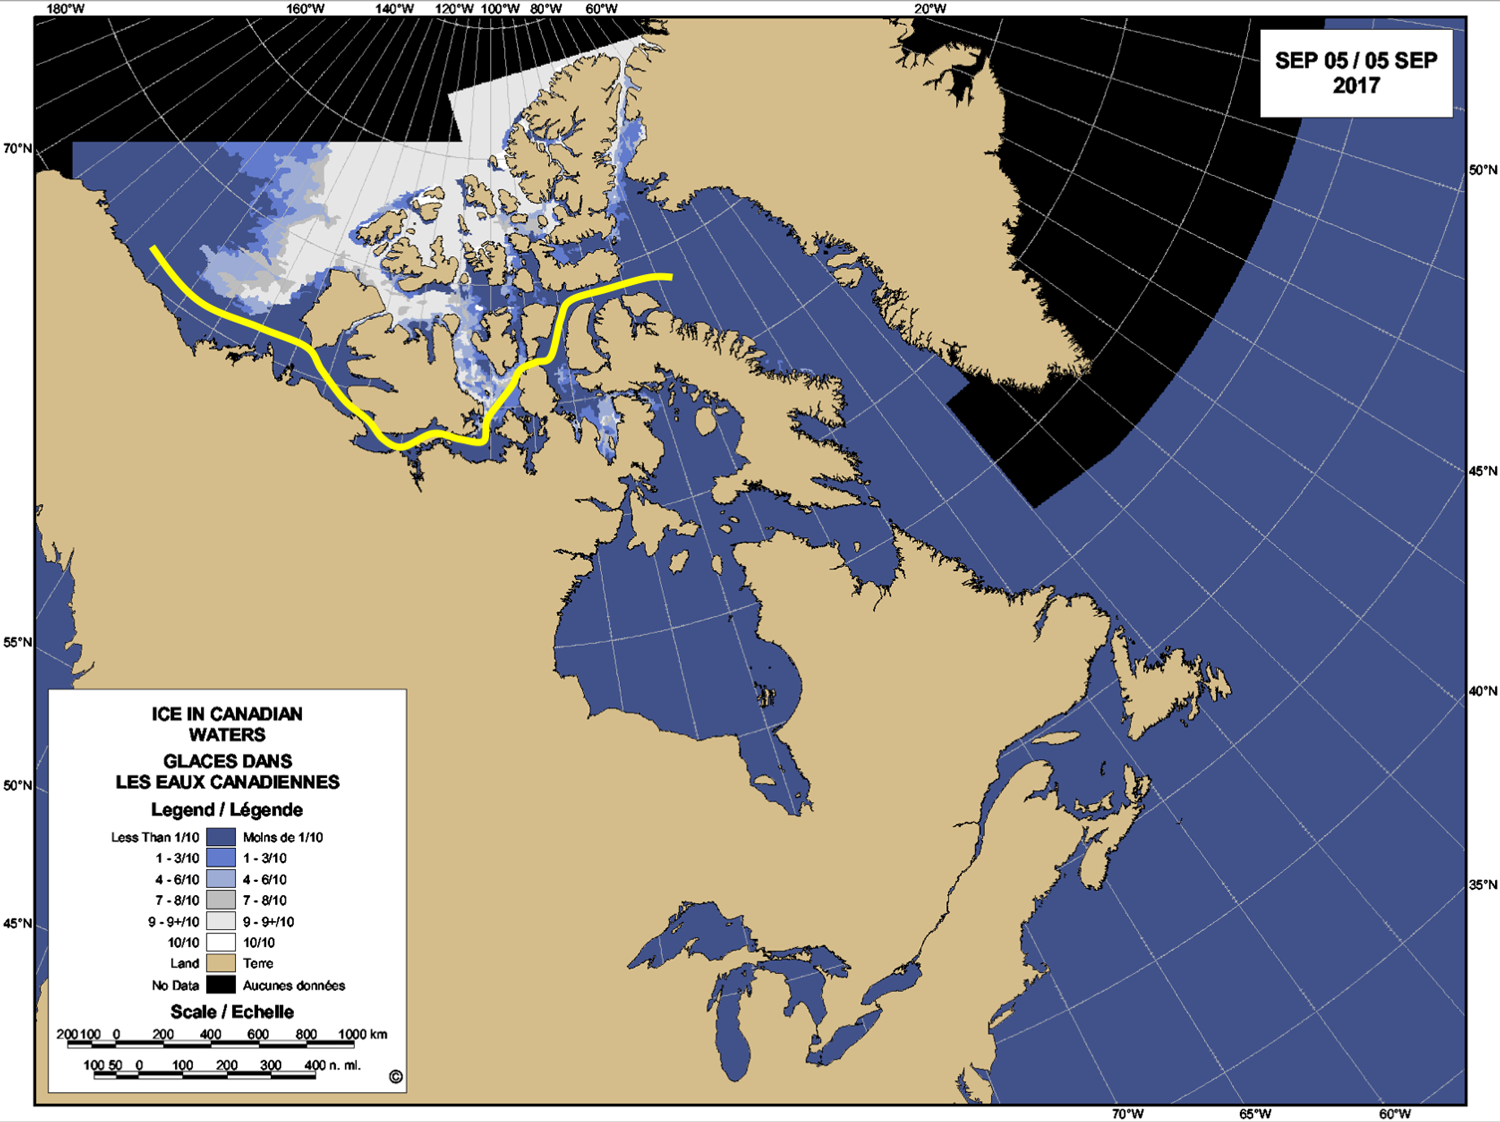
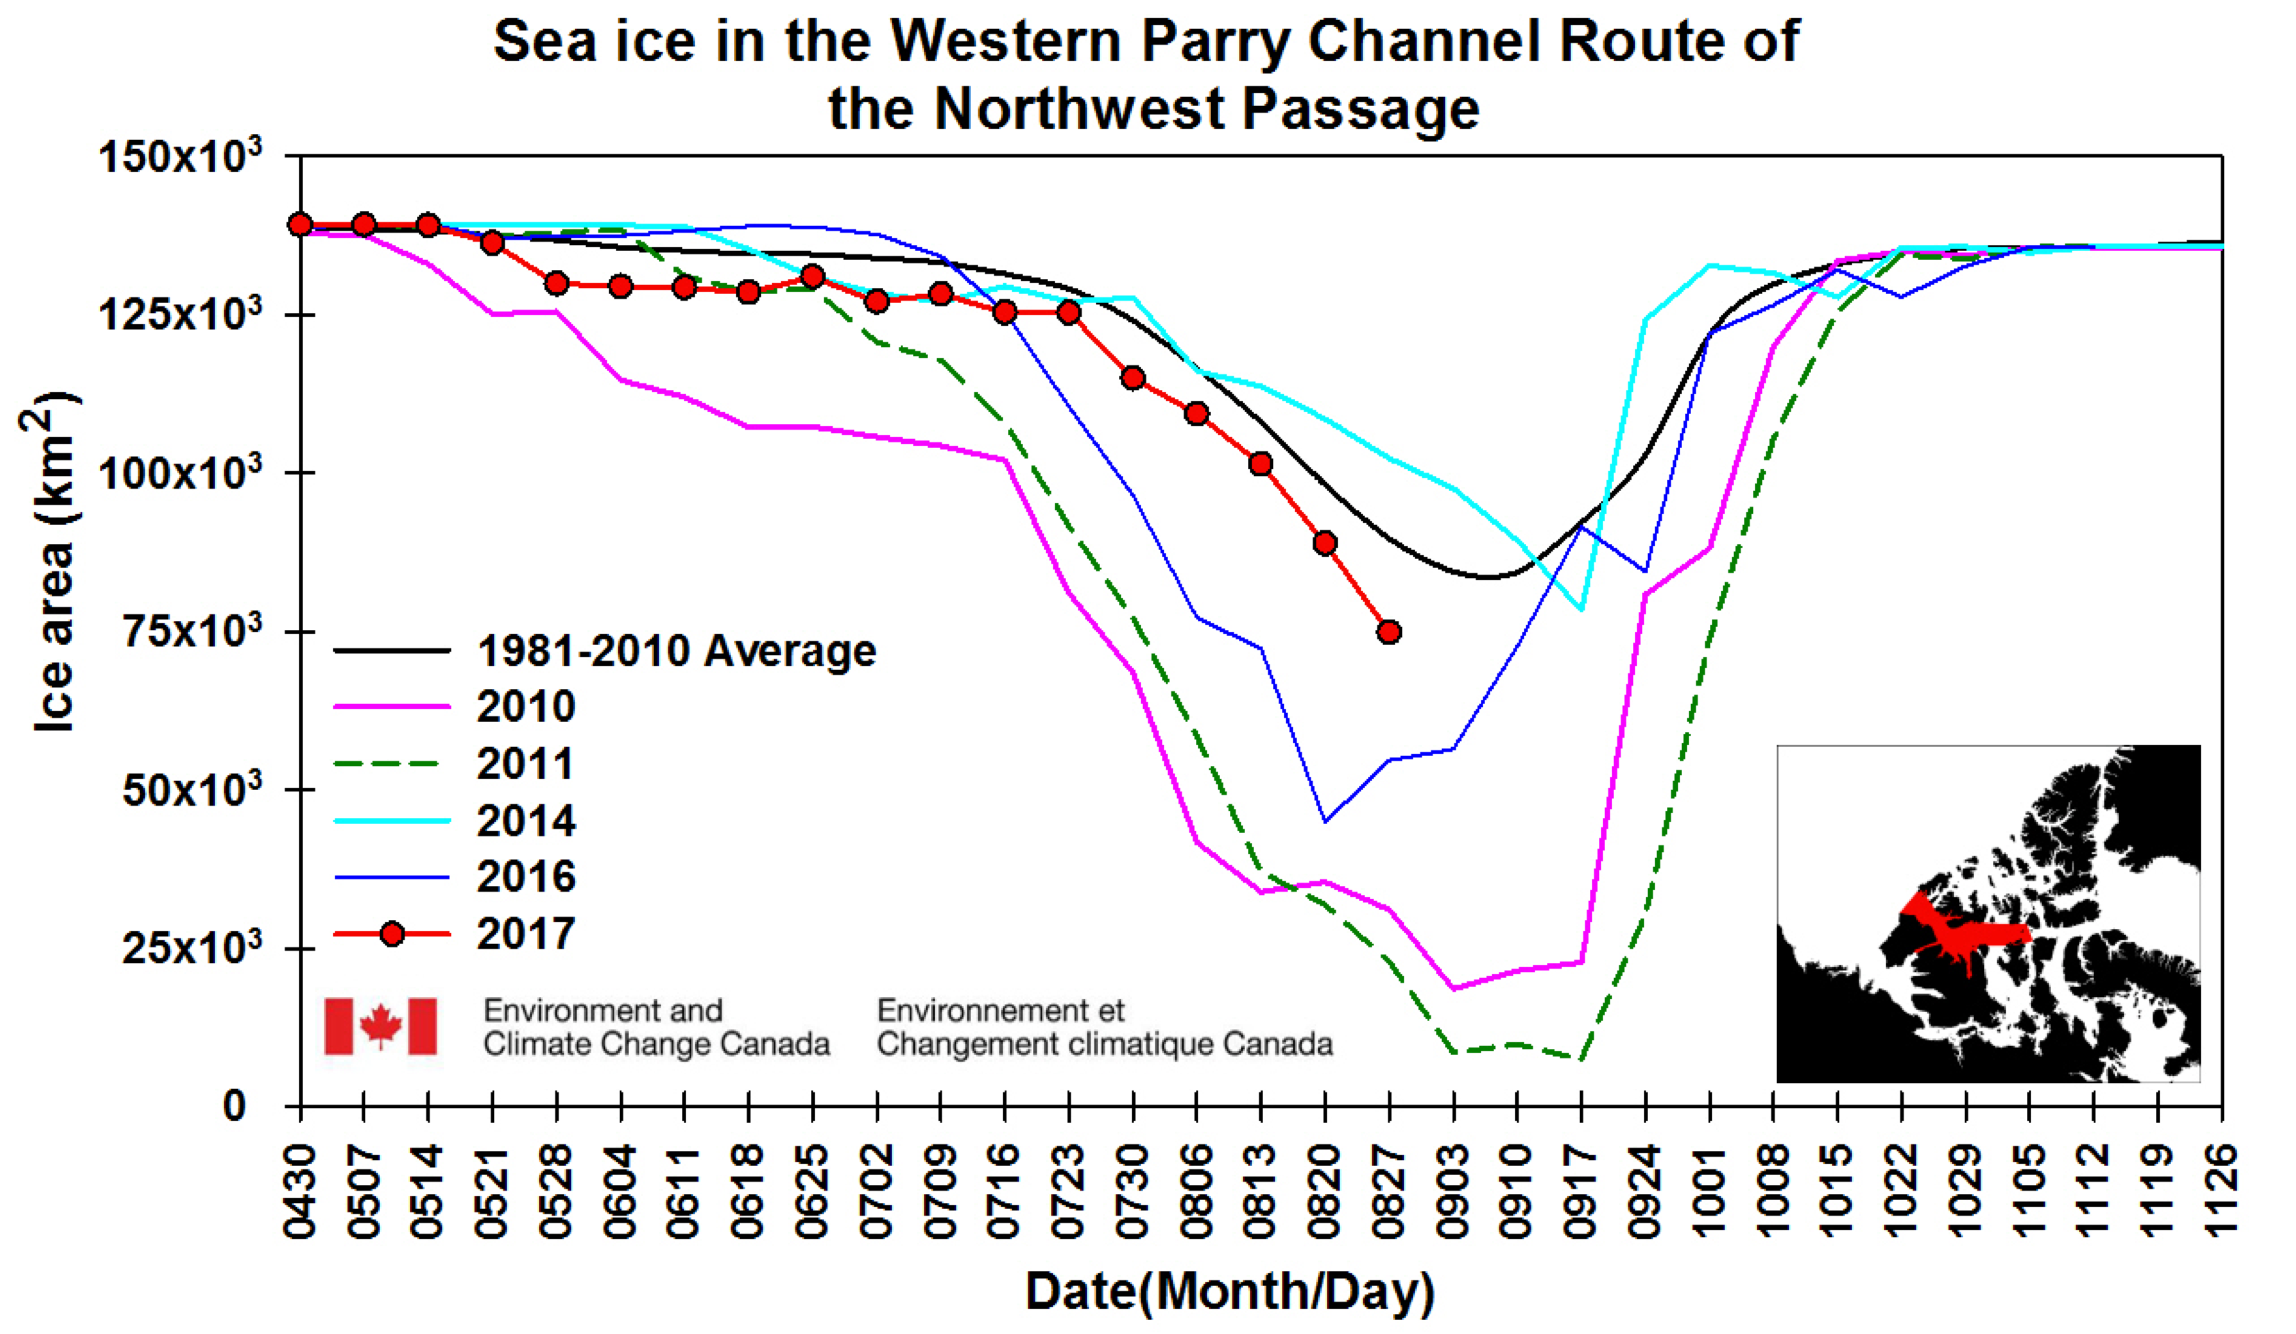
During the first two weeks of September, the ice edge continued to retreat in the Chukchi, East Siberian, and Kara Seas, whereas it slightly expanded in the Beaufort and Laptev Seas. The ice edge remains far to the north of its average position in the Chukchi Sea. The Northern Sea Route is largely open; Amundsen’s Northwest Passage (the southern route) has up to 50 percent ice cover in some places, though as noted in our last post, ships have successfully navigated through the southern route with icebreaker assistance. The northern Northwest Passage route, entered from the west via McClure Strait, remains choked by consolidated, thick, multi-year ice.
Conditions in context
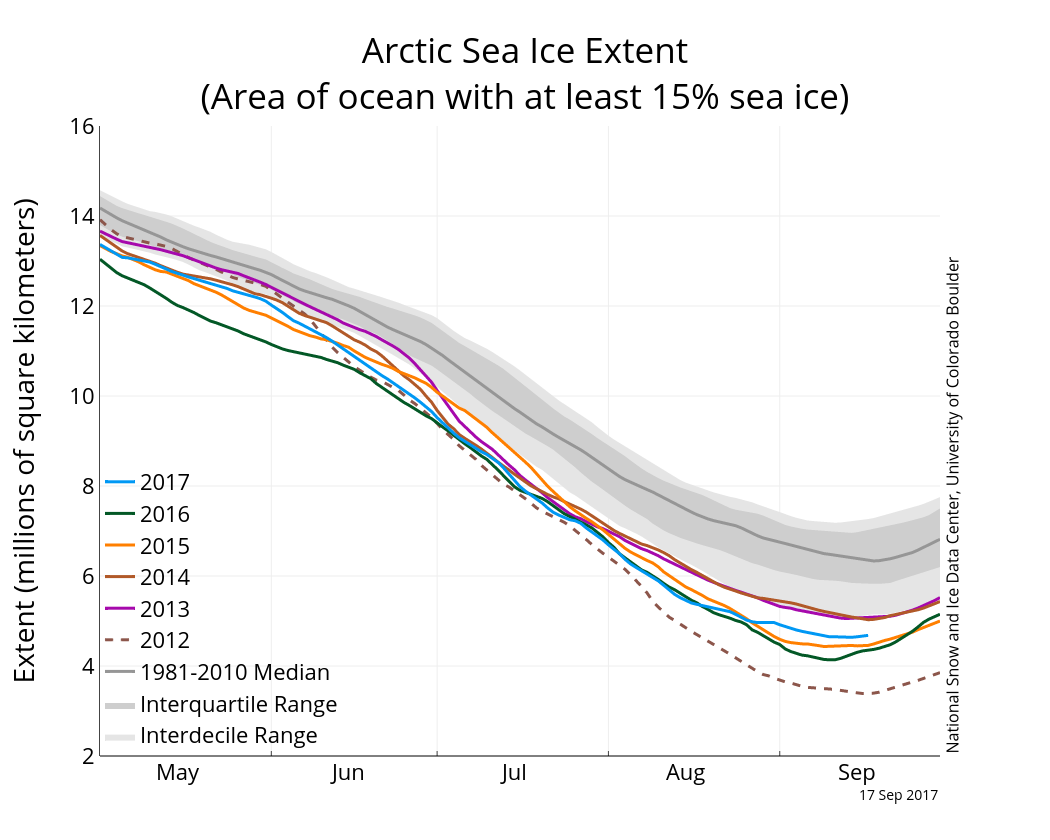
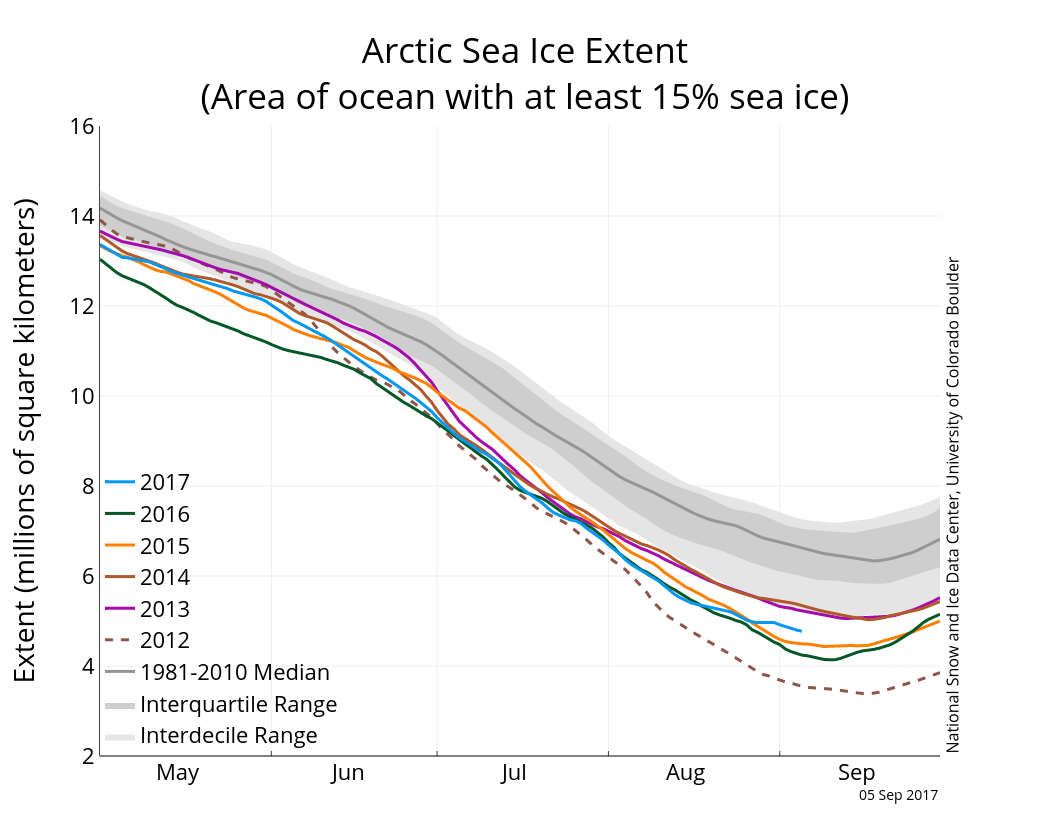
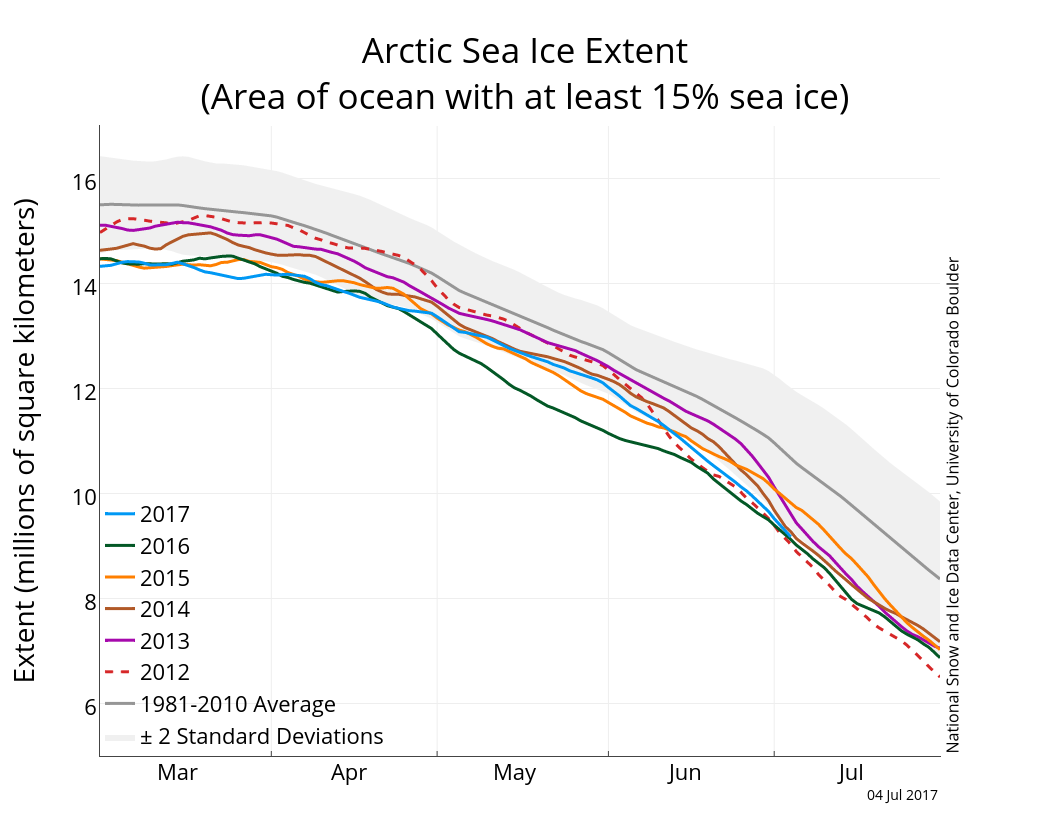
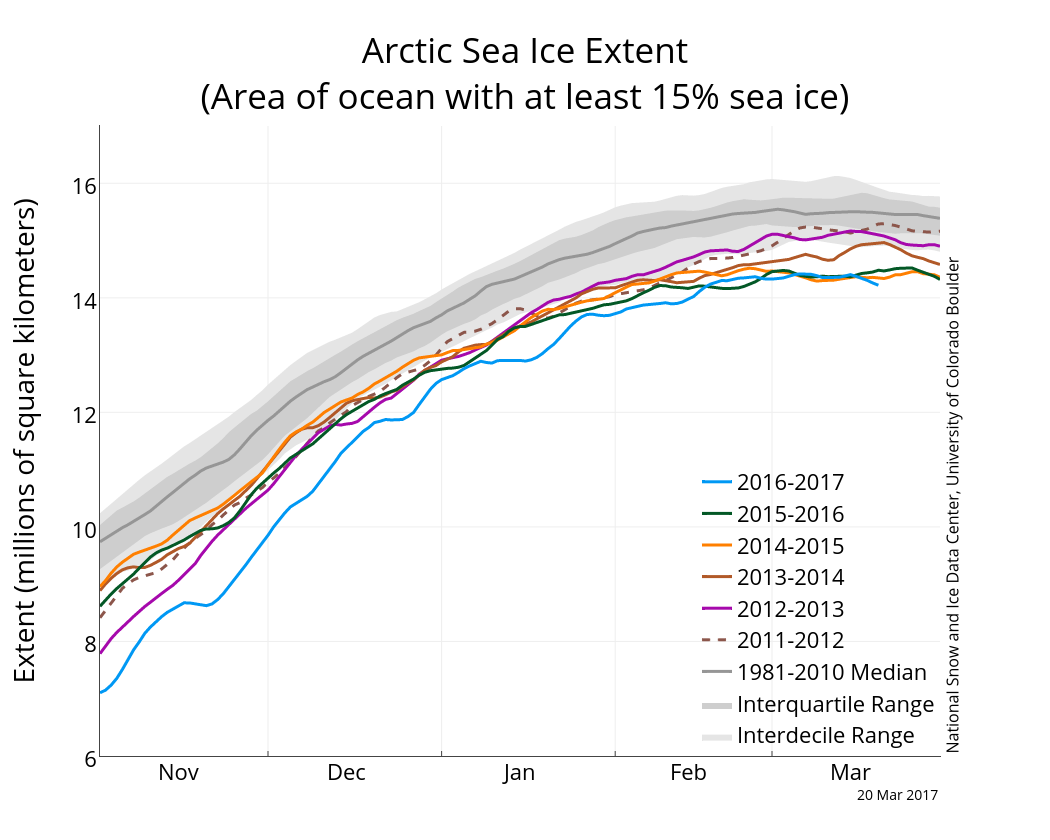
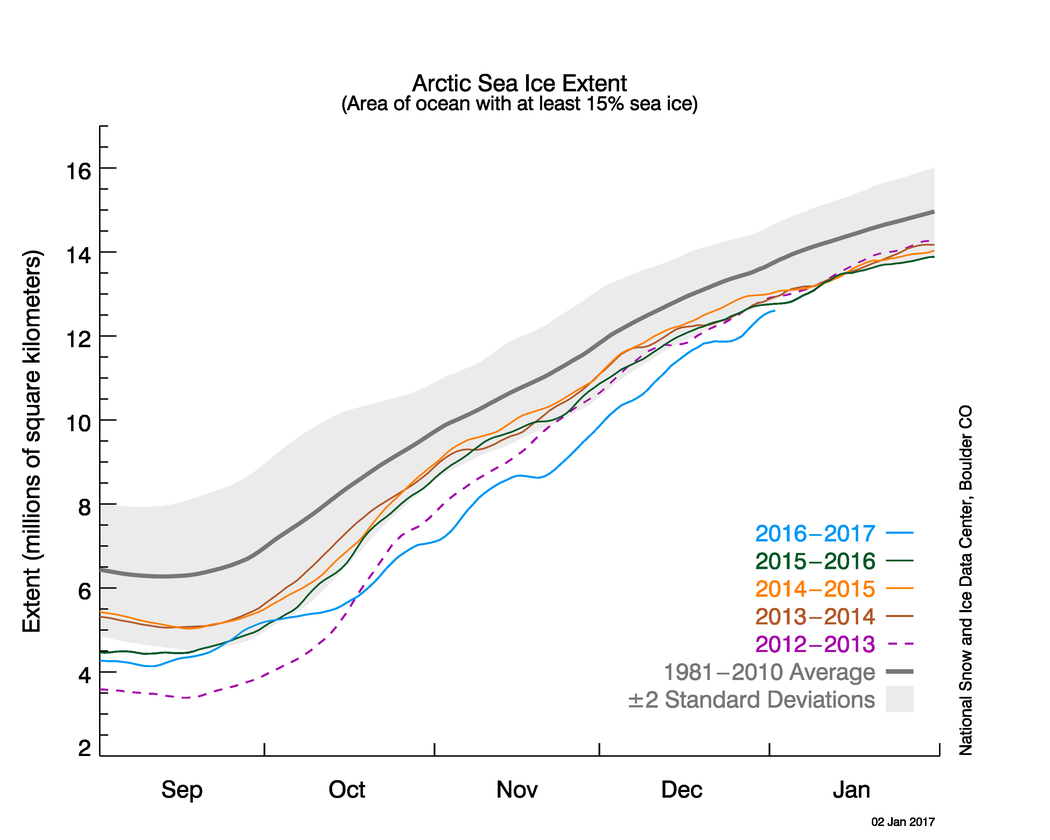
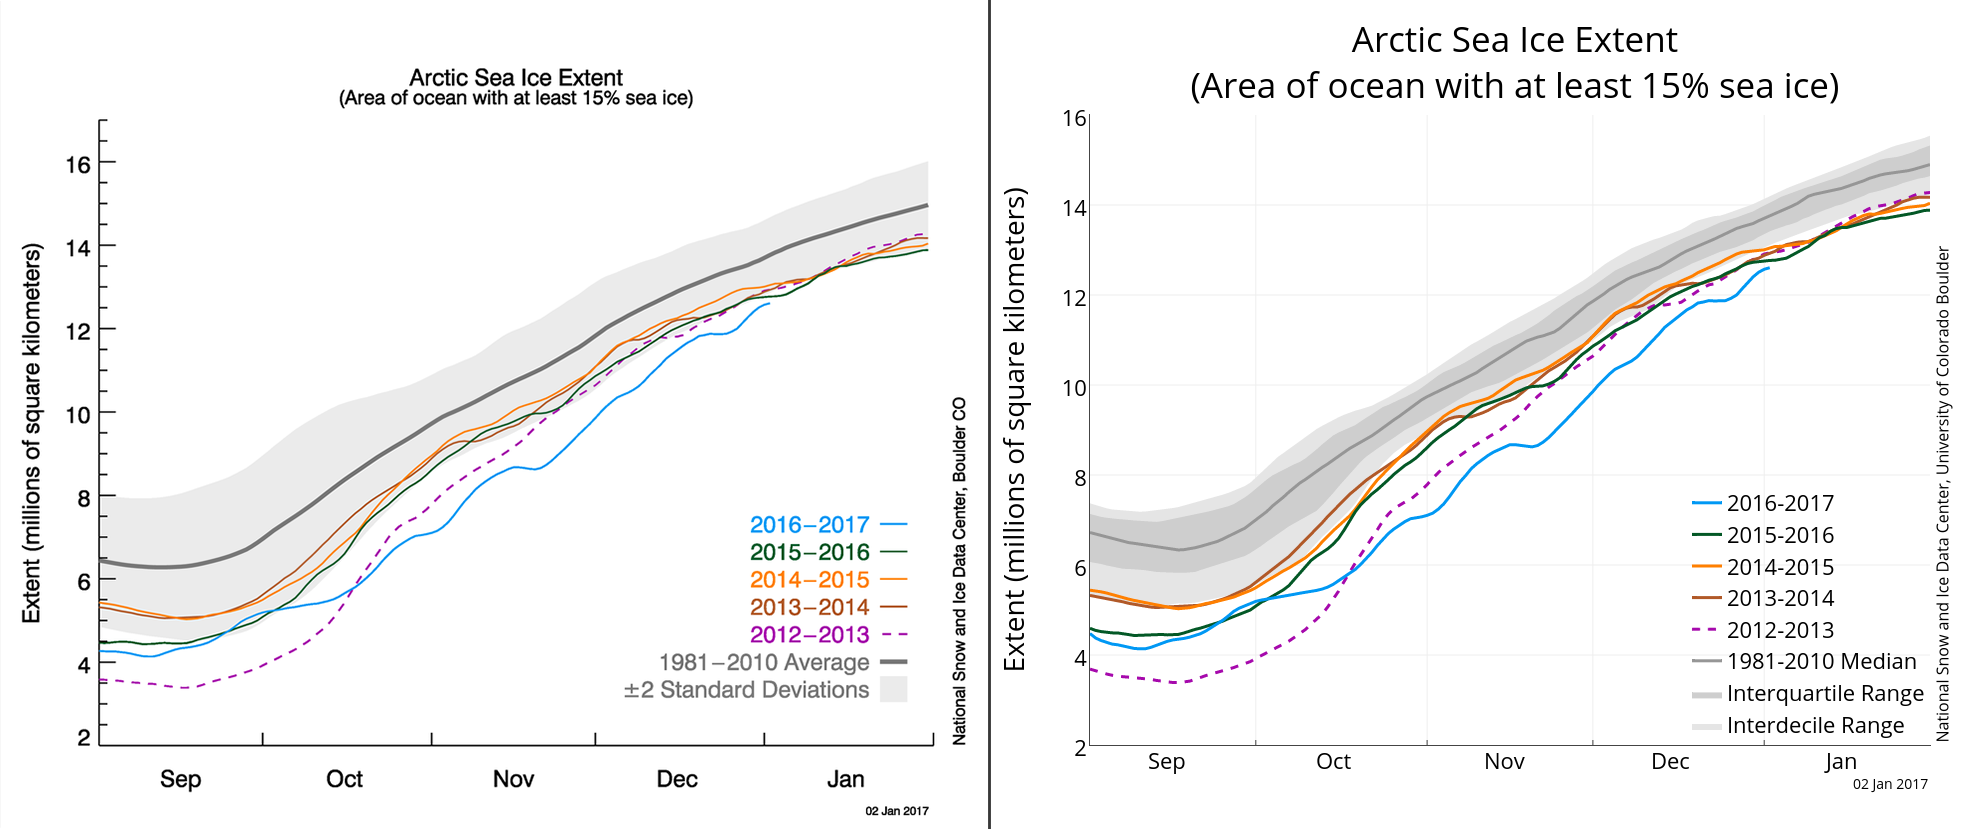
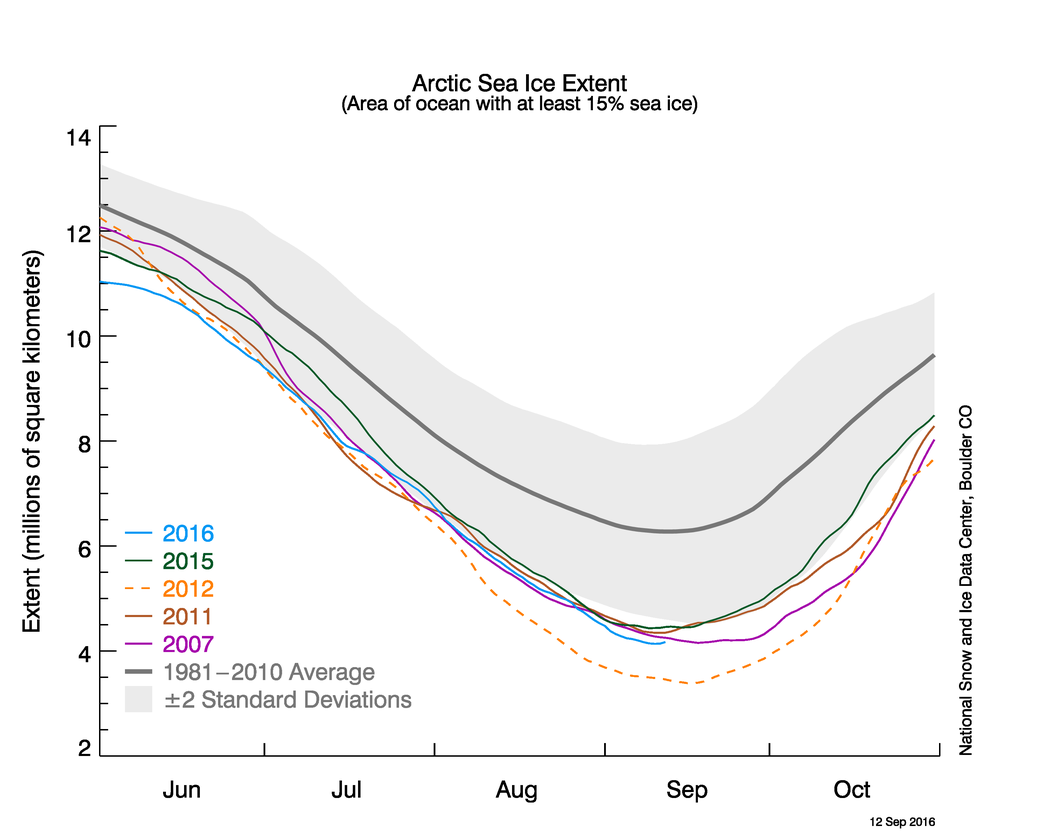
Figure 2a. The graph above shows Arctic sea ice extent as of September 17, 2017, along with daily ice extent data for five previous years. 2017 is shown in blue, 2016 in green, 2015 in orange, 2014 in brown, 2013 in purple, and 2012 in dashed brown. The 1981 to 2010 median is in dark gray. The gray areas around the median line show the interquartile and interdecile ranges of the data. Sea Ice Index data.
Credit: National Snow and Ice Data Center
High-resolution image
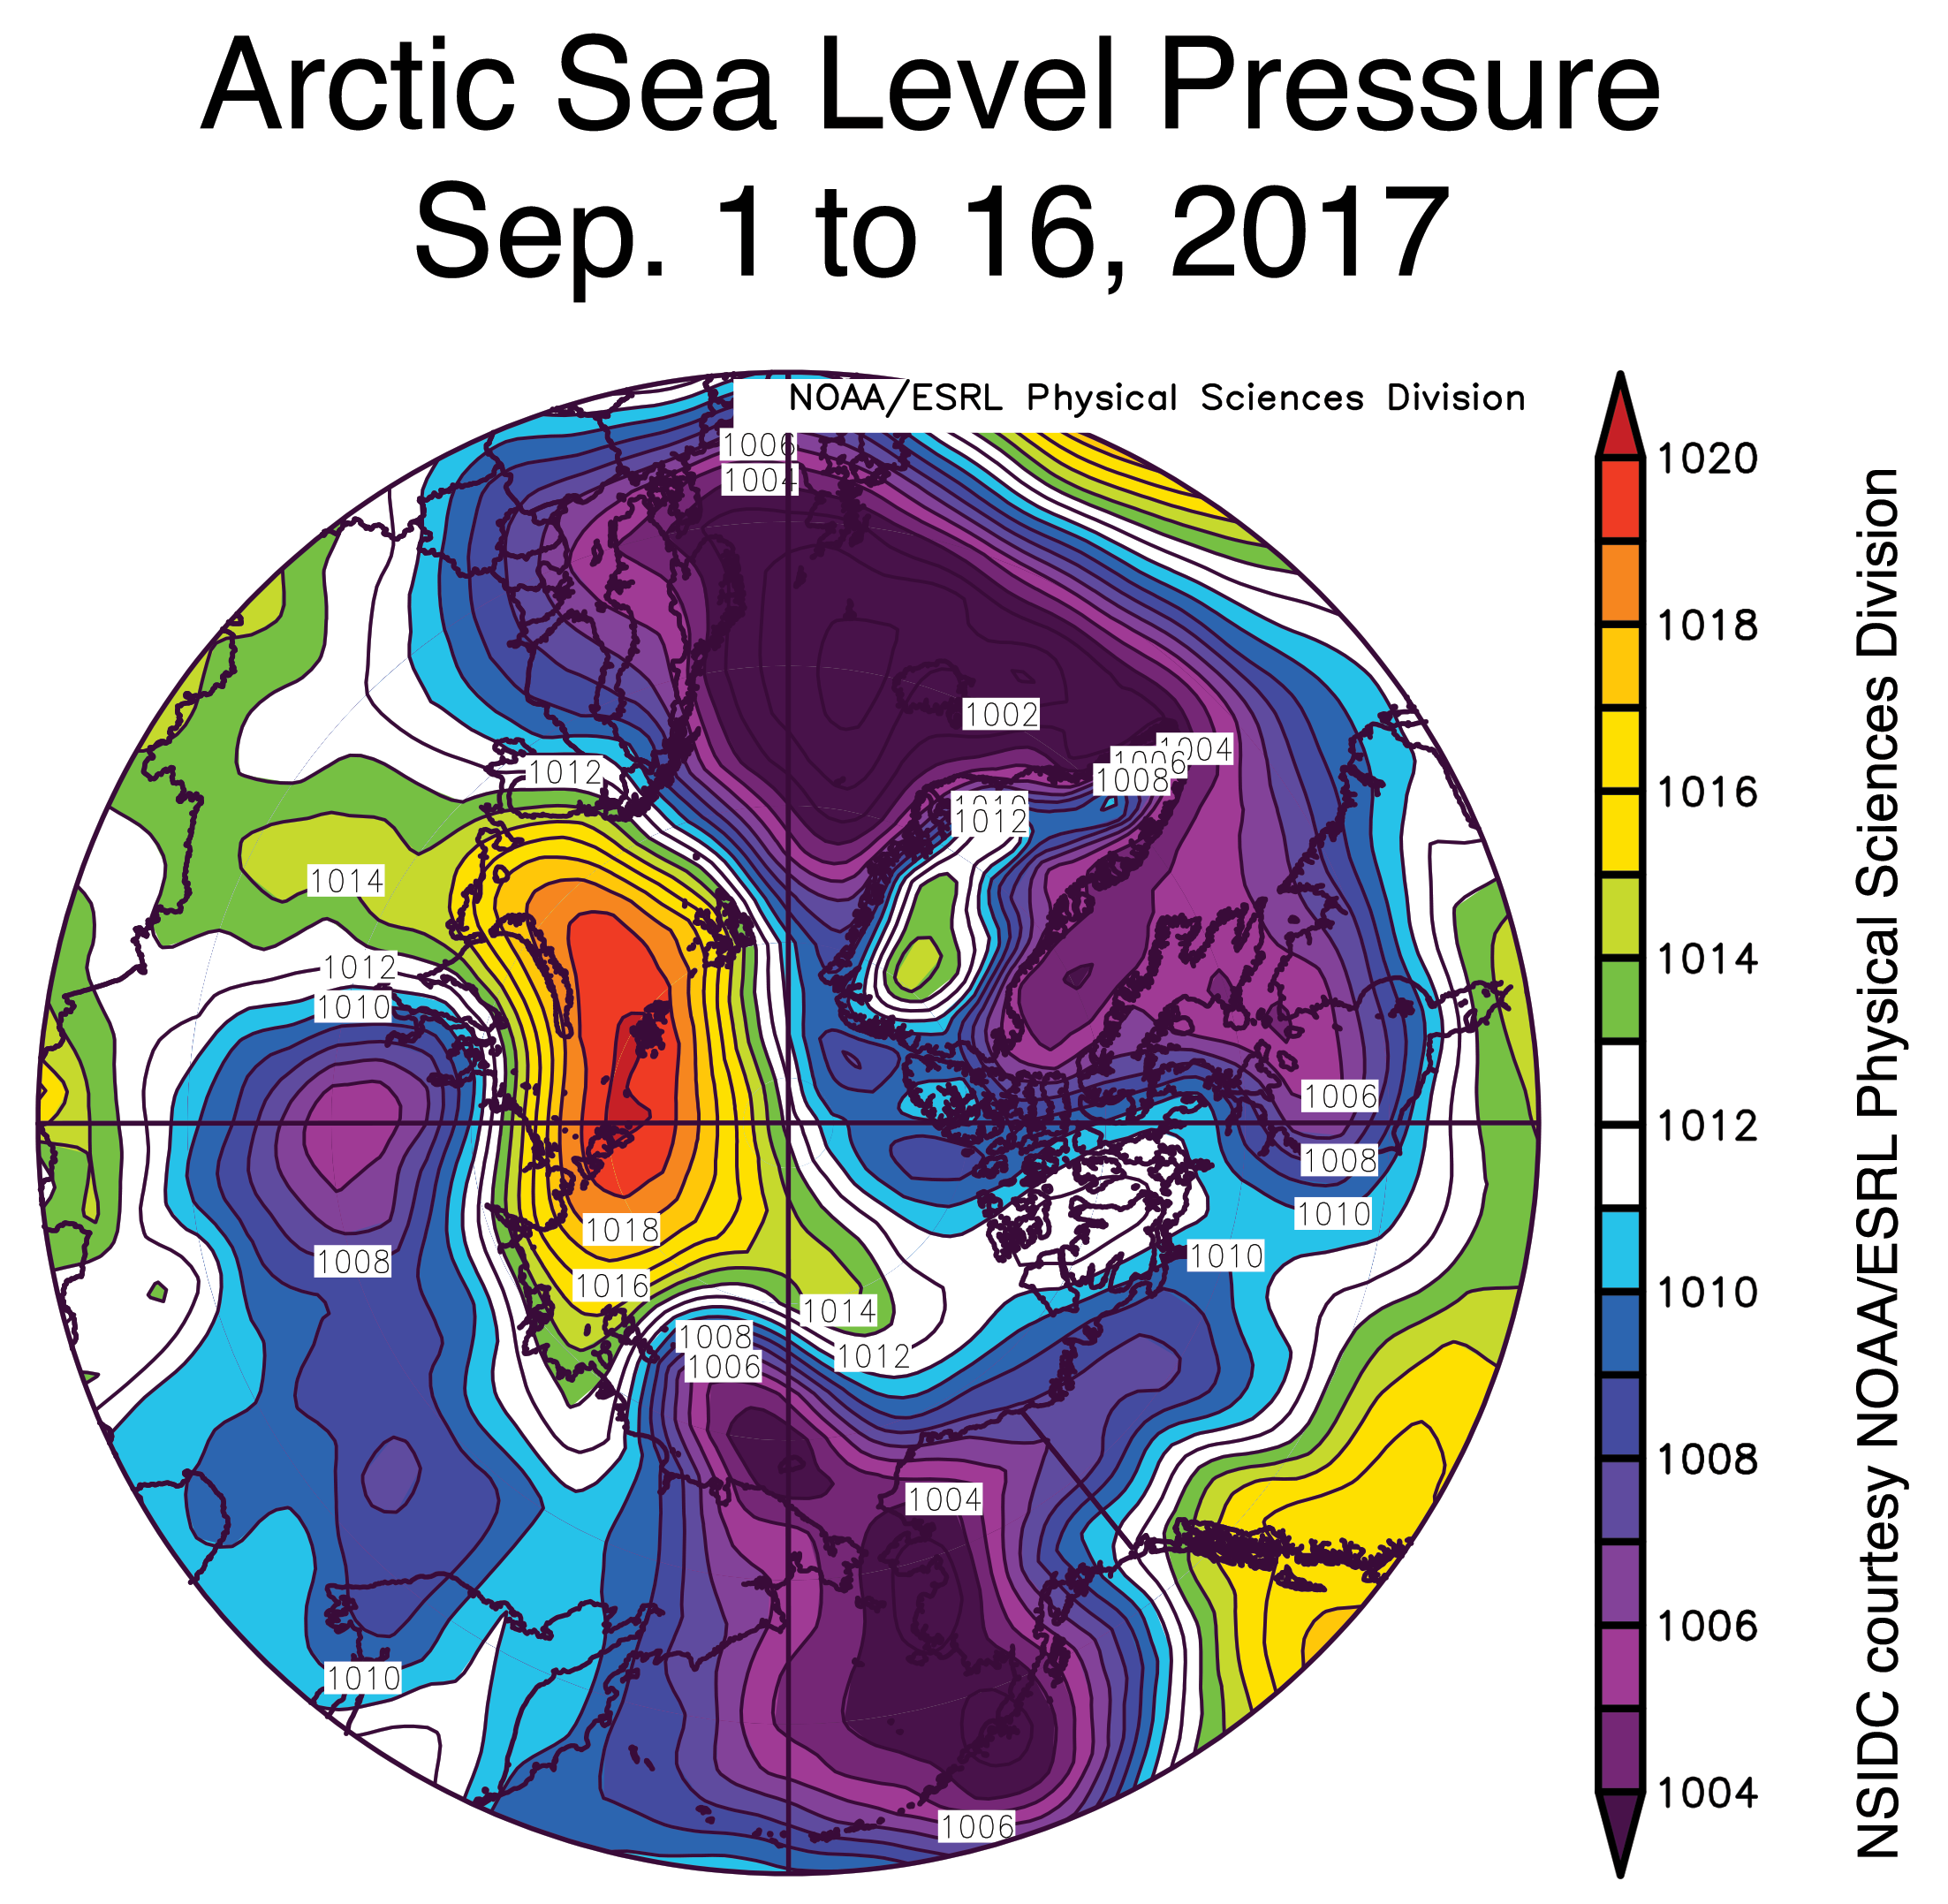
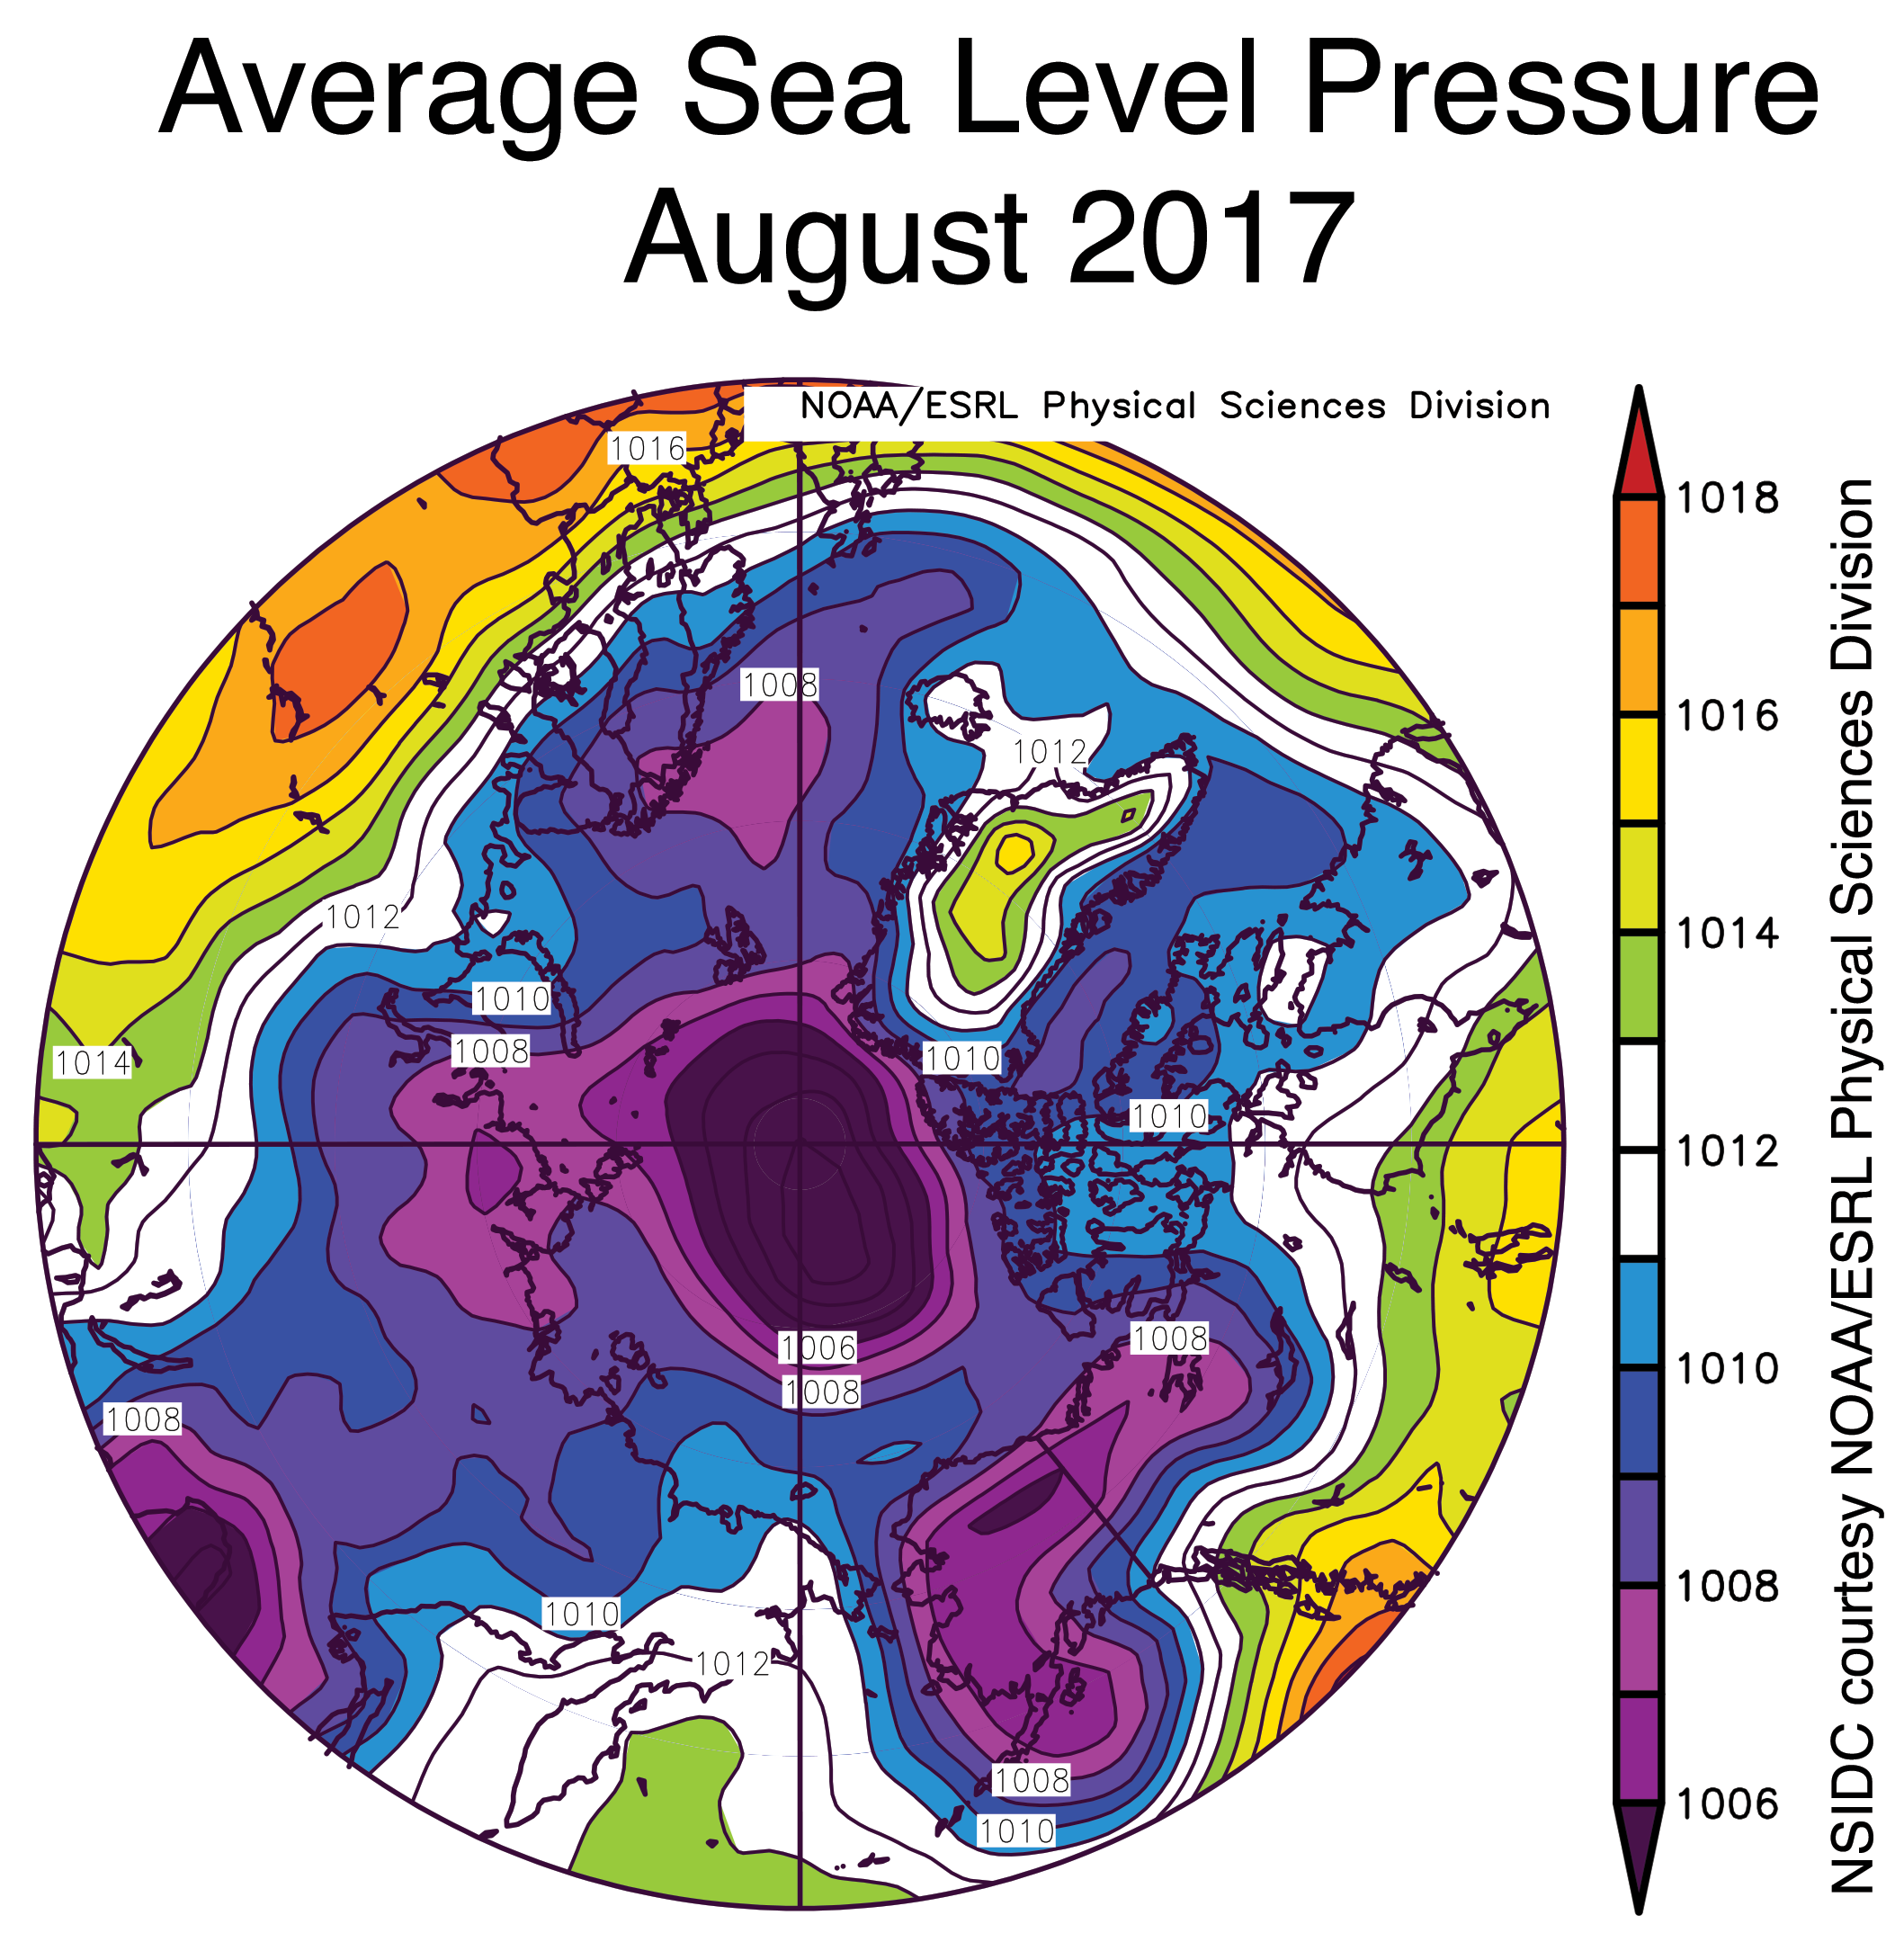
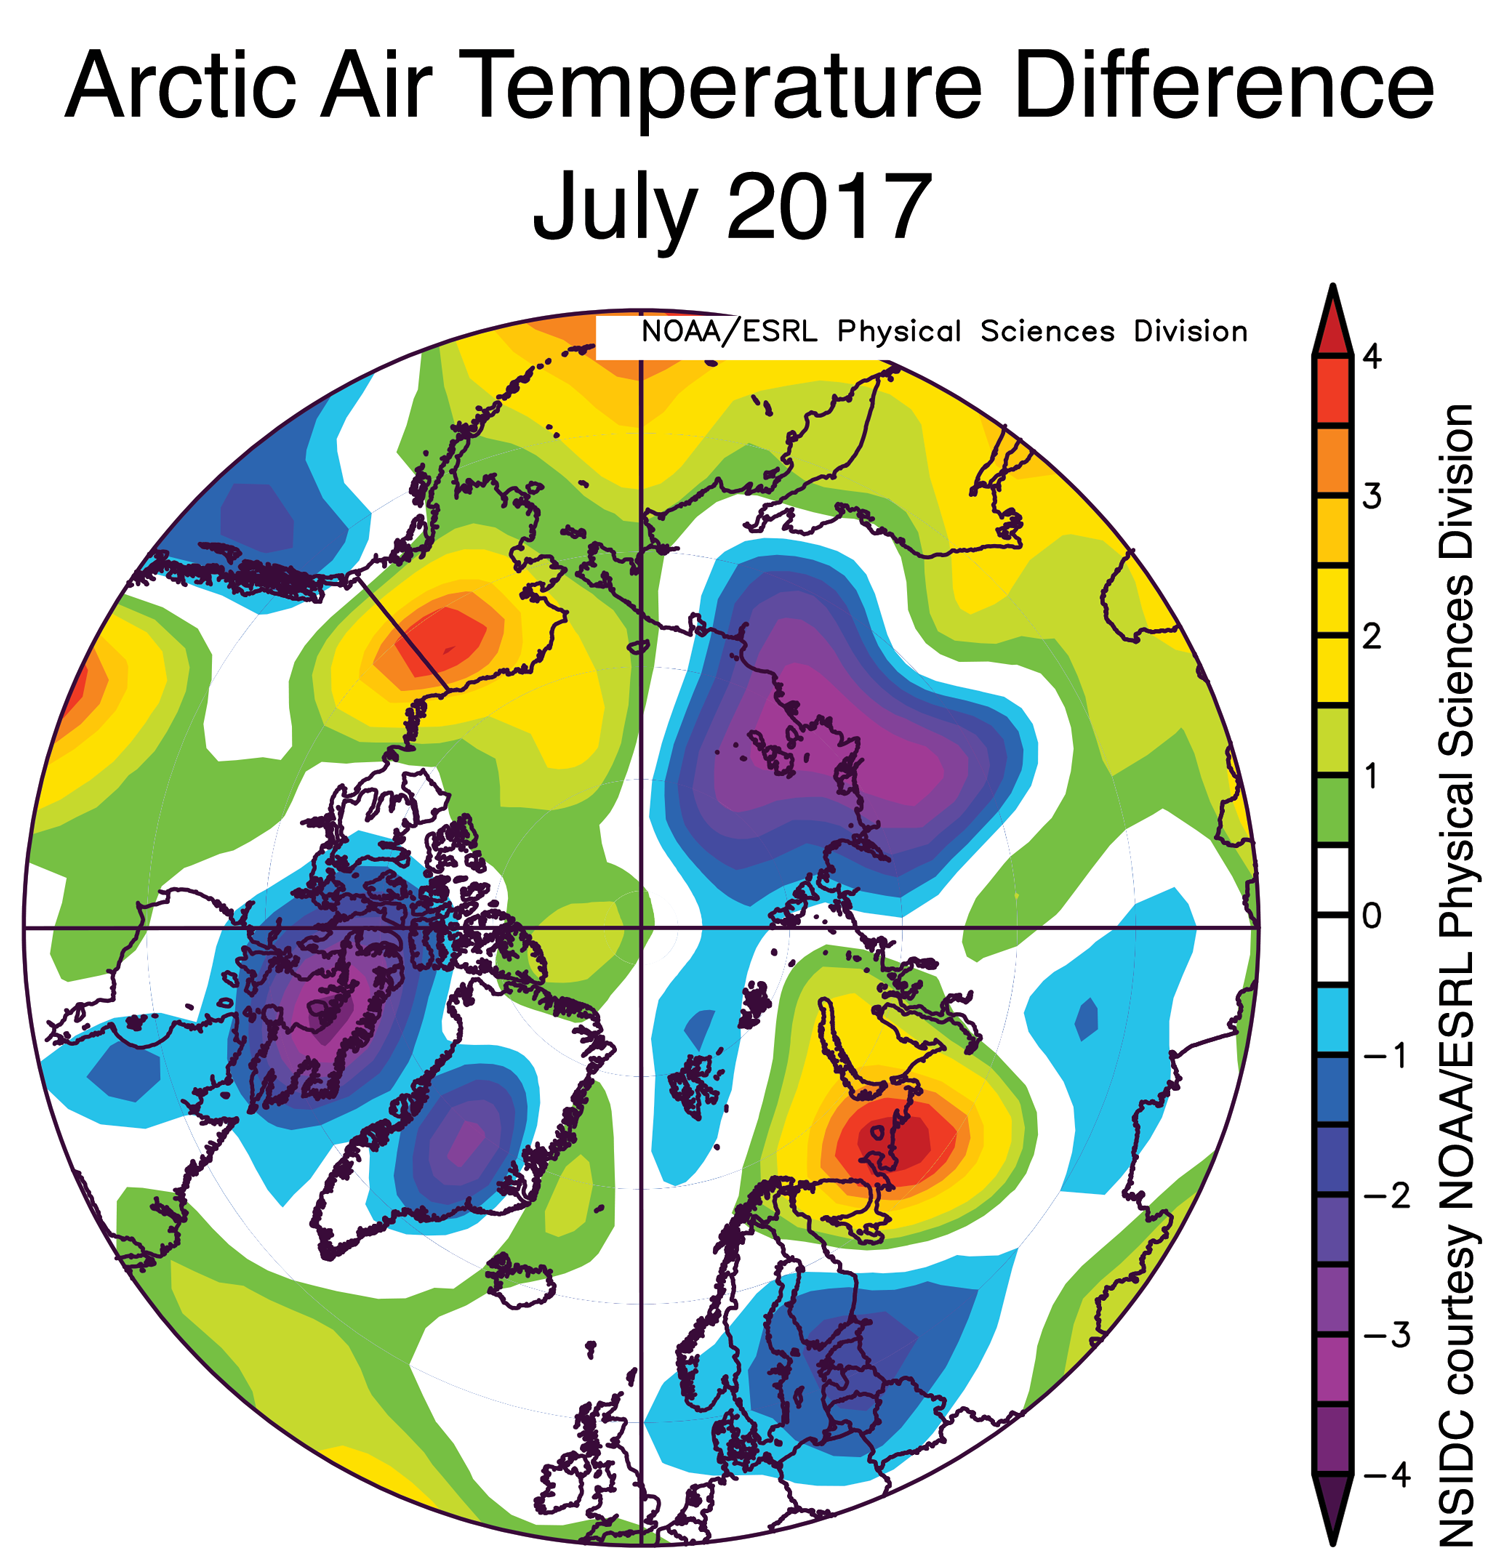
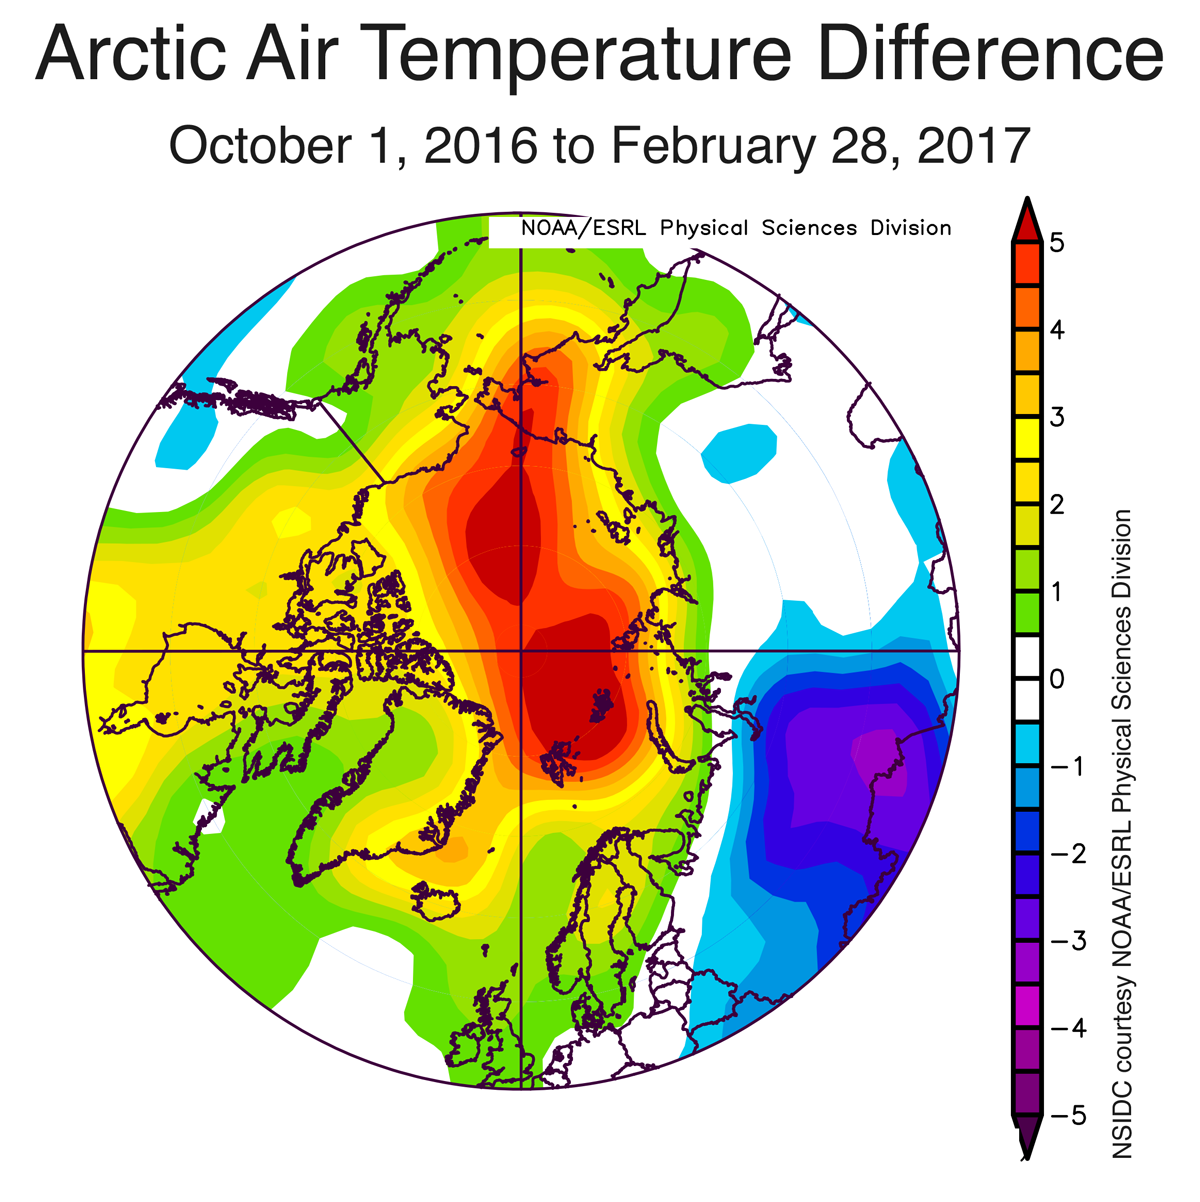
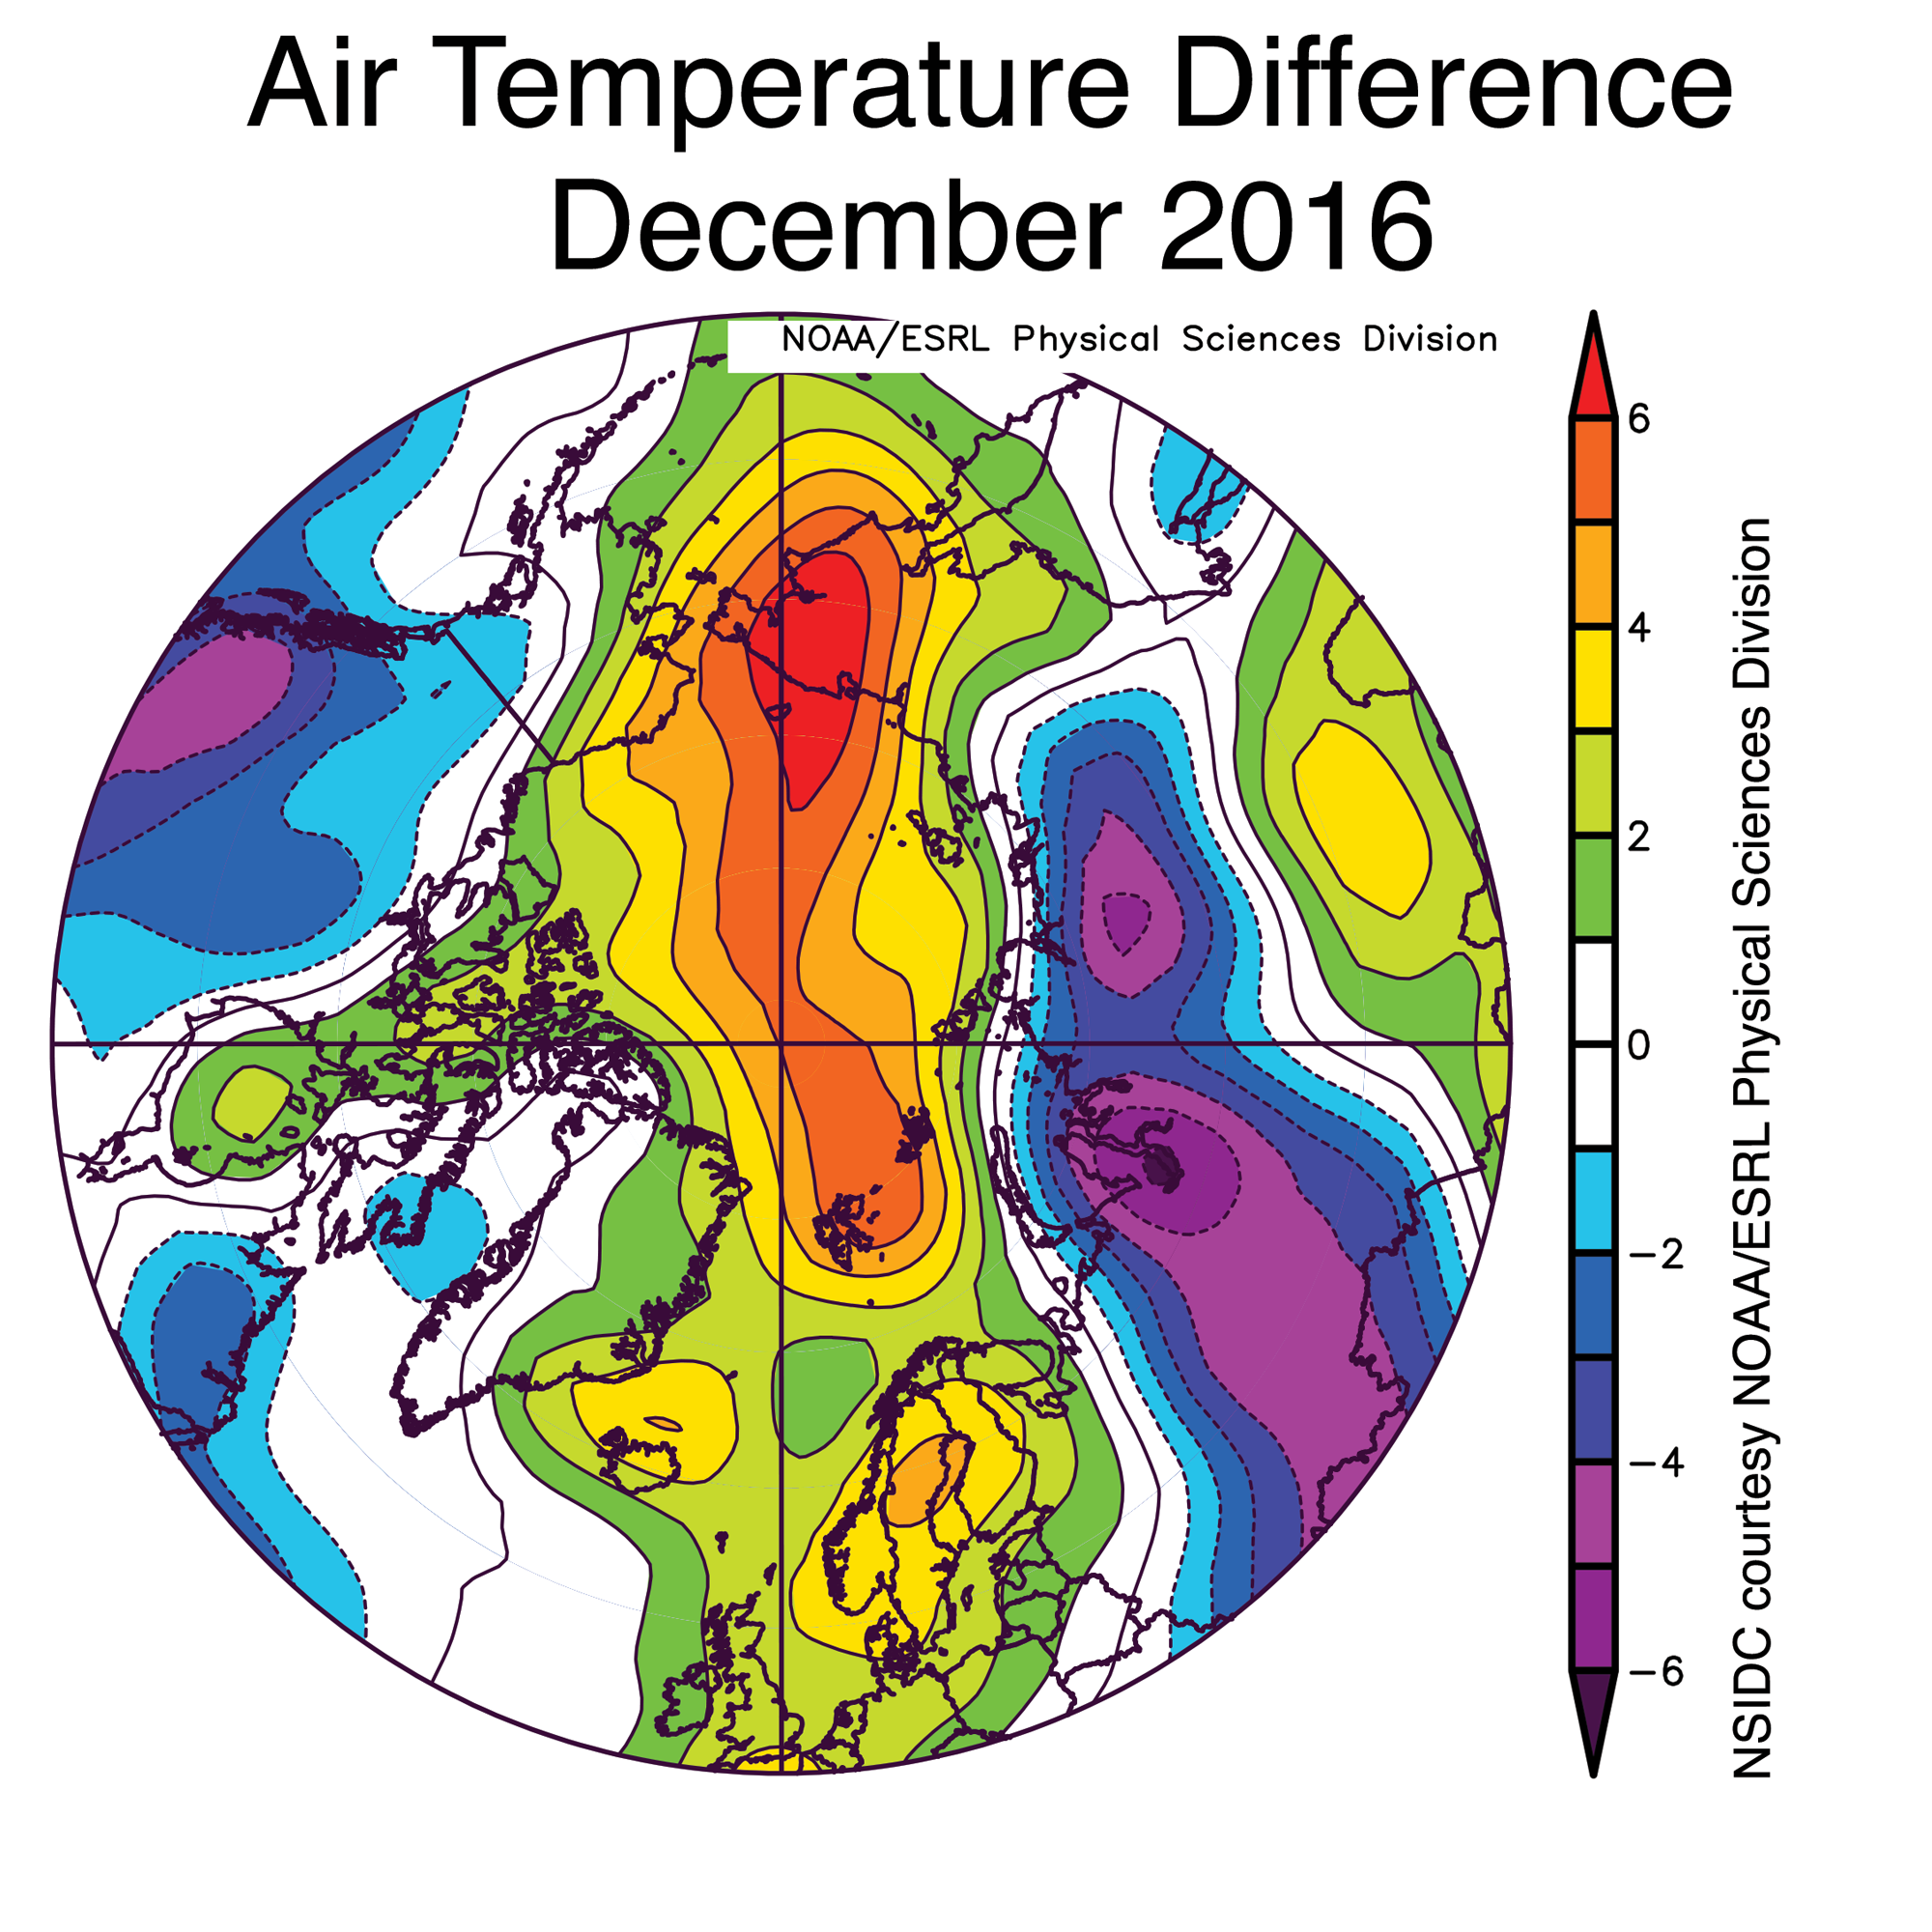
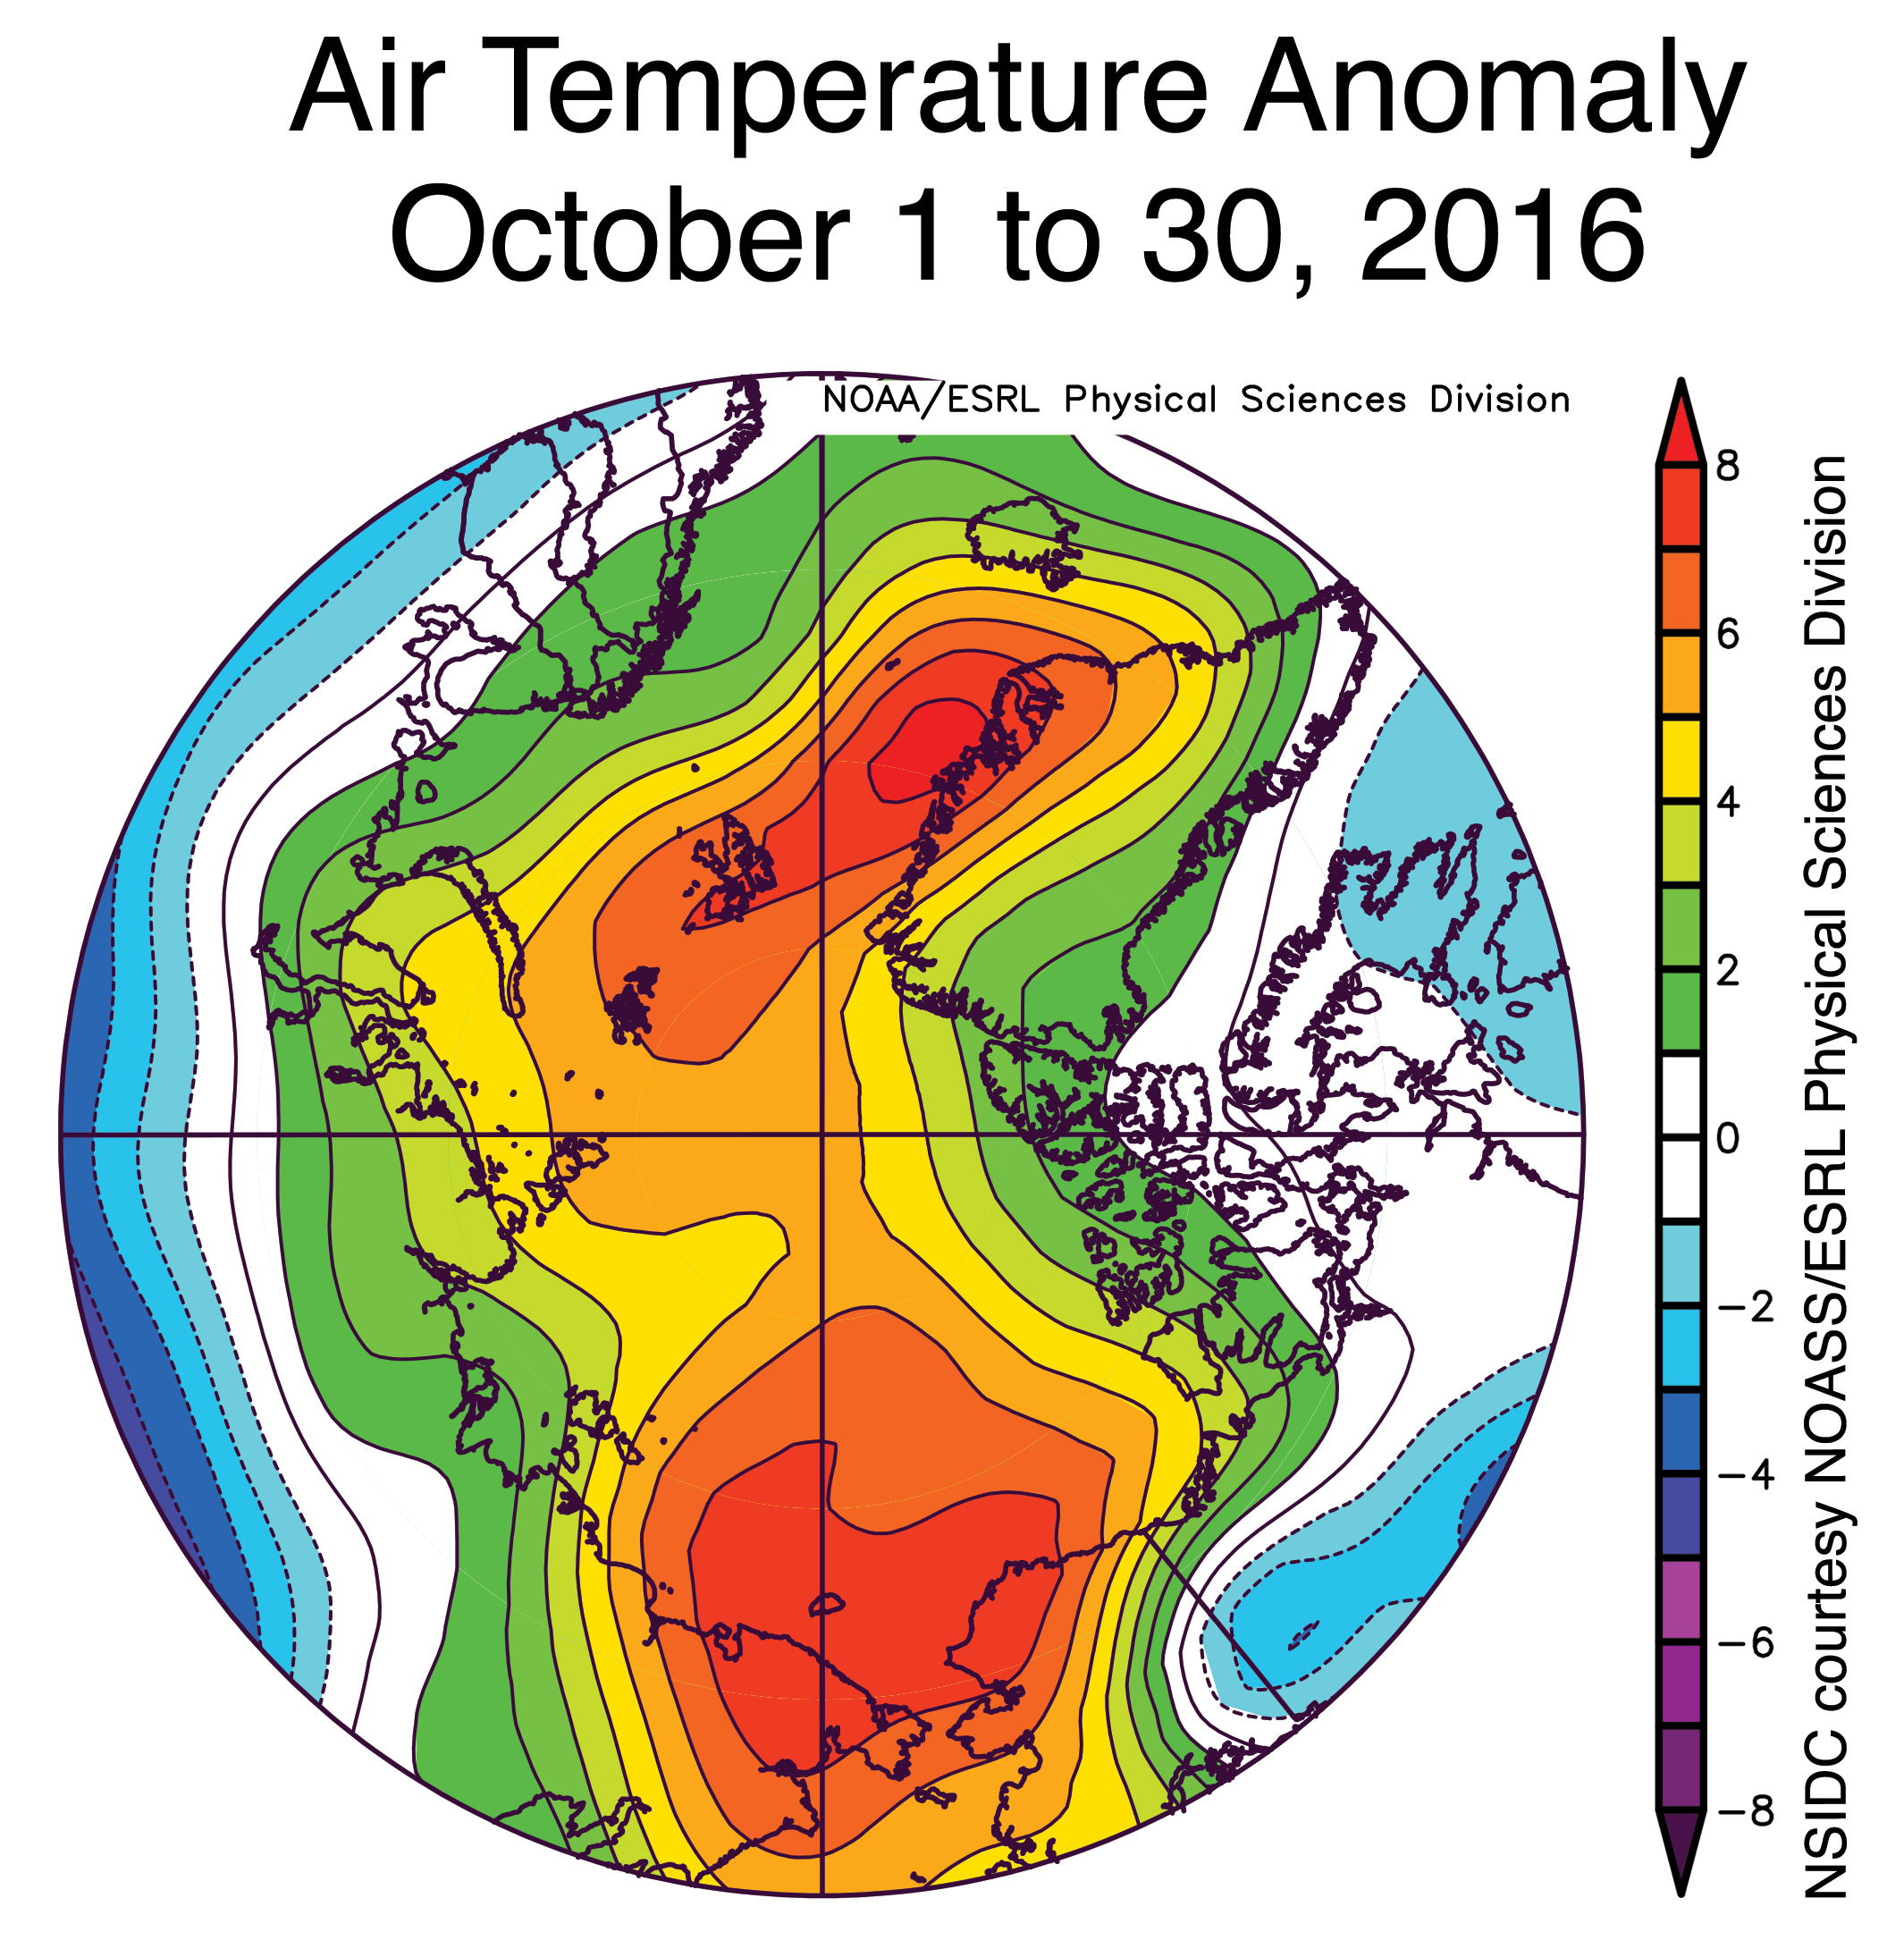
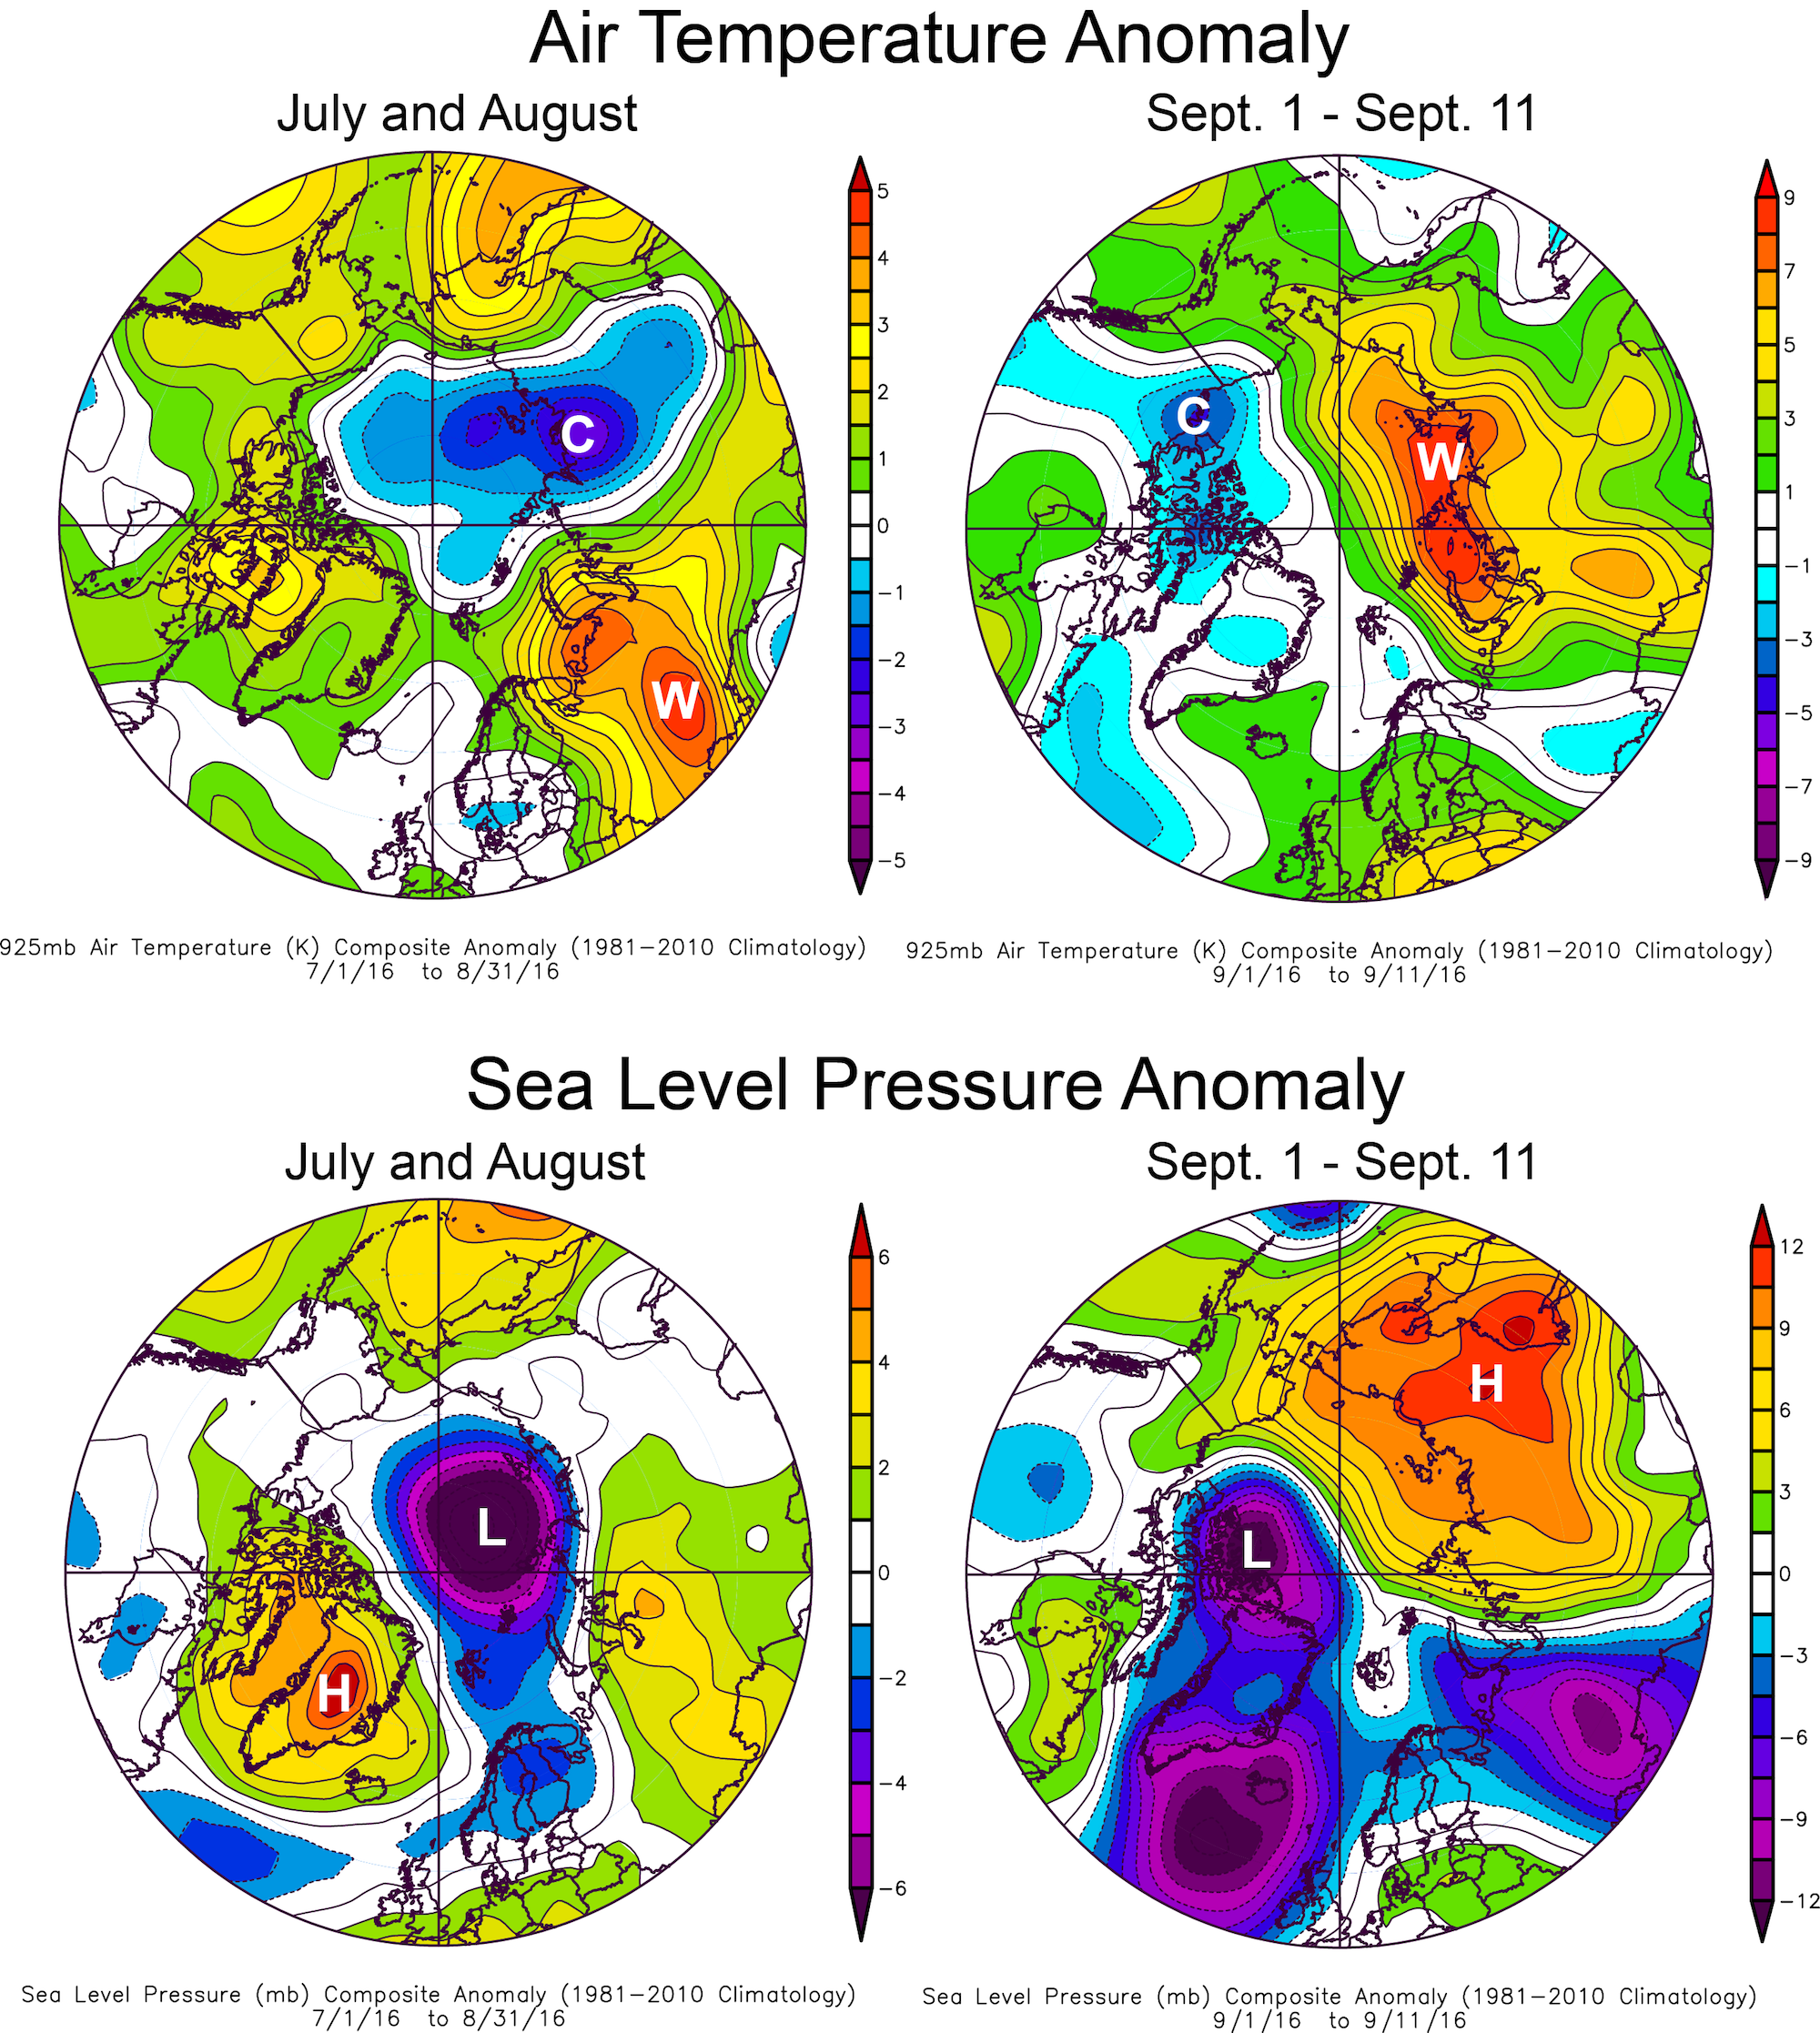
Figure 2b. This image shows average sea level pressure over the Arctic Ocean for the period of September 1 to 16, 2017.
Credit: NSIDC courtesy NOAA/ESRL Physical Sciences Division
High-resolution image
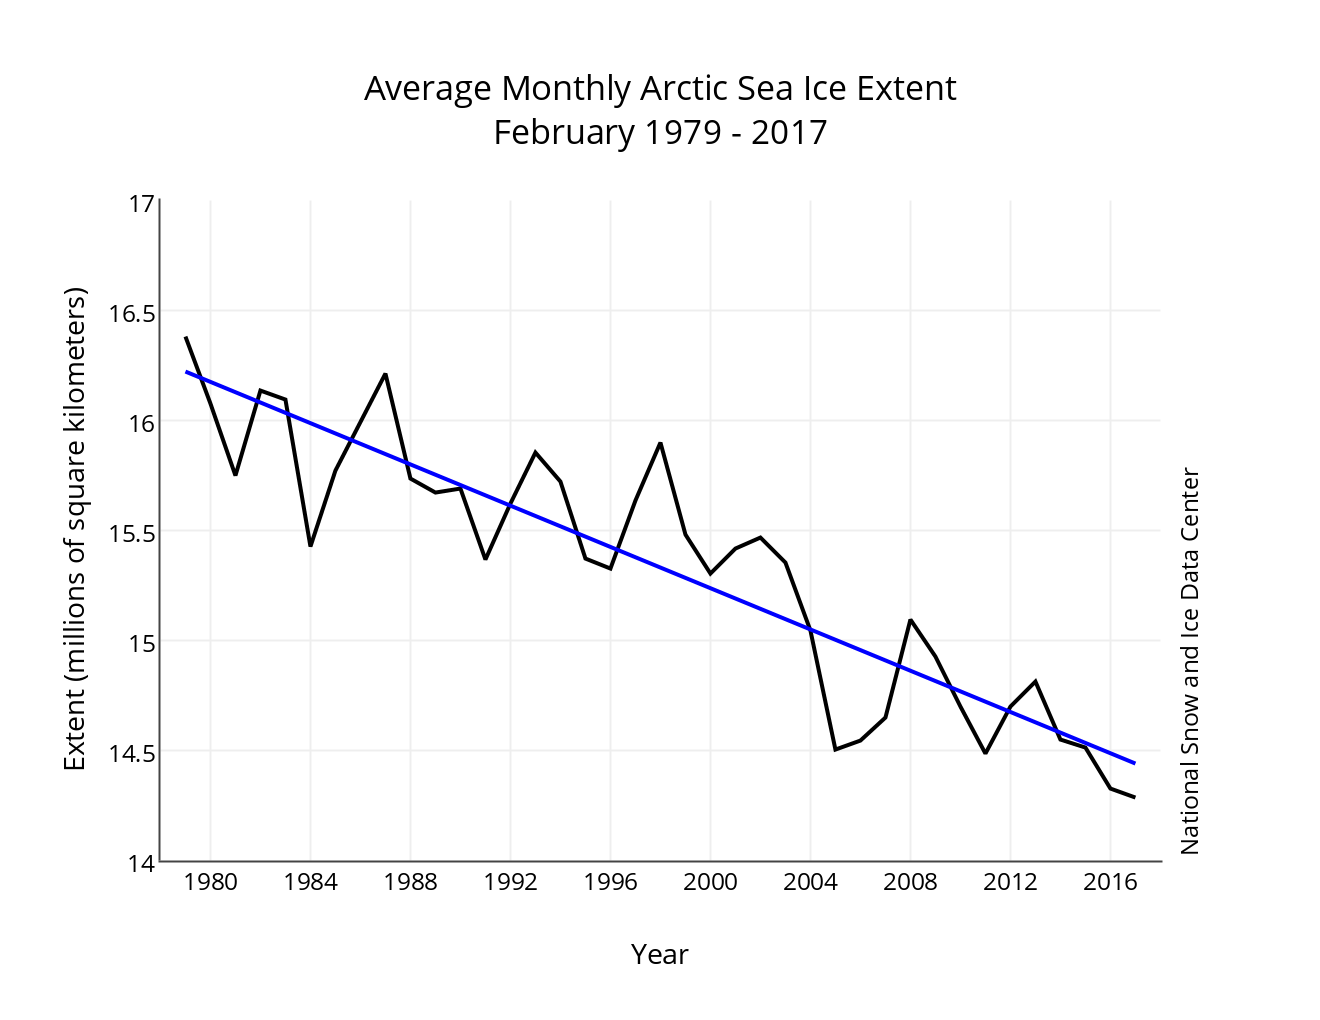
The date of the minimum ice extent for 2017 was two days earlier than the average minimum date of September 15. The earliest annual sea ice minimum in the satellite record occurred on September 5 in the years 1980 and 1987, and the latest on September 23, 1997.
As is typical of this time of year when the solar radiation received at the surface is quickly waning, the rate of ice loss slowed during the first half of September. Ice retreat from the beginning of September until the minimum averaged 25,300 square kilometers (9,770 square miles) per day, slightly faster than the 1981 to 2010 average for the same period of 22,800 square kilometers (8,800 square miles) per day.
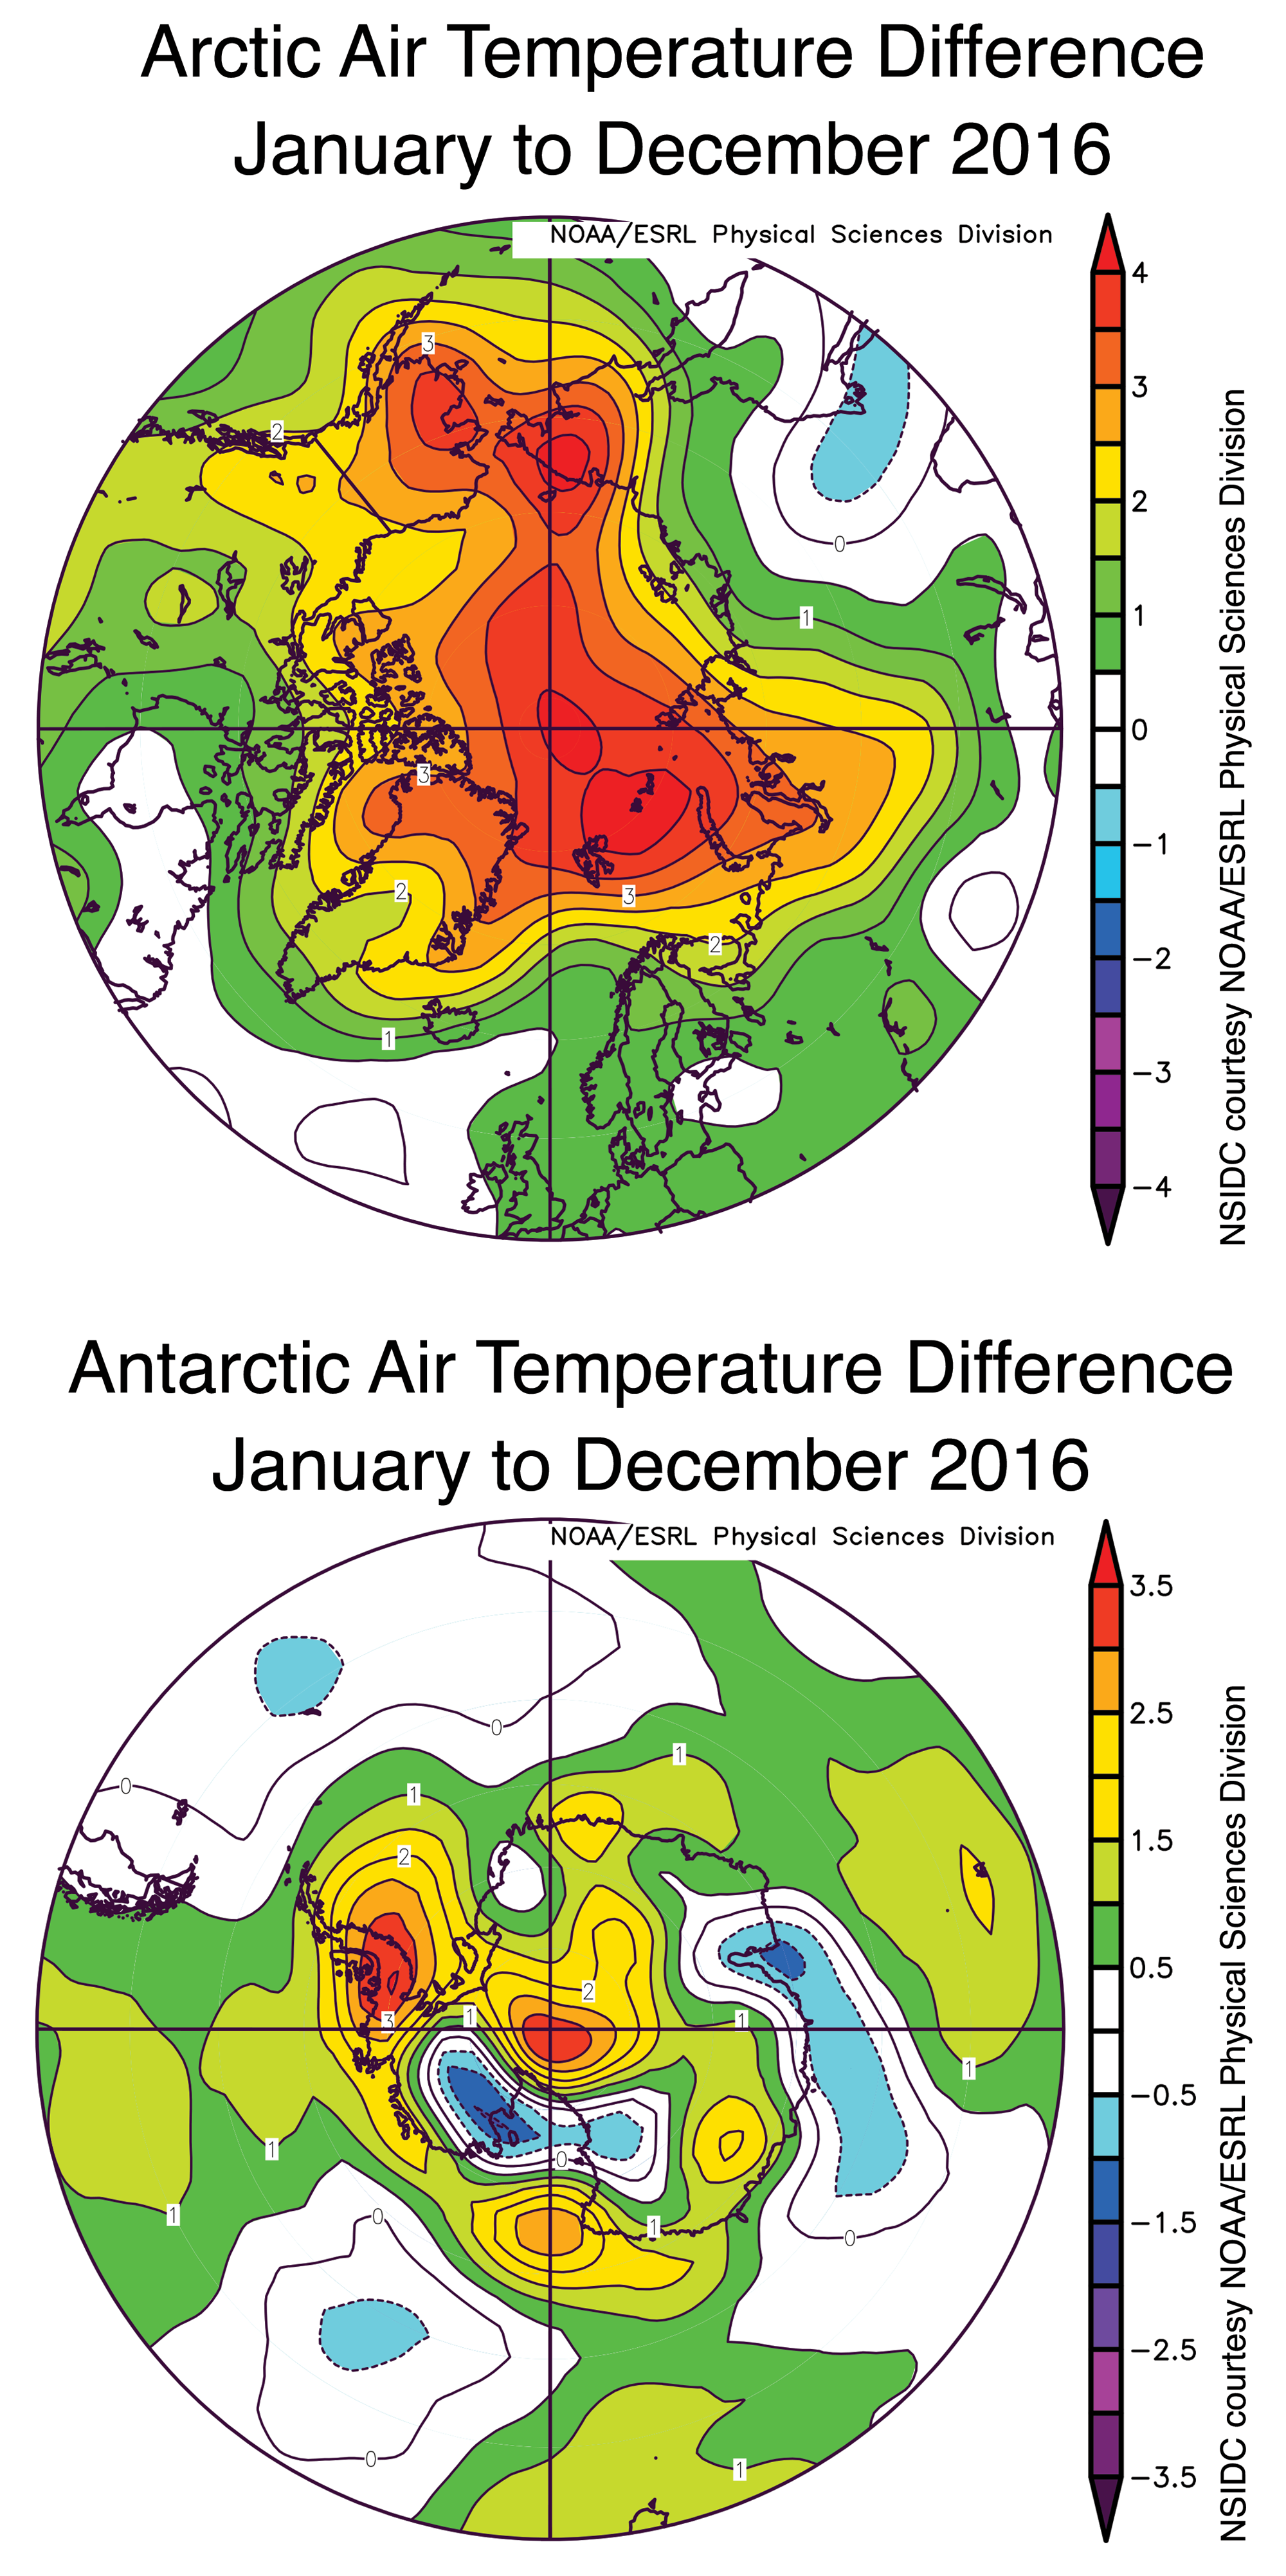
The pattern of low sea level pressure over the central Arctic Ocean that persisted through this summer and inhibited summer ice loss has broken down. For the first half of September, the pattern has instead been one of above-average sea level pressure centered over the Barents Sea and extending across part of the Arctic Ocean (Figure 2b). Corresponding air temperatures at the 925 hPa level (about 2,500 feet above sea level) were above average over most of the Arctic Ocean. Above average temperatures over some parts of the Arctic Ocean likely reflect heat transfer to the atmosphere from areas of open water, hence cooling the ocean.
Ten lowest minimum Arctic sea ice extents (satellite record, 1979 to present)
| RANK | YEAR | MINIMUM ICE EXTENT | DATE | |
|---|---|---|---|---|
| IN MILLIONS OF SQUARE KILOMETERS | IN MILLIONS OF SQUARE MILES | |||
| 1 | 2012 | 3.39 | 1.31 | Sept. 17 |
| 2 | 2016 2007 |
4.14 4.15 |
1.60 1.60 |
Sept. 10 Sept. 18 |
| 4 | 2011 | 4.34 | 1.67 | Sept. 11 |
| 5 | 2015 | 4.43 | 1.71 | Sept. 9 |
| 6 | 2008 | 4.59 | 1.77 | Sept. 19 |
| 7 | 2010 | 4.62 | 1.78 | Sept. 21 |
| 8 | 2017 | 4.64 | 1.79 | Sept. 13 |
| 9 | 2014 | 5.03 | 1.94 | Sept. 17 |
| 10 | 2013 | 5.05 | 1.94 | Sept. 13 |
Effects of seasonal ice retreat in the Beaufort and Chukchi Seas
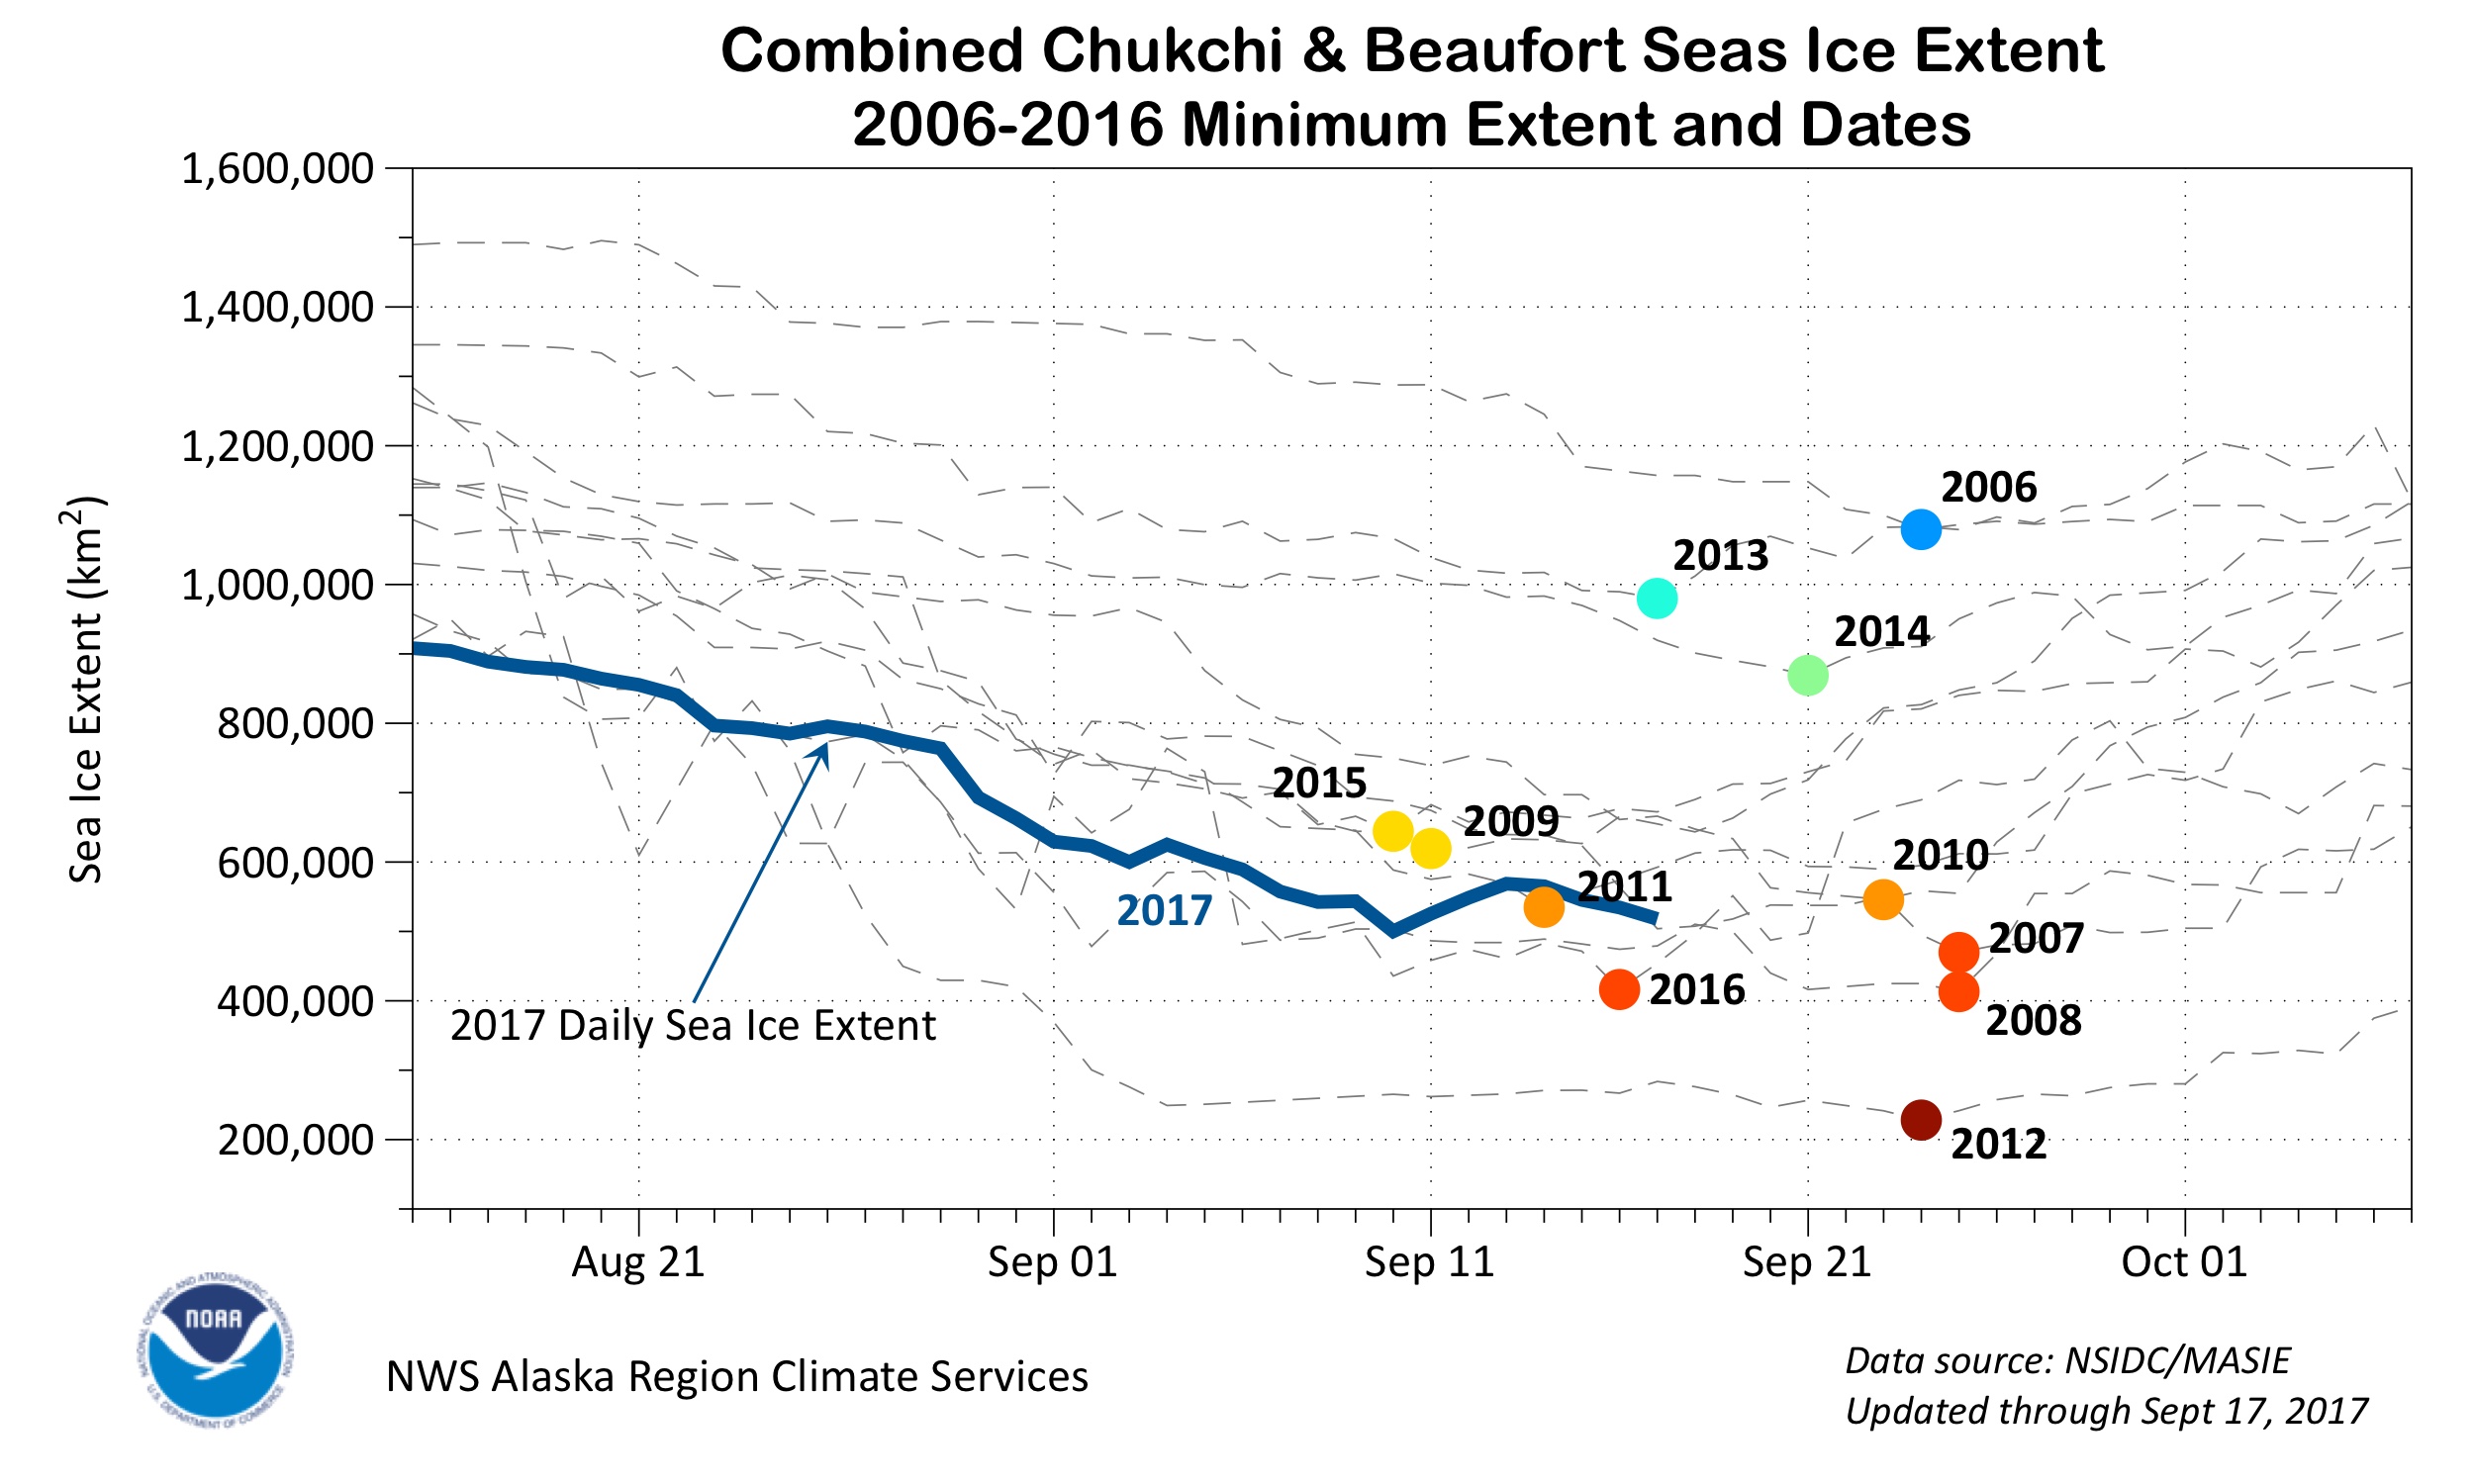
Figure 3. This chart shows combined sea ice extent in the Chukchi and Beaufort Seas from August 15 to October 7 for the years 2006 to 2016, including the extent so far for 2017. The colored dots show the day the minimum occurred in the region during a specific year. Data are from the Multisensor Analyzed Sea Ice Extent (MASIE) product.
Credit: Courtesy R. Thoman/National Weather Service Alaska Region Environmental and Scientific Services Division
High-resolution image
According to a report by the Alaska Dispatch News, the lack of sea ice forced walruses to the shore of Alaska’s Chukchi Sea earlier than any time on record. The lack of ice also forced biologists monitoring Alaska polar bears to cut short their spring field season. In turn, the NOAA National Weather Service Climate Prediction Center states that because of the extensive open water, air temperatures over the Beaufort and Chukchi Seas and along the North Slope of Alaska will likely be far above average through this autumn.
Rick Thoman of the National Weather Service in Fairbanks, Alaska compiled an analysis of the combined Chukchi and Beaufort Seas ice extent from the Multisensor Analyzed Sea Ice Extent (MASIE) product. MASIE is based on operational ice analyses at the U.S. National Ice Center and is archived and distributed by NSIDC. It shows that 2017 tracked near record lows for the region through much of the summer, but after mid-August the pace of ice loss slowed relative to recent years. While it appears unlikely that extent in the Beaufort and Chukchi Seas will reach a record low (set in 2012), it will still be among the four or five lowest in the MASIE record (Figure 3). Note that the range in dates for the minimum extent in the region differs from those for the Arctic as a whole and tend to be later, ranging from September 10 in 2015 to September 25 in 2007 and 2008. In other words, the Chukchi and Beaufort Seas may continue to lose ice even after the overall Arctic minimum extent is reached. From the passive microwave data (not shown), the Chukchi/Beaufort minimum has occurred as early as August 14 in 1980 to as late as October 2 in 1991.
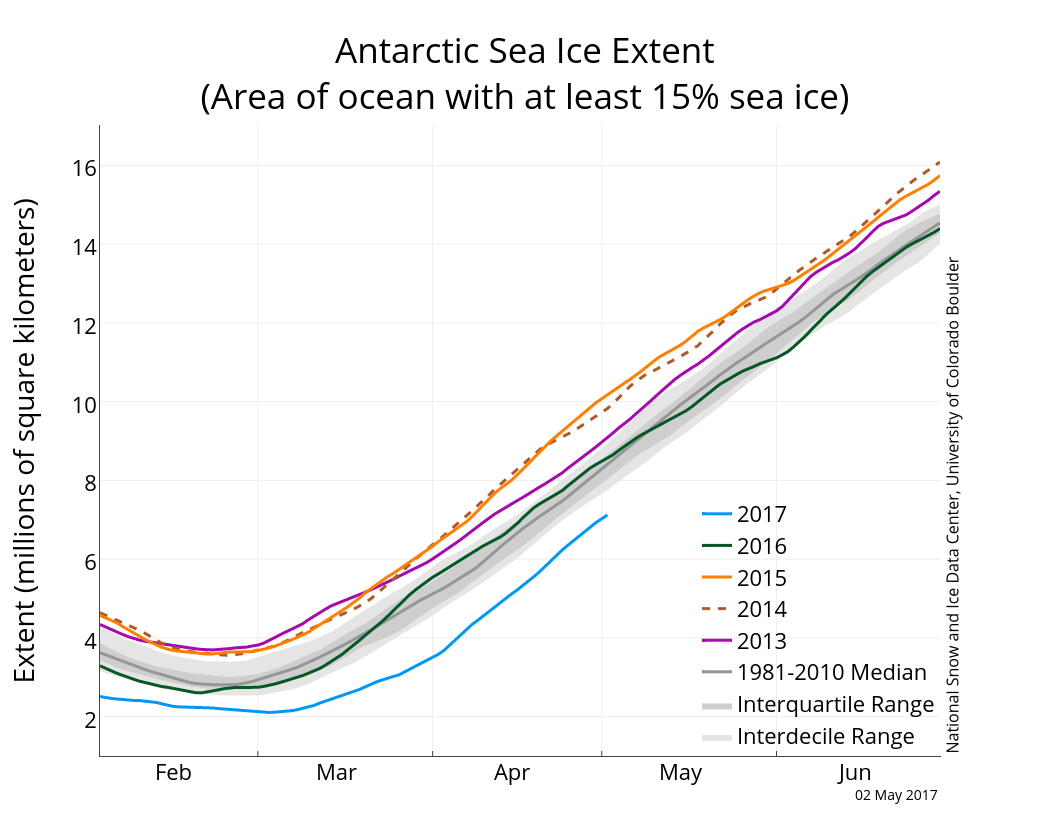
Antarctic sea ice approaching winter maximum
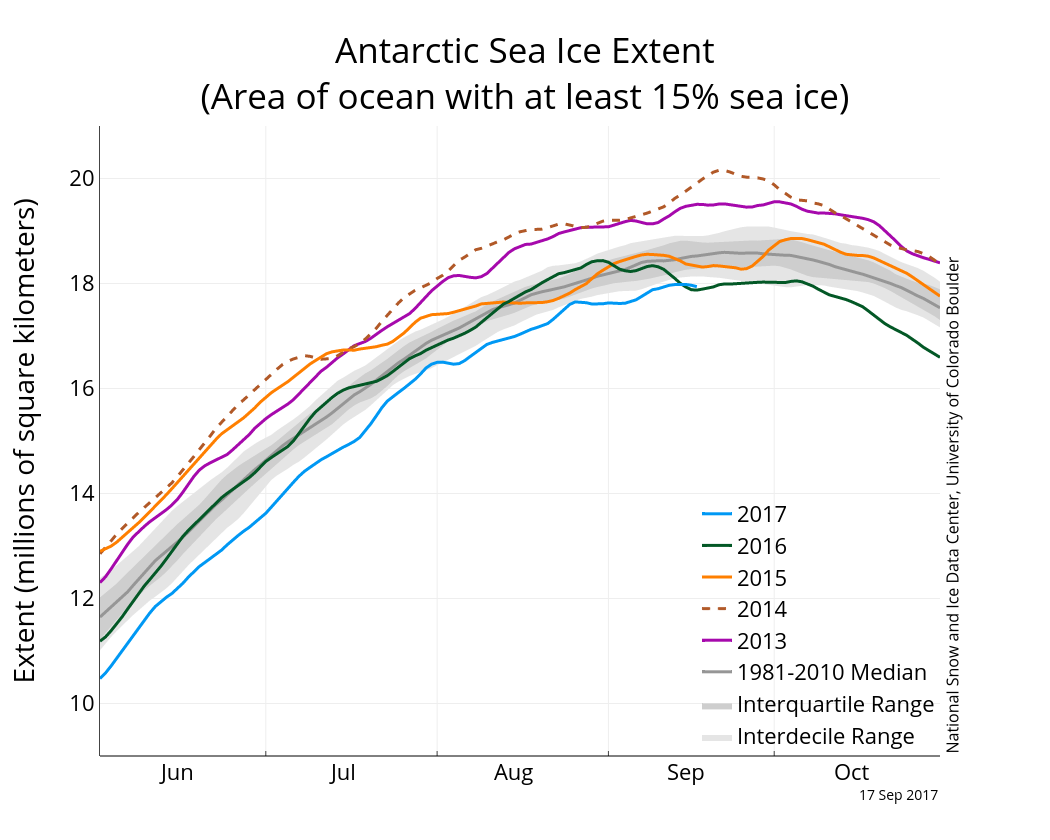
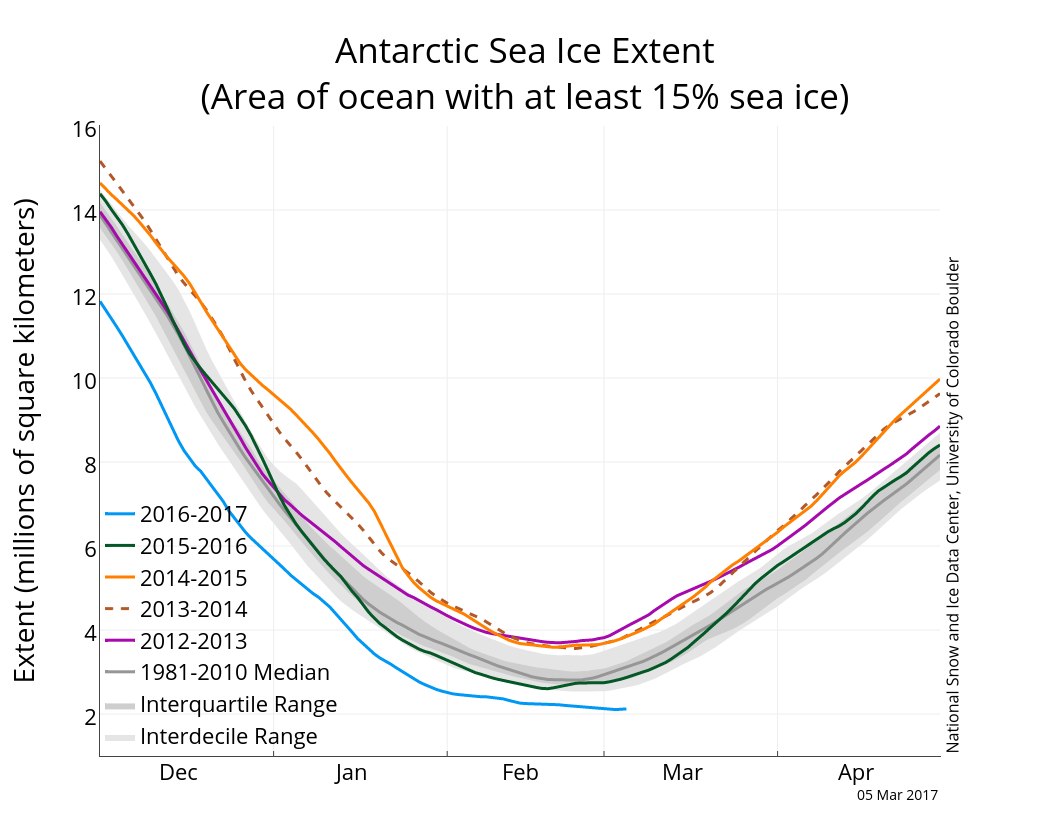
Figure 4a. The graph above shows Antarctic sea ice extent as of September 17, 2017, along with daily ice extent data for four previous years. 2017 is shown in blue, 2016 in green, 2015 in orange, 2014 in dashed brown, 2013 in purple. The 1981 to 2010 median is in dark gray. The gray areas around the median line show the interquartile and interdecile ranges of the data. Sea Ice Index data.
Credit: National Snow and Ice Data Center
High-resolution image
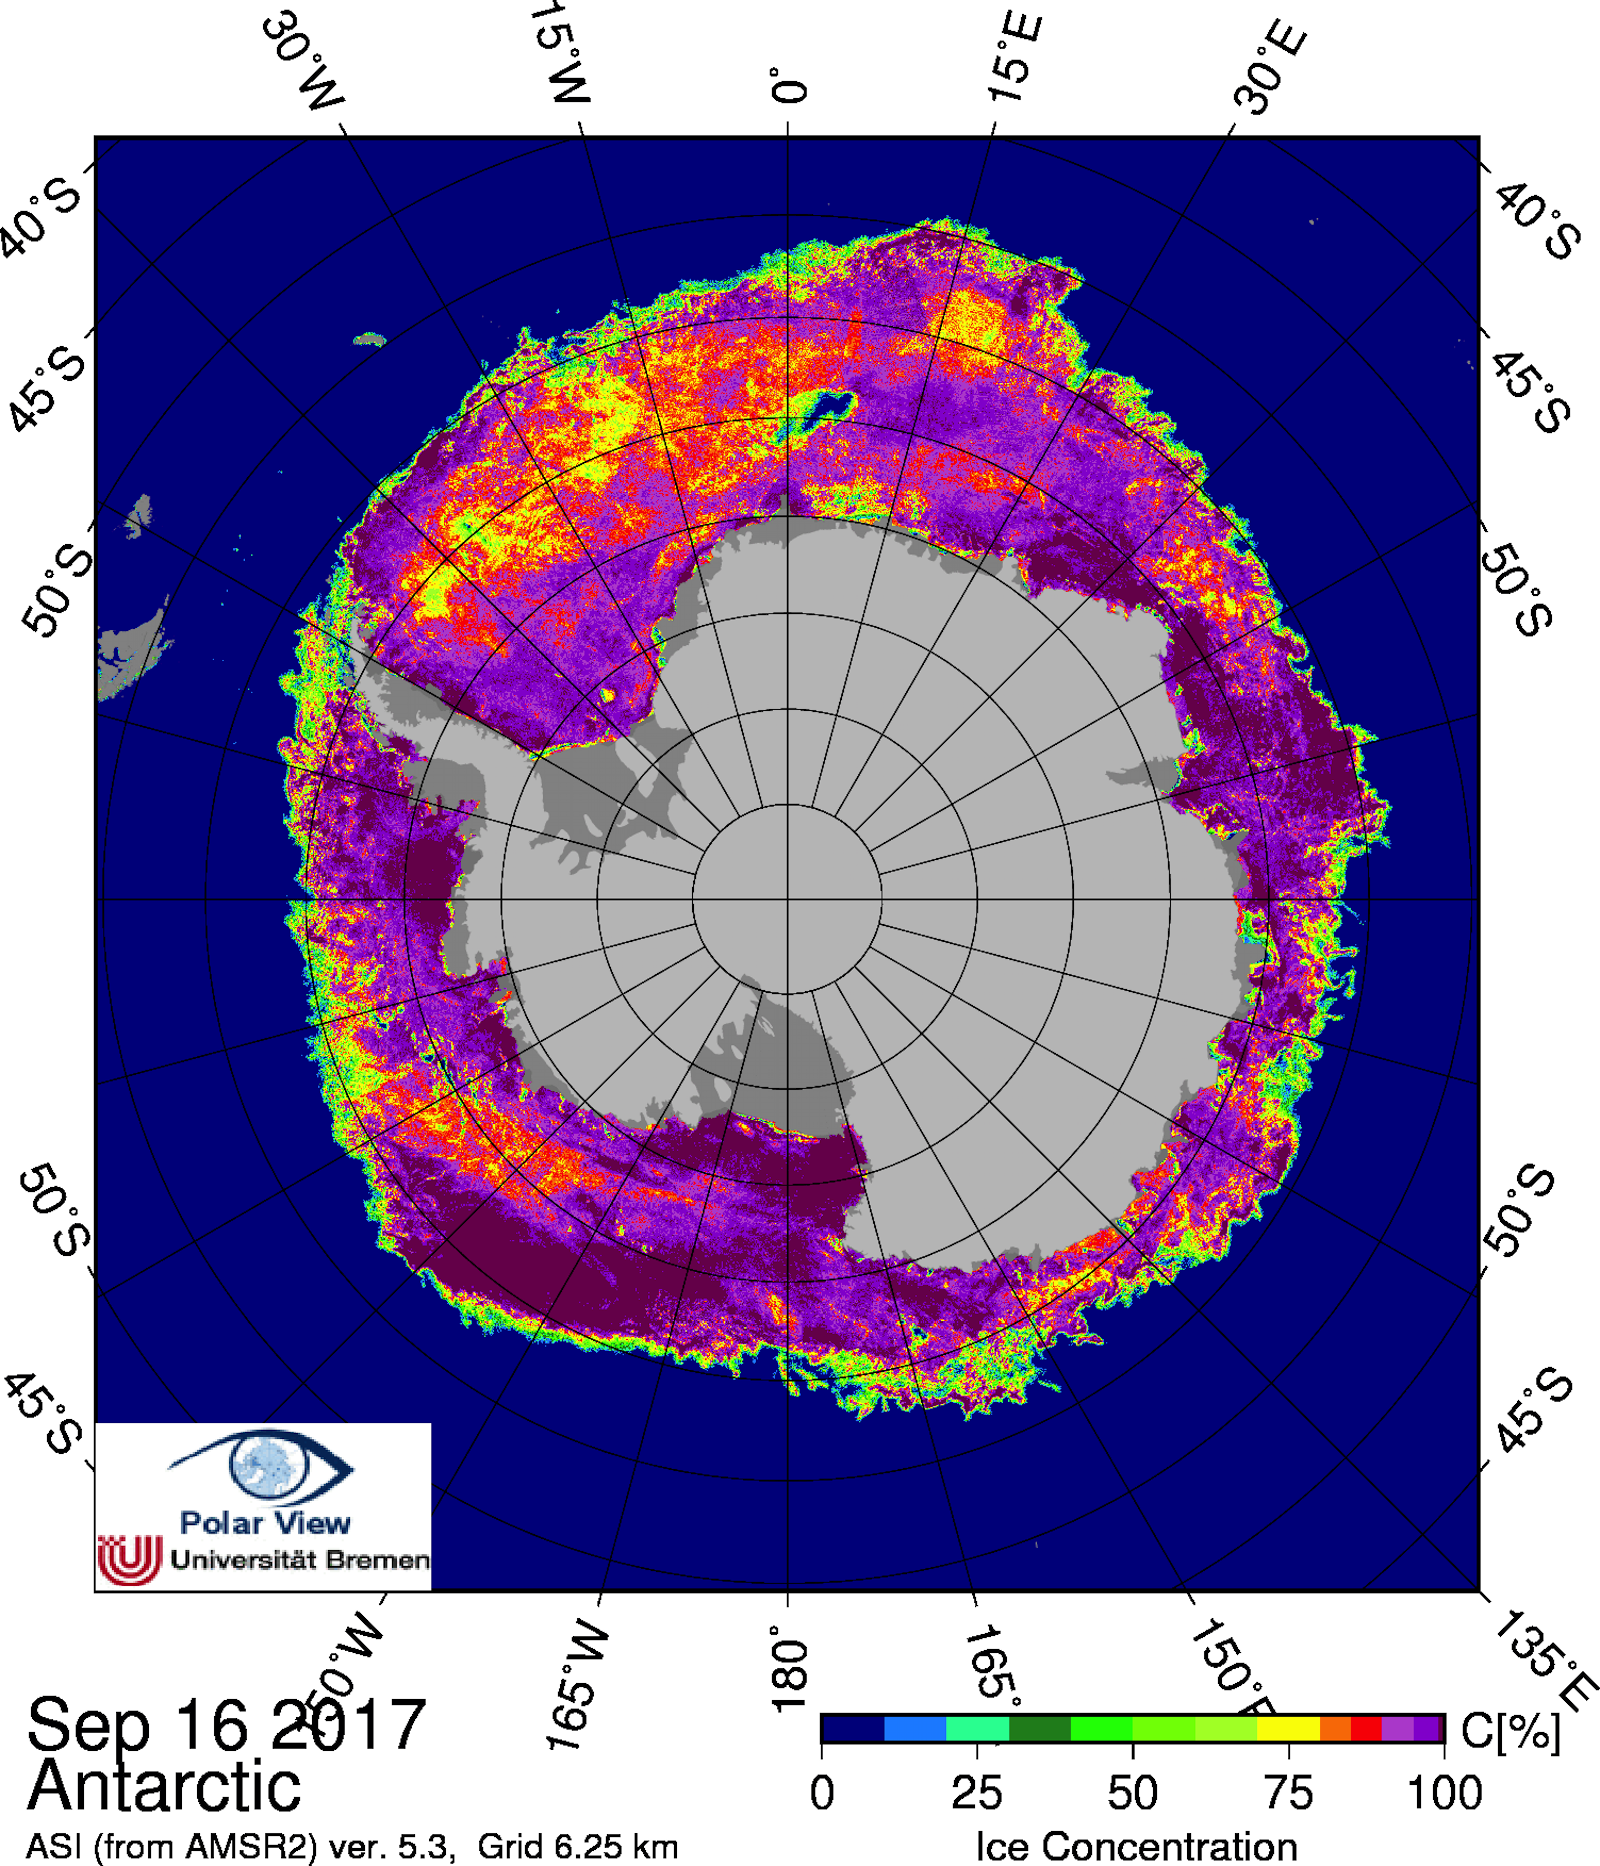
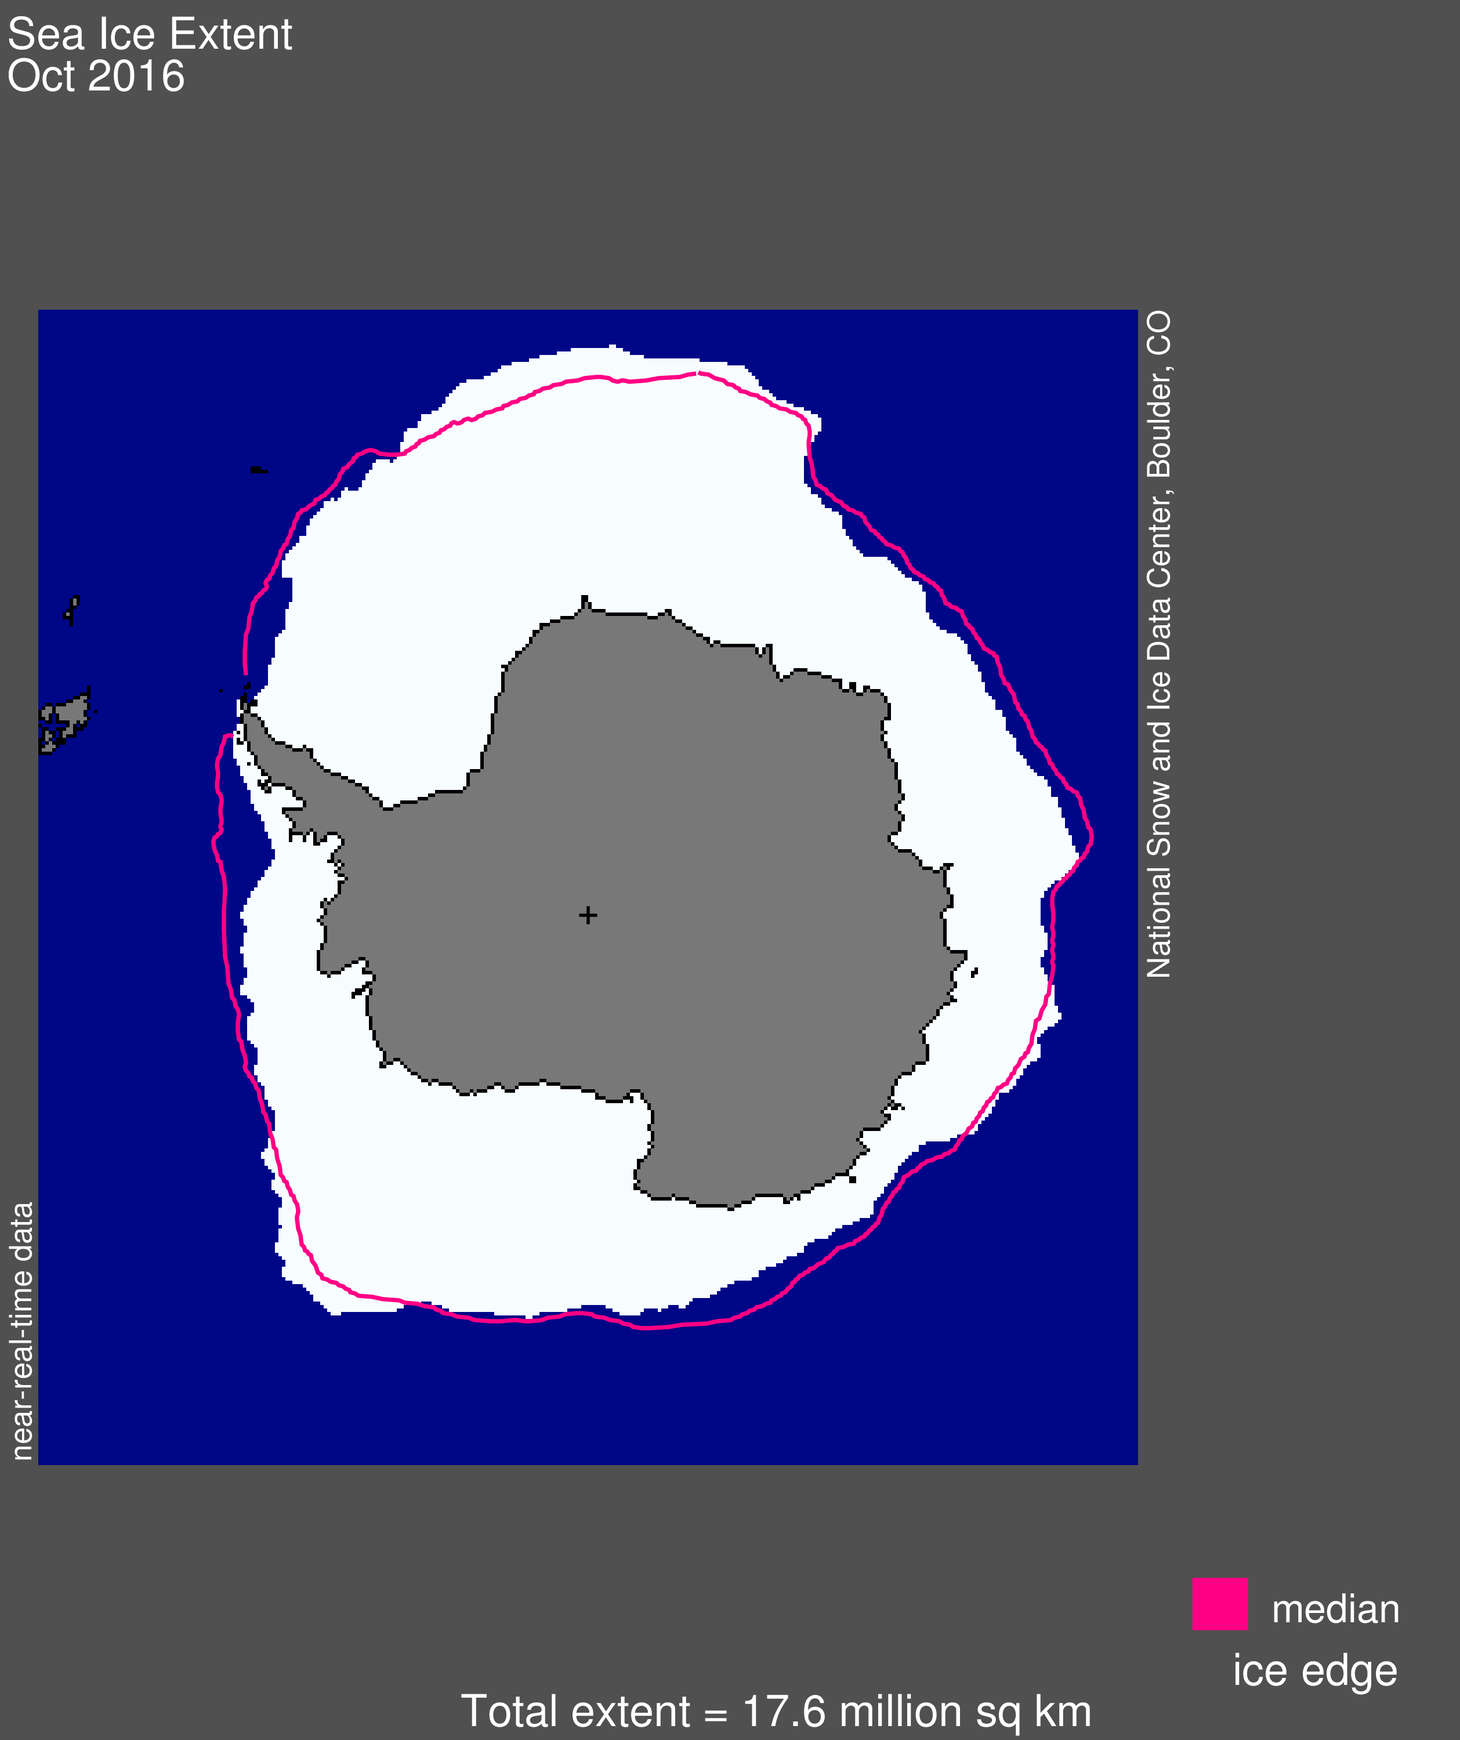
Figure 4b: This map shows Antarctic sea ice concentration on September 16, 2017. Note the Maud Rise polynya at the top of the image. Data are from the Advanced Microwave Scannig Radiometer 2 (AMSR2).
Credit: G. Heygster, C. Melsheimer, J. Notholt/Institute of Environmental Physics, University of Bremen
High-resolution image
Following the record low summer minimum extent in March, Antarctic sea ice extent is now nearing its winter maximum. This will likely be among the five lowest winter extents in the satellite era. As of mid-September, Antarctic ice extent was just under 18 million square kilometers (7 million square miles), which is approximately half a million square kilometers below the 1981 to 2010 median ice extent. Sea ice is below the typical extent in the Indian Ocean sector, the northern Ross Sea, and the northern Weddell Sea, and slightly above average extent in the northern Amundsen Sea region.
Between September 9 and September 17 of 2016, Antarctic sea ice lost nearly 100,000 square kilometers (38,600 square miles) of sea ice per day, and sea ice extent moved from near-average to a near-record-daily low by September 17. For the next 12 months Antarctic sea ice remained extremely low. Record low ice extents were set every day from November 5, 2016 to April 10, 2017. Extents averaged for November and December of 2016 were five standard deviations below average. No other 12-month period (September 2016 to August 2017) has had such persistently low sea ice extent. The year 1986 had near-record low extent for the winter period (June to December), but there were periods of near-average and even above-average ice extent earlier in the calendar year.
Beginning around September 2, an opening in the Antarctic sea ice pack formed north of Dronning Maud Land in the easternmost Weddell Sea (near 64°S, 5°E). By mid-September, this opening, or polynya, had grown to about 12,000 square kilometers (4,600 square miles). This feature has been observed intermittently in the Antarctic pack ice since the first satellite data became available in the 1970s. In 1974, 1975, and 1976, the polynya was much larger, averaging 250,000 square kilometers (96,500 square miles). It was absent for many years in the 1980s and 1990s. In recent years the feature has been observed sporadically and has been much smaller.
The polynya is formed when ocean currents uplift deep warm ocean water to the surface where it melts the sea ice. An oceanic plateau called the Maud Rise is responsible for forcing the vertical movement of the water. The persistence of certain atmospheric patterns, such as the southern annular mode, or SAM, is thought to play a role in driving the deep water layer against the Maud Rise.
2017 Arctic sea ice minimum animation
See the NASA animation of Arctic sea ice extent from the beginning of the melt season on March 8, 2017 to the day of the annual minimum on September 13, 2017 here.
Further reading
Gordon, A.L., Visbeck, M. and Comiso, J.C. 2007. A possible link between the Weddell Polynya and the Southern Annular Mode. Journal of Climate, 20(11), 2558-2571. doi:10.1175/JCLI4046.1
Holland, D.M. 2001. Explaining the Weddell Polynya–a large ocean eddy shed at Maud Rise. Science, 292(5522), 1697-1700. doi:10.1126/science.1059322.
Erratum
In Table 1, years 2014 and 2013 were both ranked ninth lowest. They should have been ninth and tenth respectively. This has been corrected.