While large parts of the world saw record breaking heat in July, and Antarctic sea ice extent remained at record daily lows as assessed over the satellite record, Arctic sea ice extent for July was only the twelfth lowest in the satellite record. At month’s end, ice concentrations were low north of the Laptev Sea; however, the Northern Sea Route and the Northwest Passage retained considerable ice.
Overview of conditions
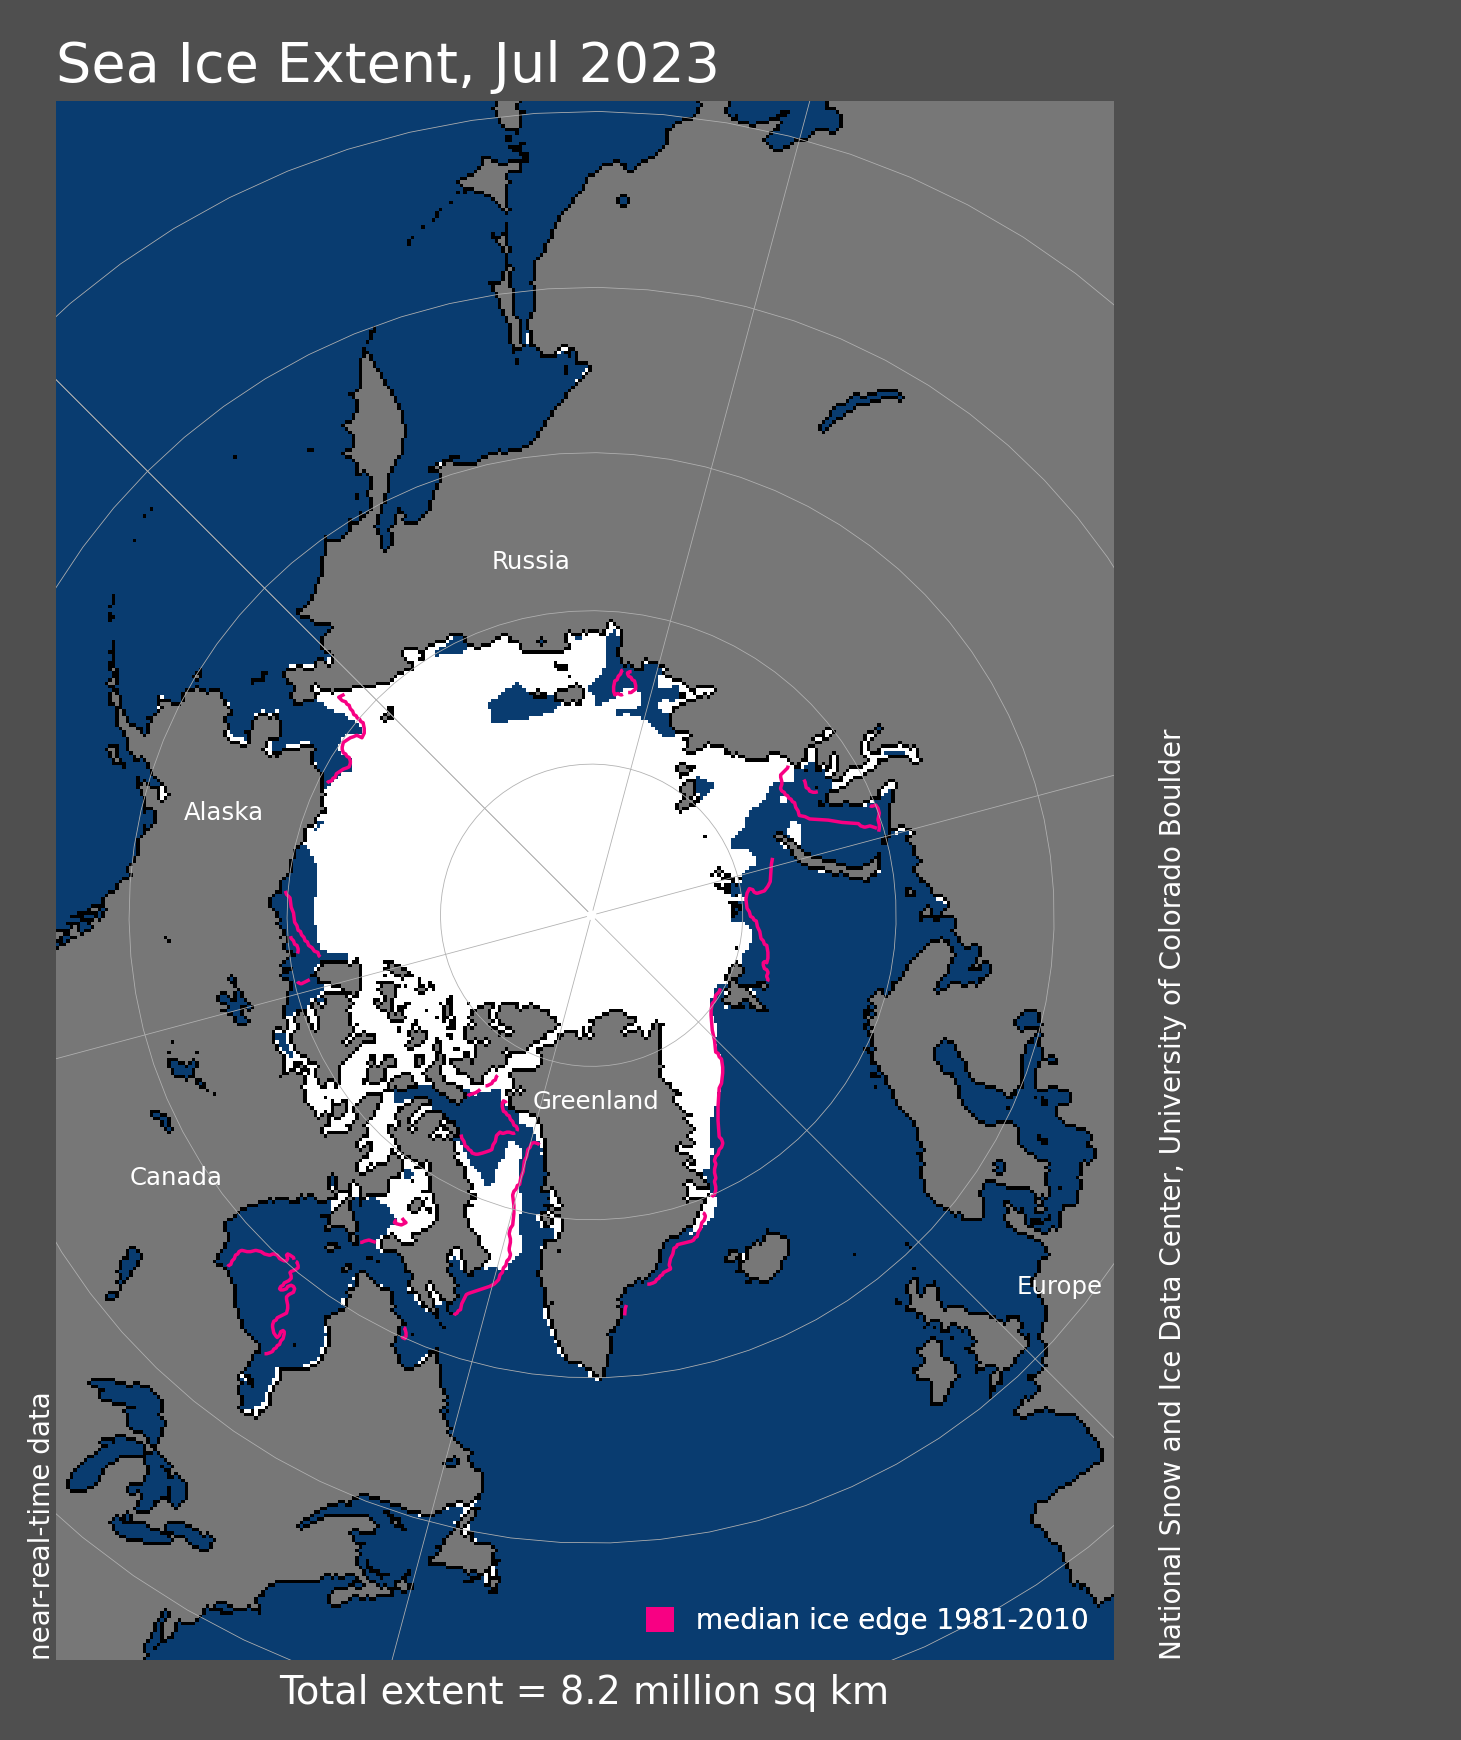
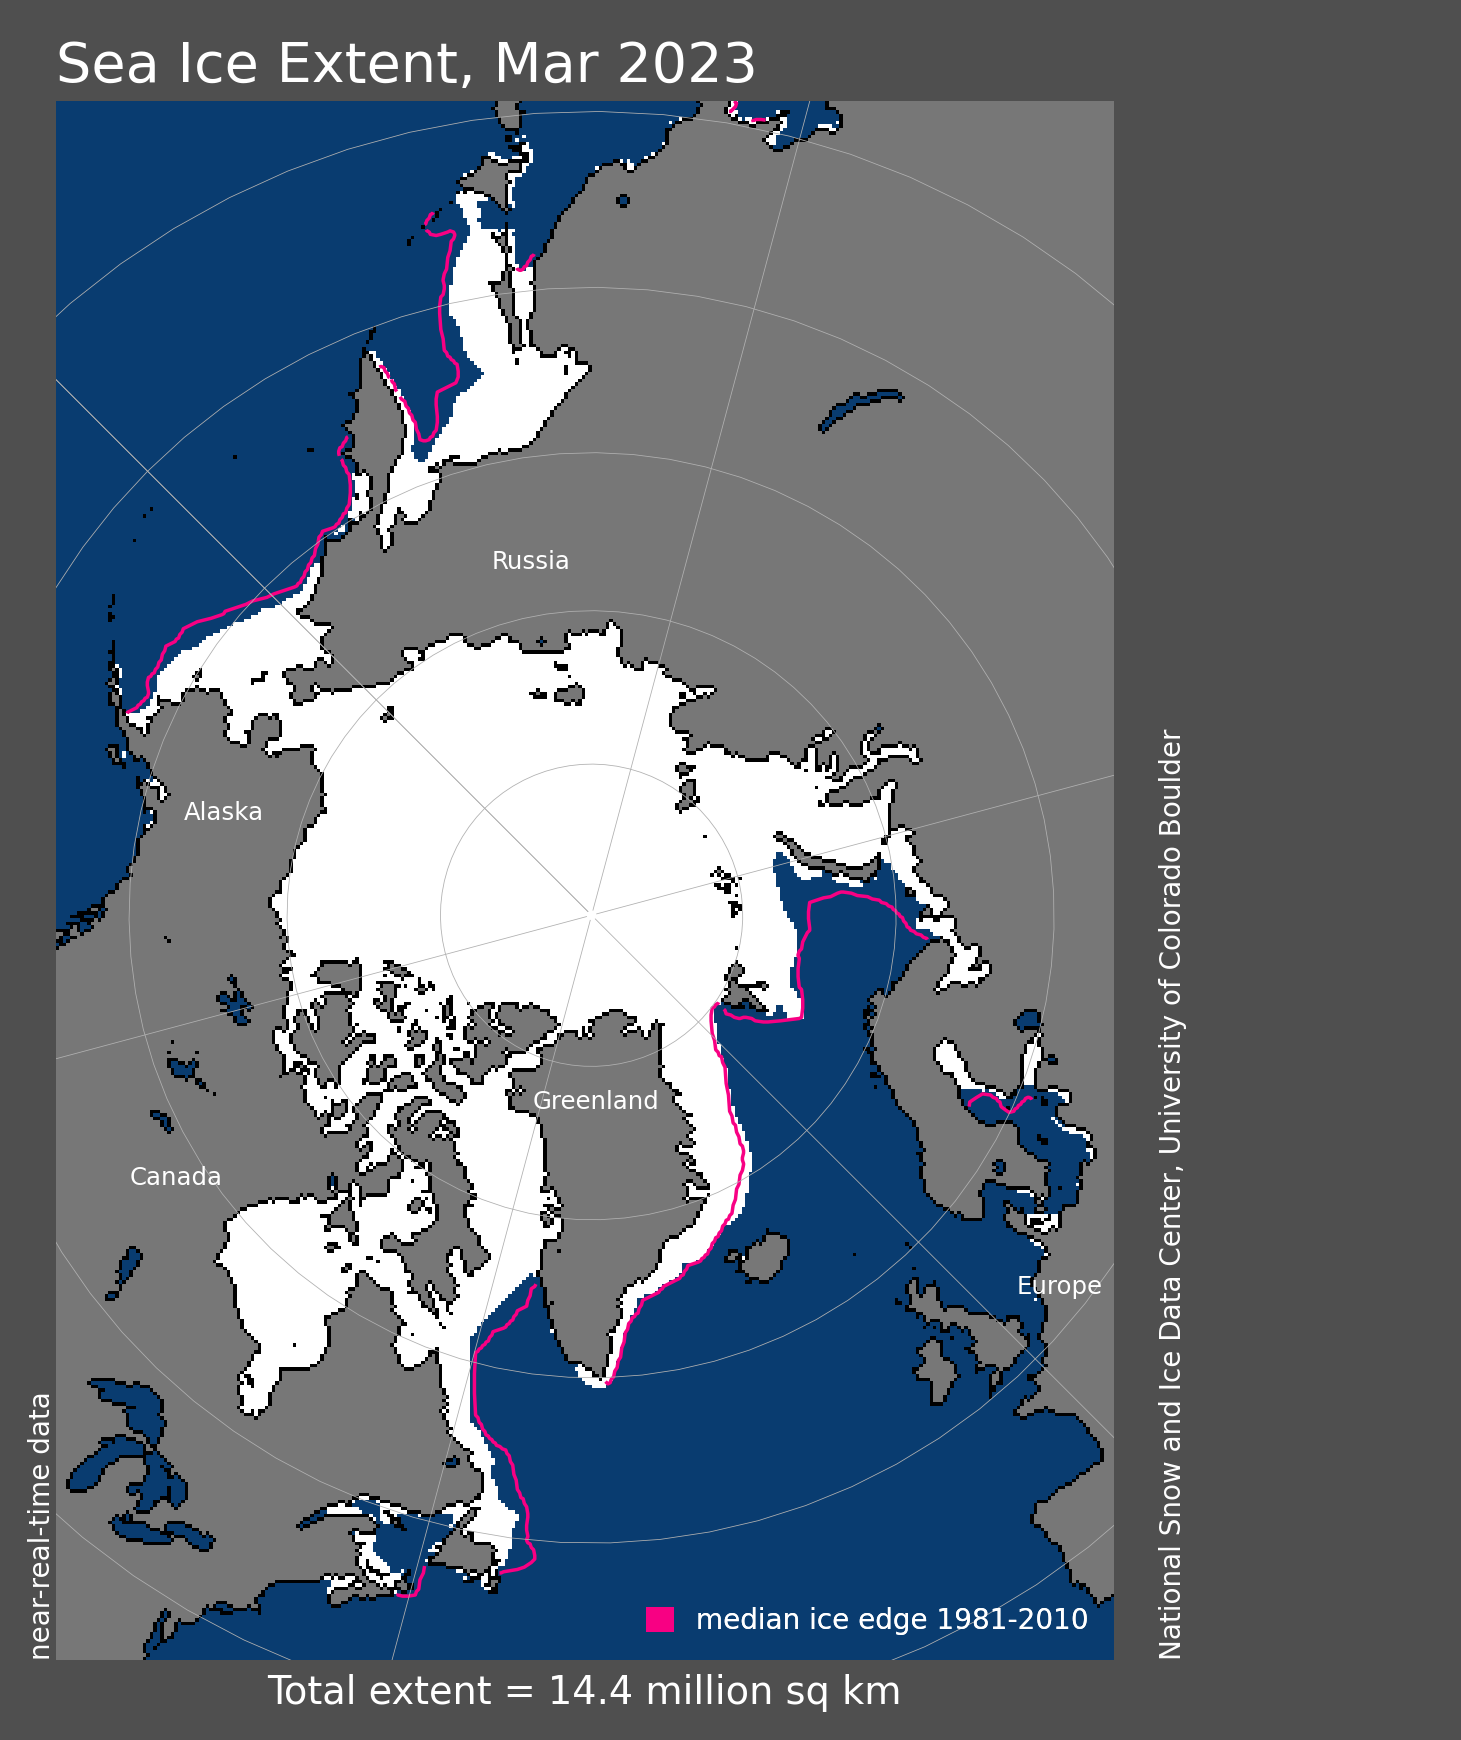
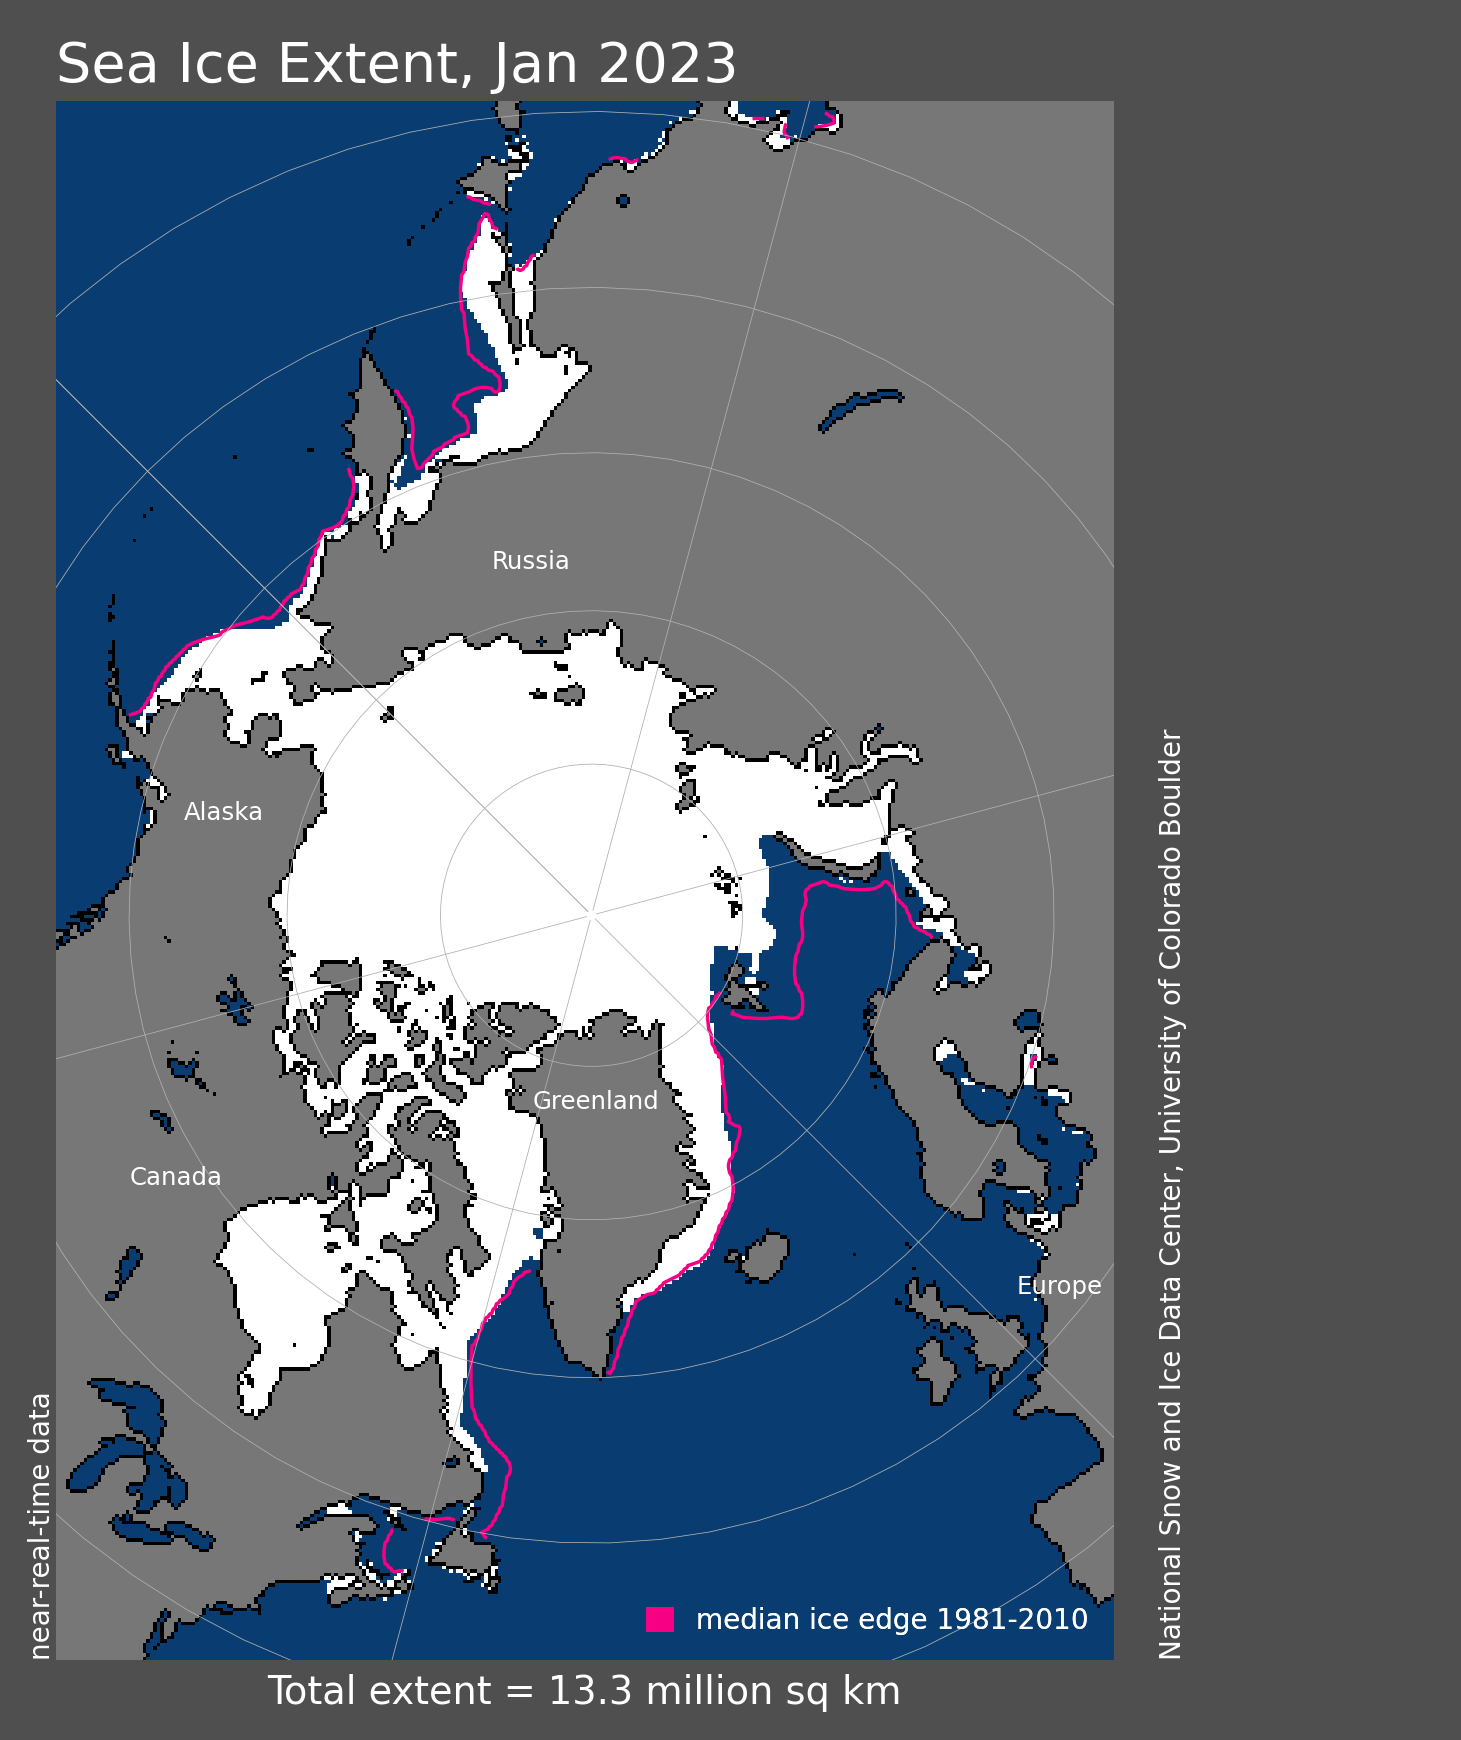
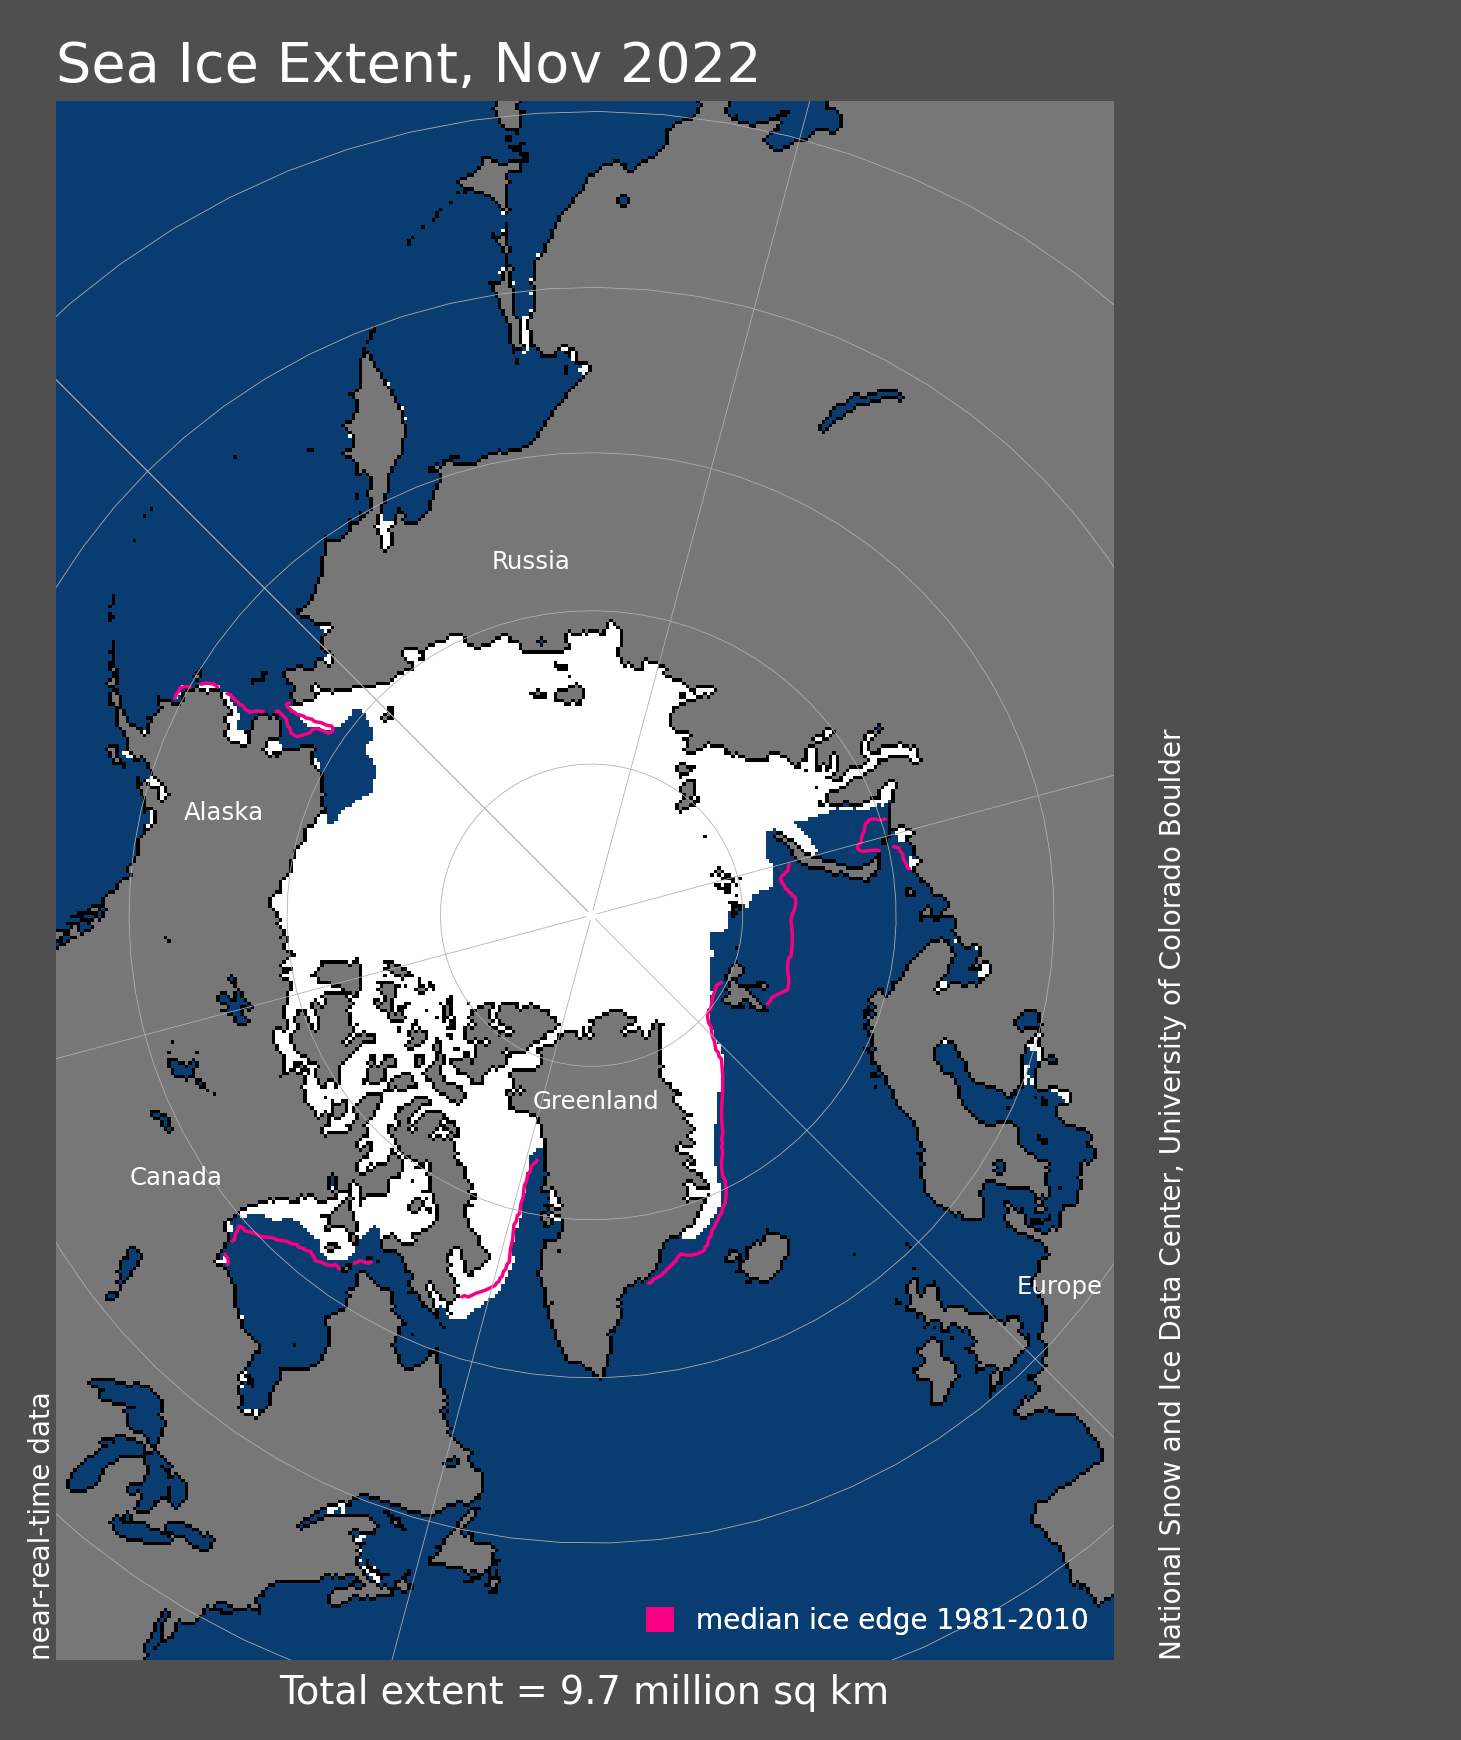
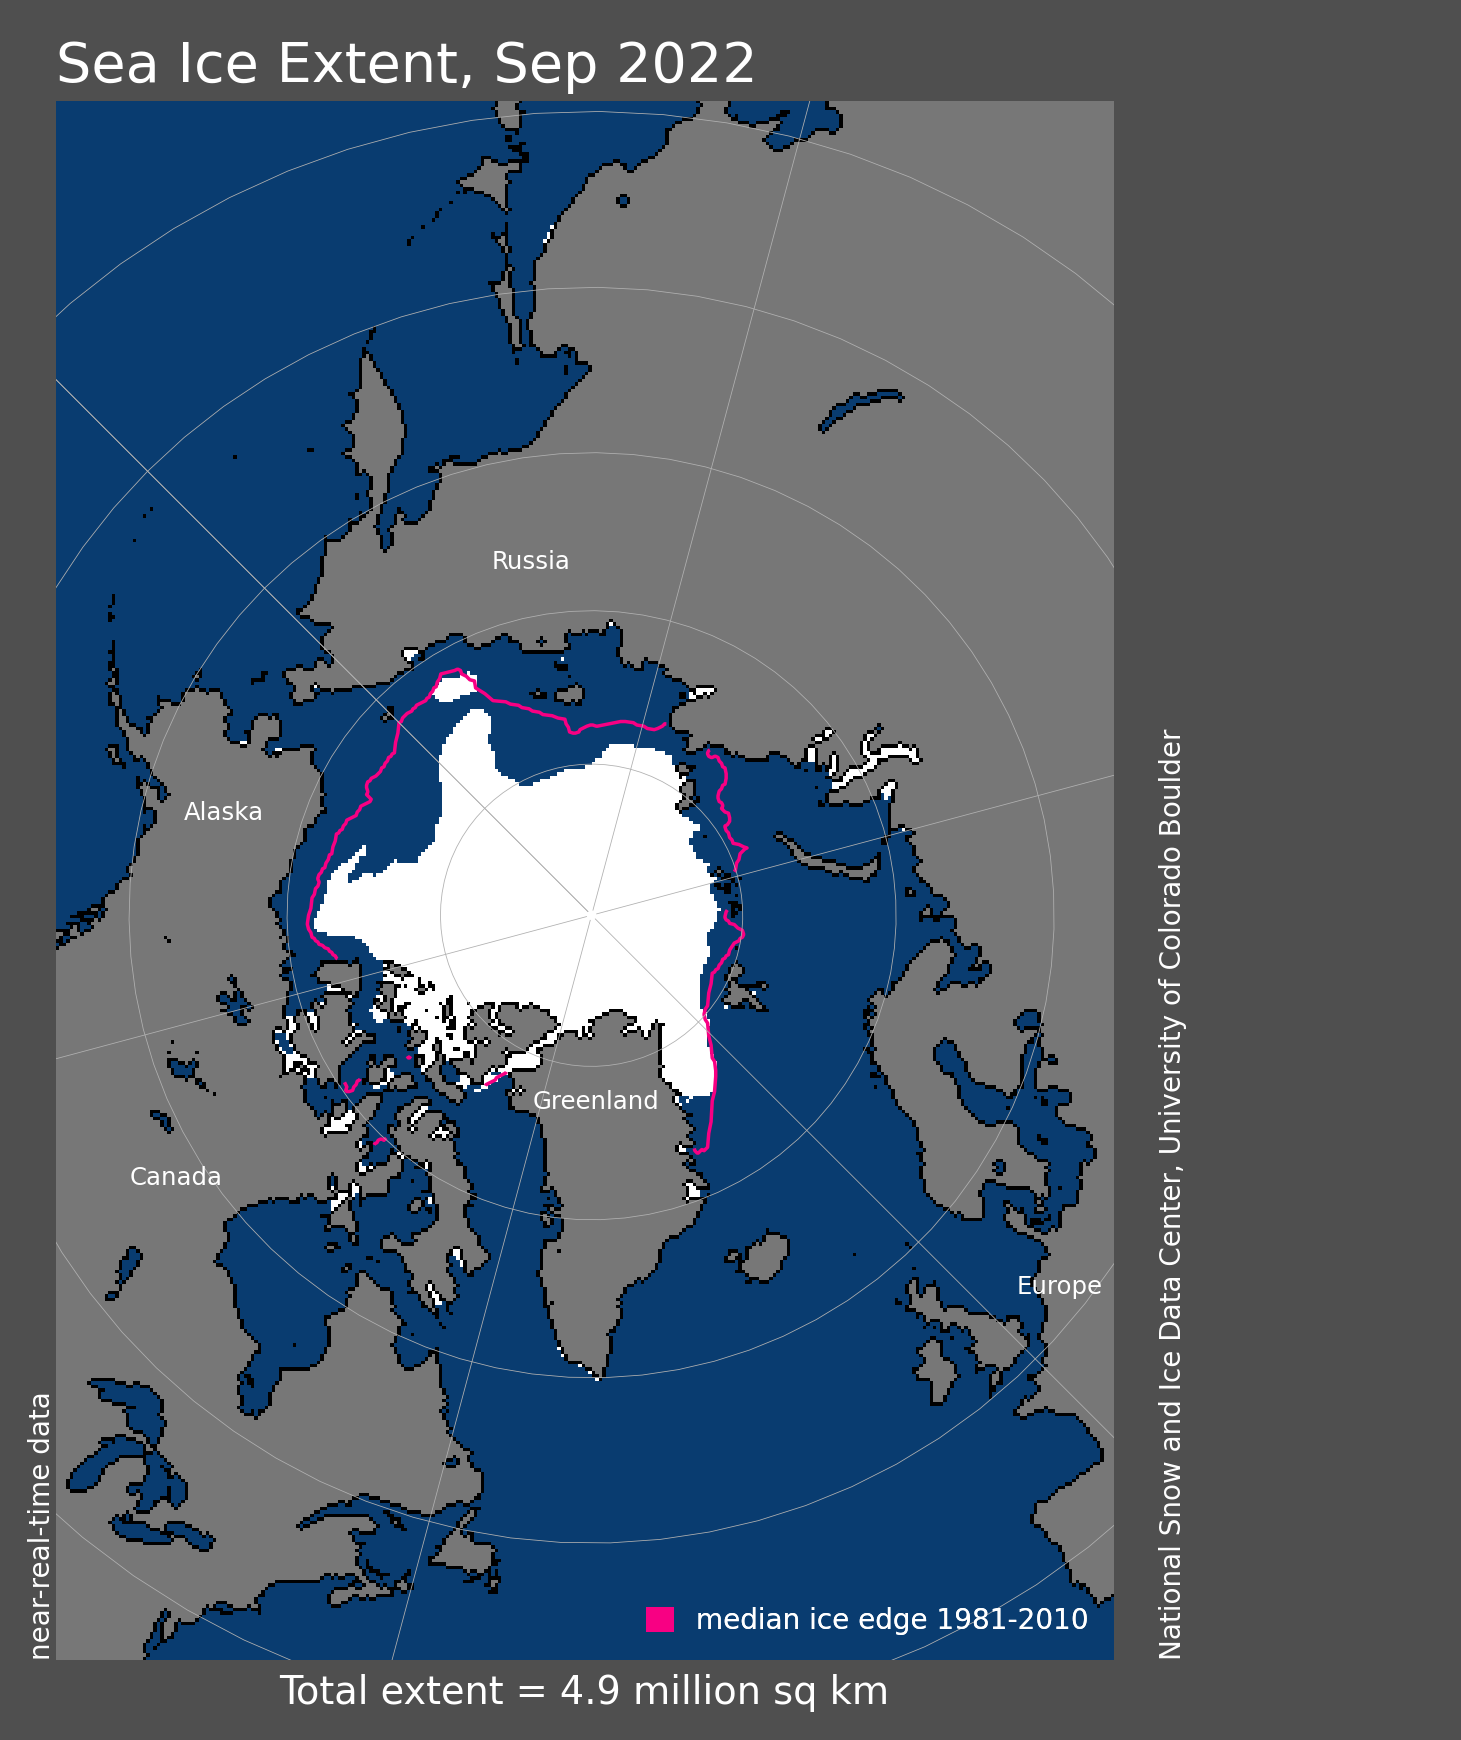
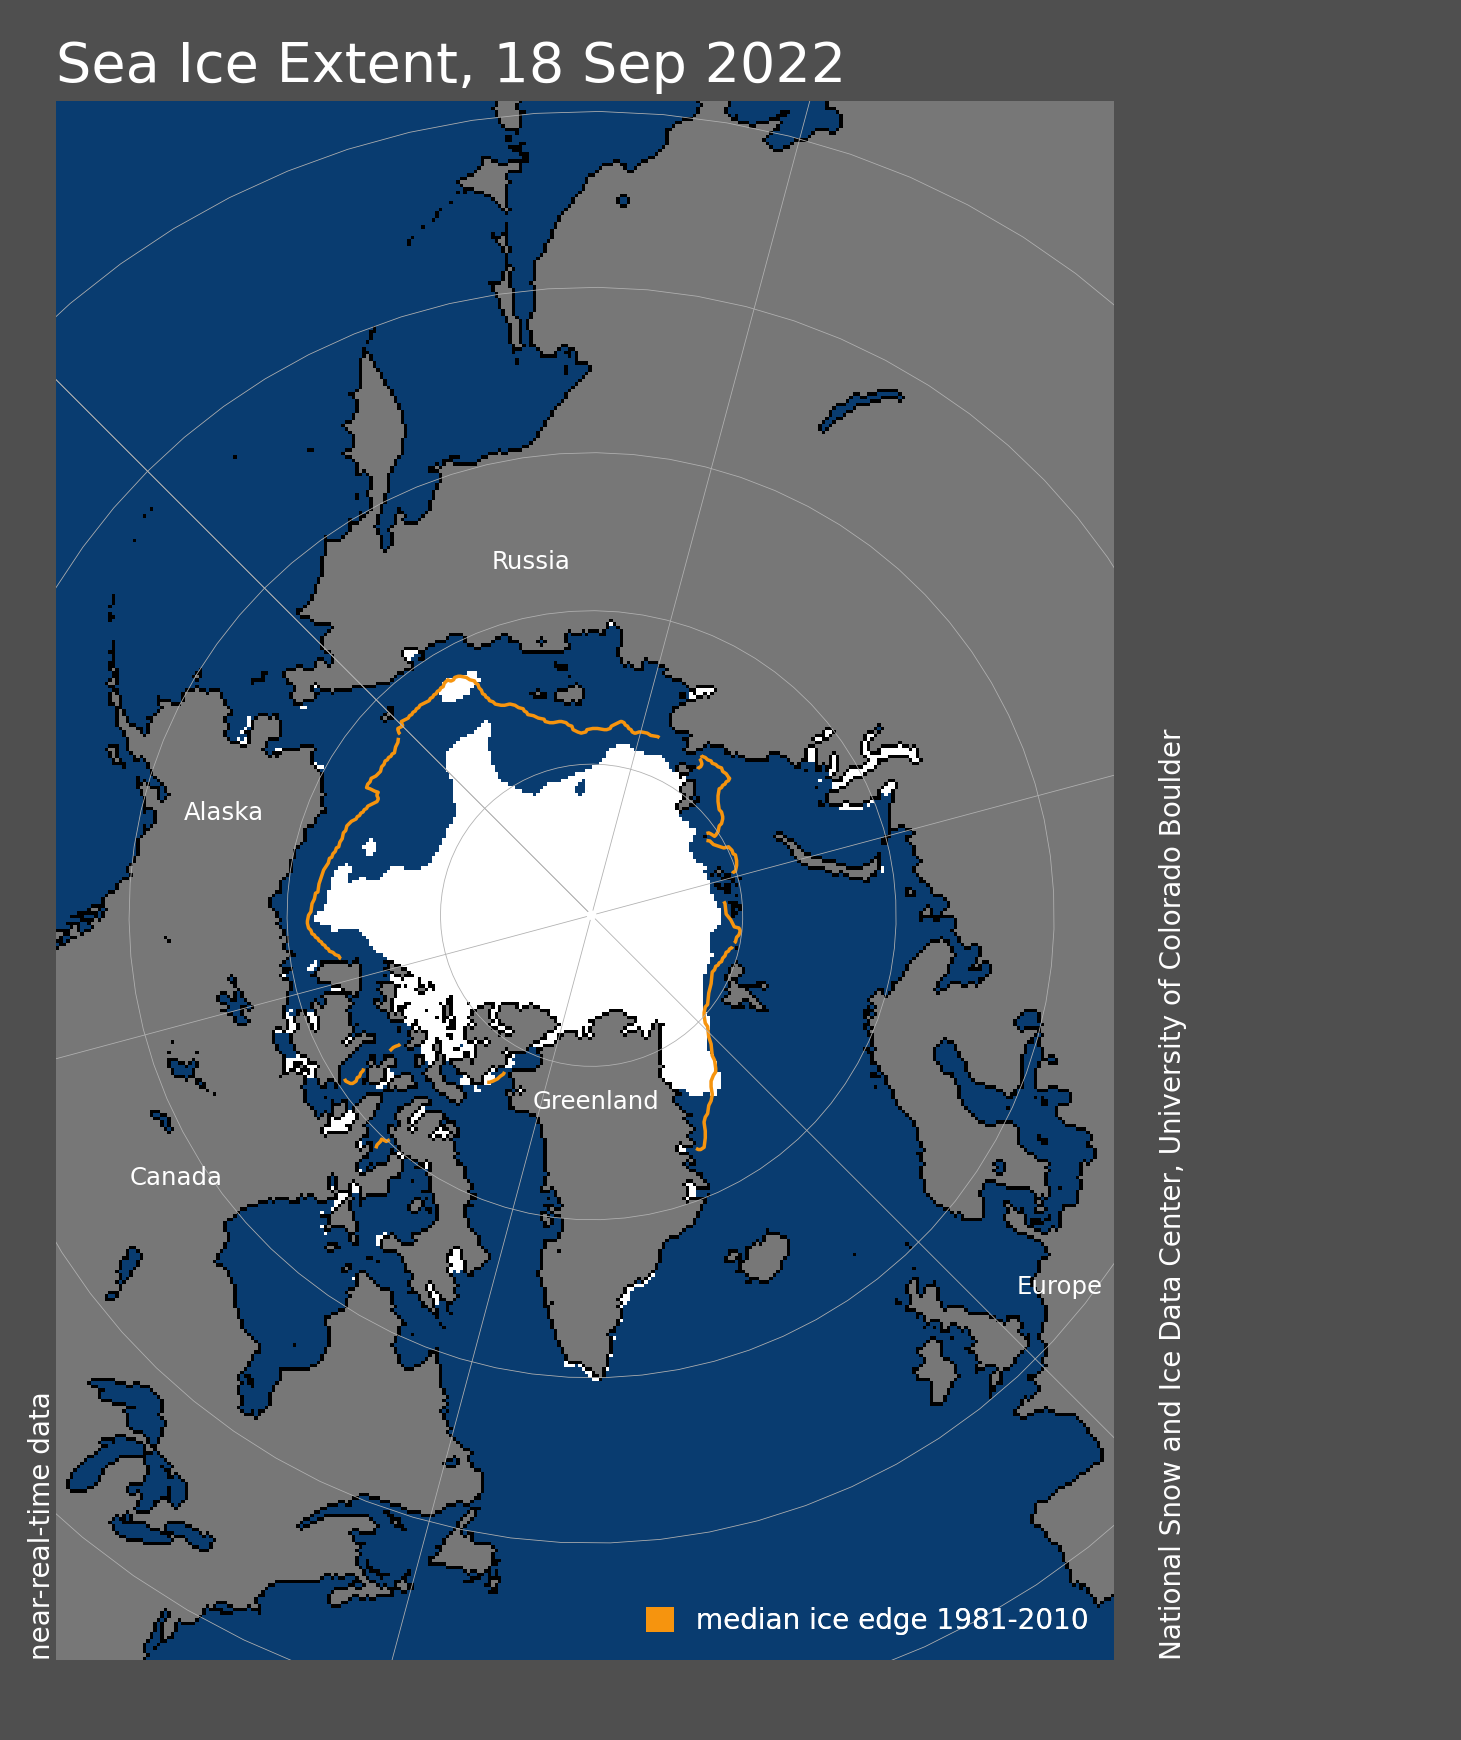
Figure 1a. Arctic sea ice extent for July 2023 was 8.18 million square kilometers (3.16 million square miles). The magenta line shows the 1981 to 2010 average extent for that month. Sea Ice Index data. About the data
Credit: National Snow and Ice Data Center
High-resolution image
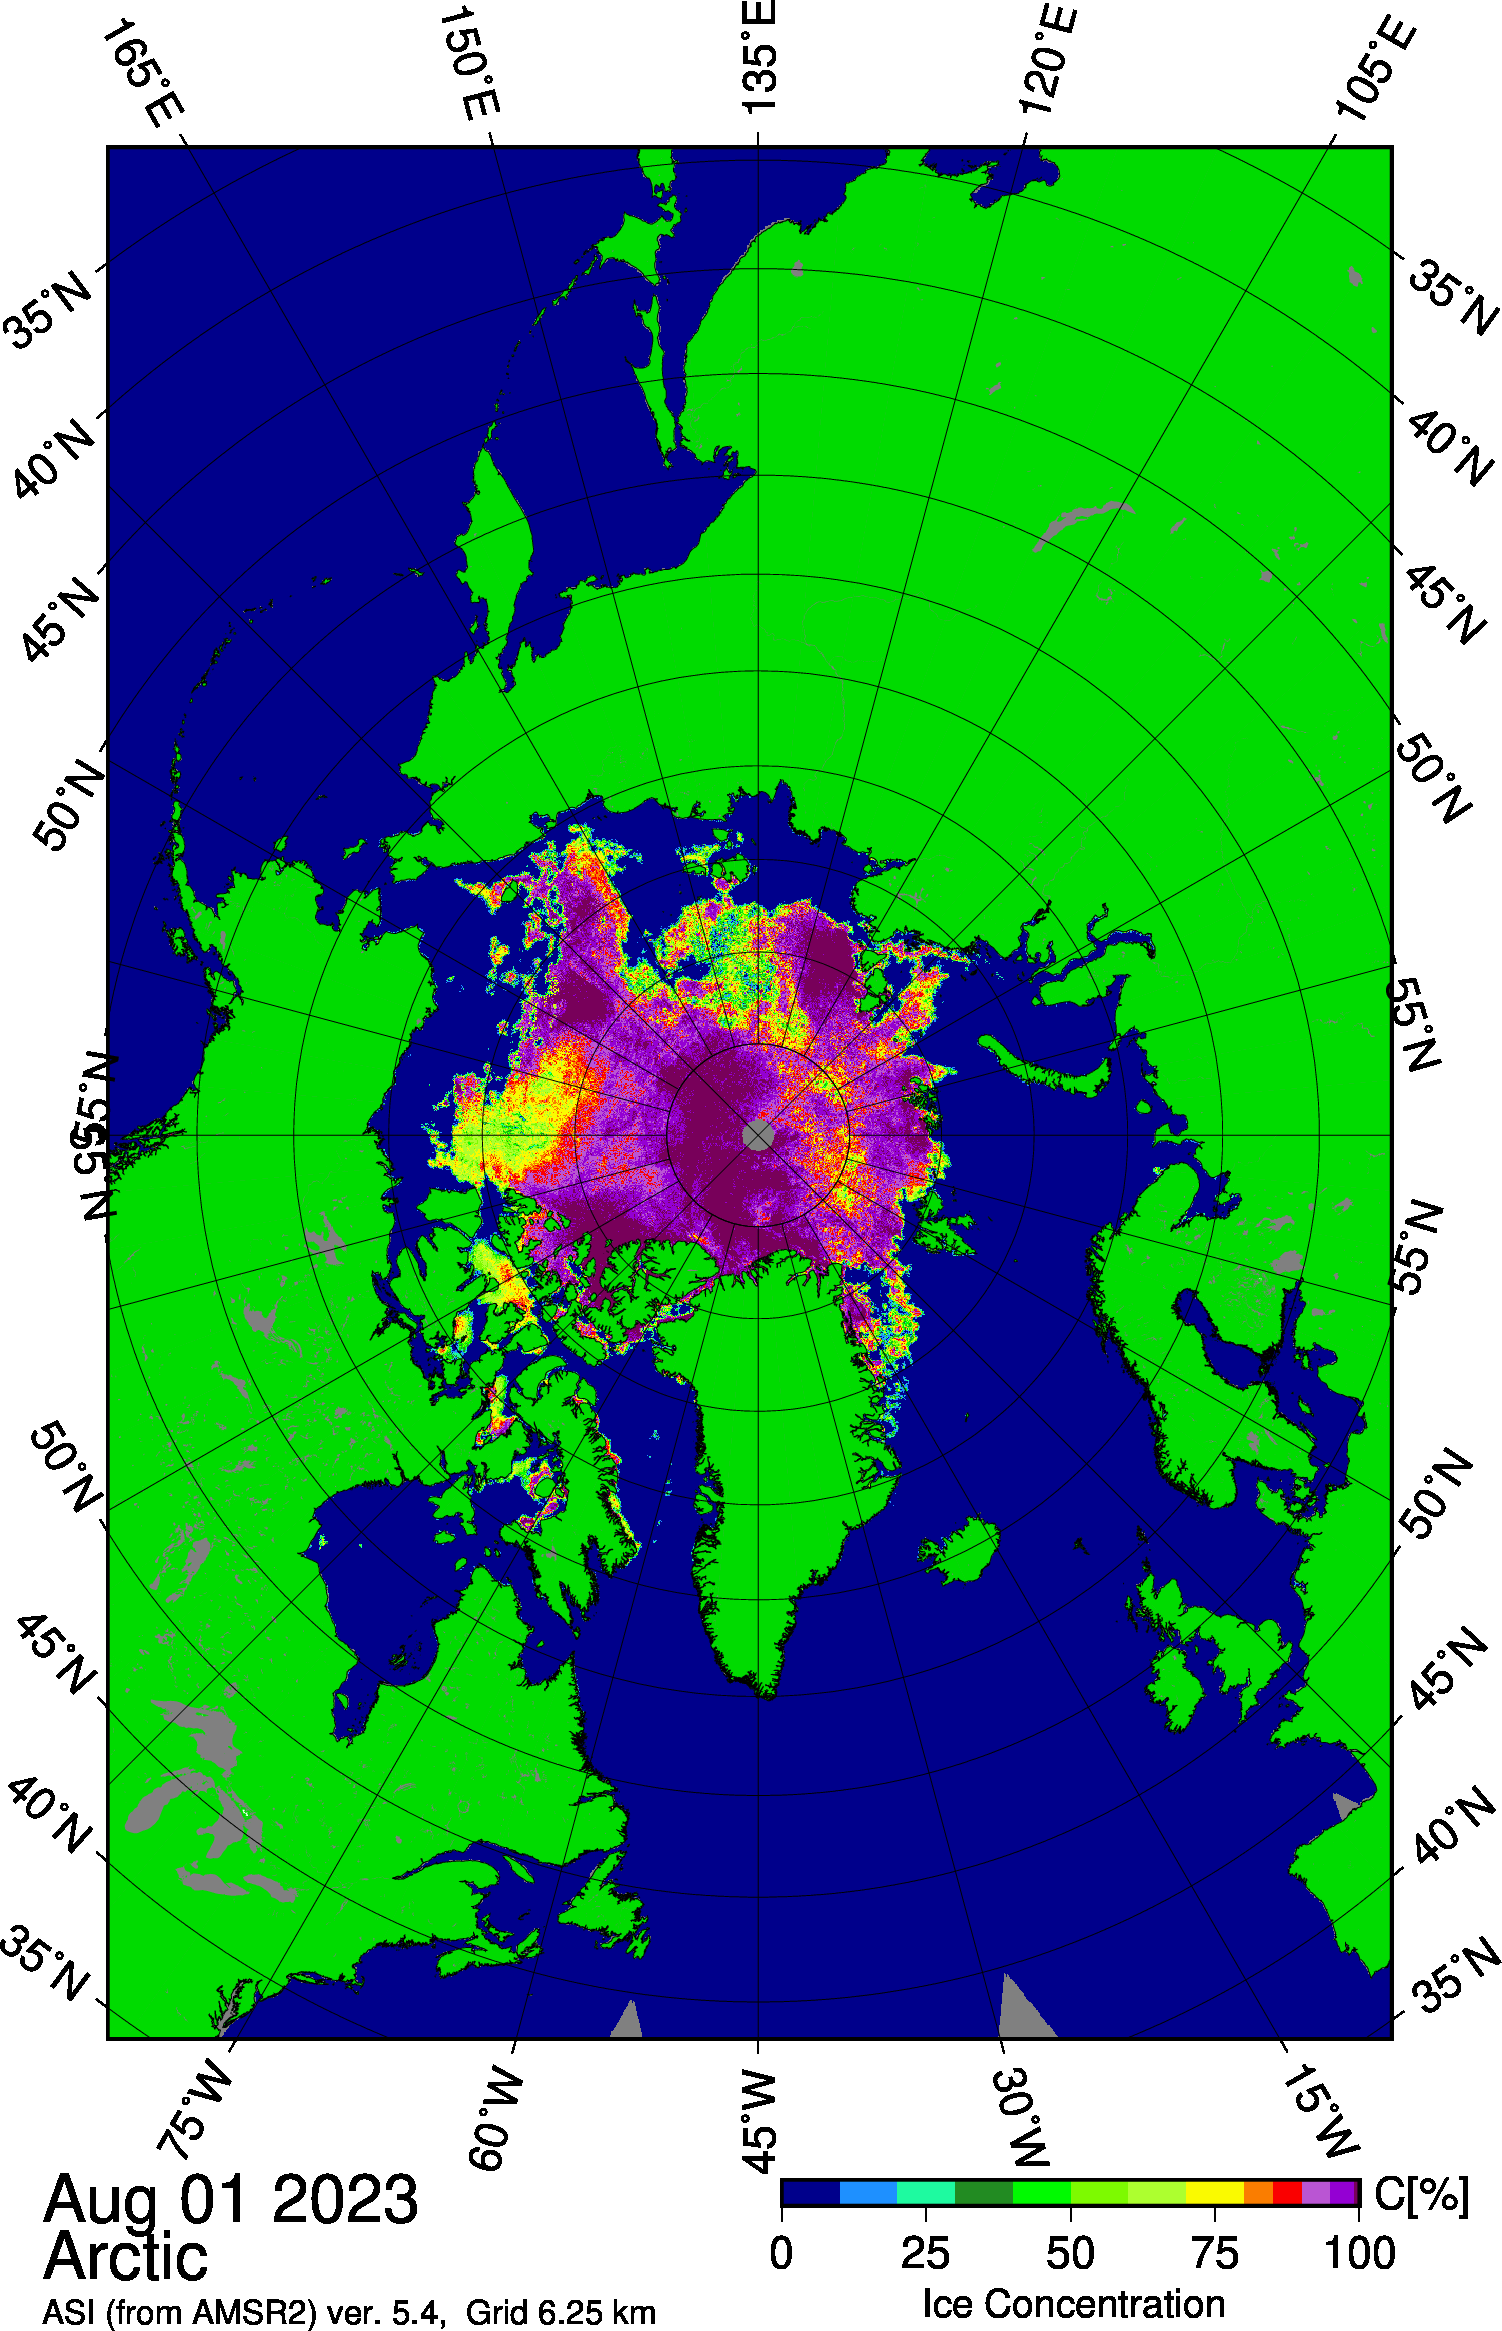
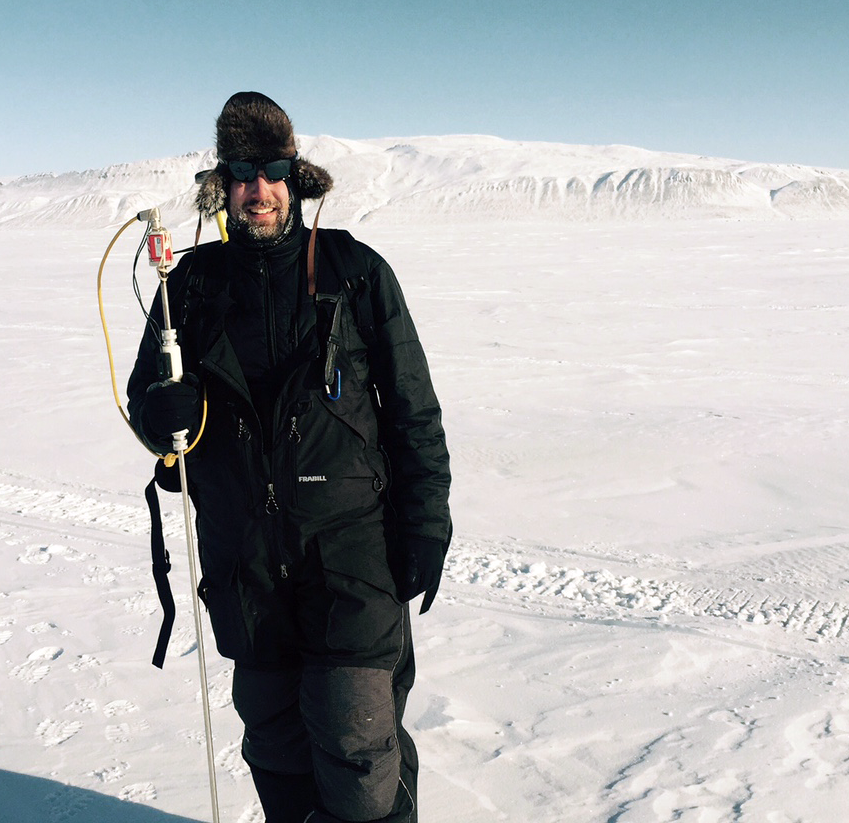
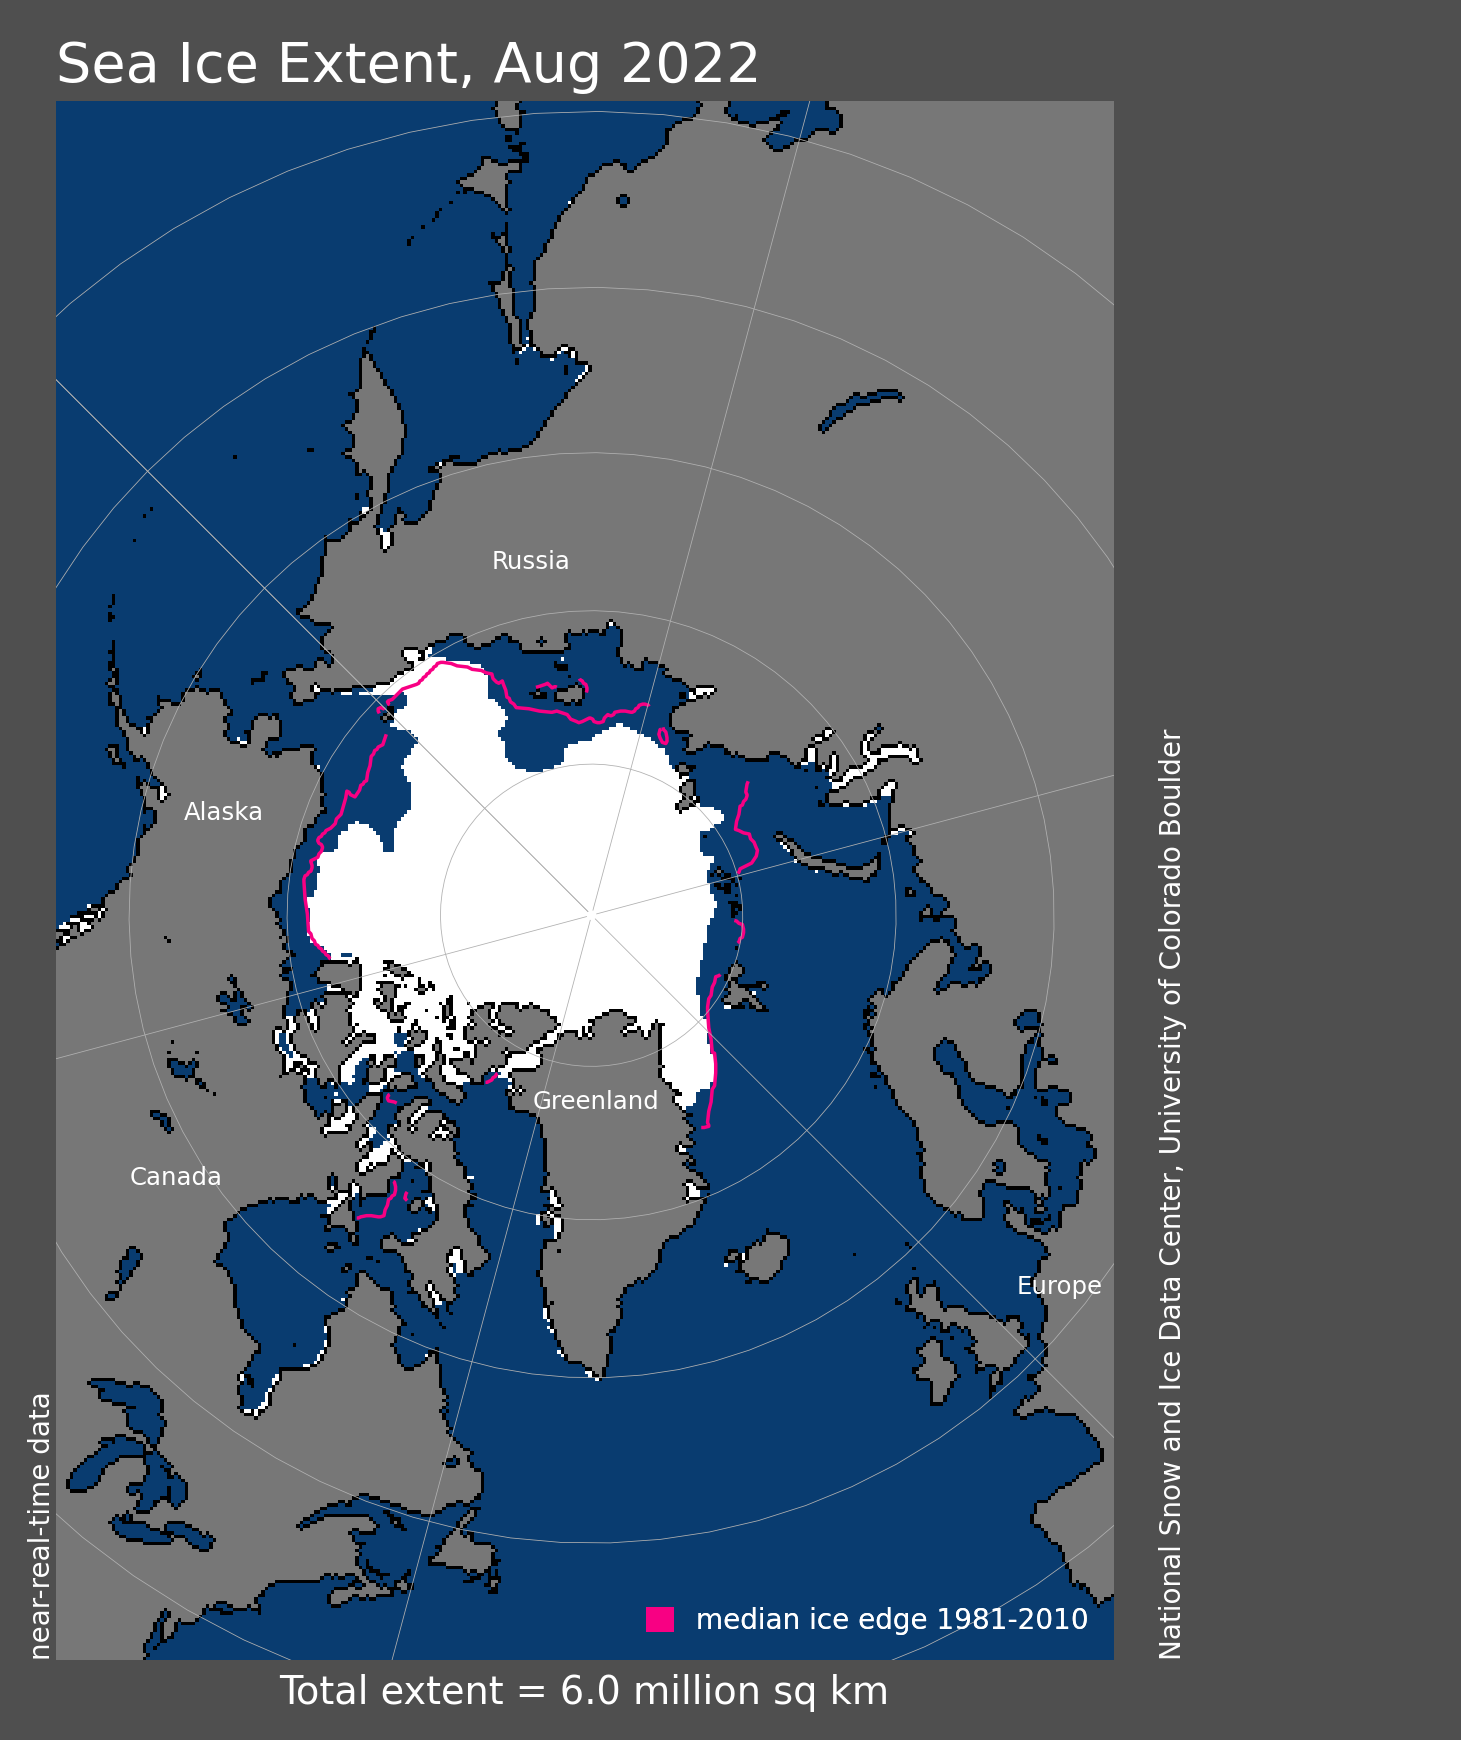
Figure 1b. This map shows a large opening on August 1, 2023, in the Laptev and East Siberian Seas and extensive open water north of Alaska and the Mackenzie River Delta. Sea ice concentration data are from Advanced Microwave Scanning Radiometer 2 (AMSR2) imagery.
Credit: University of Bremen
High-resolution image
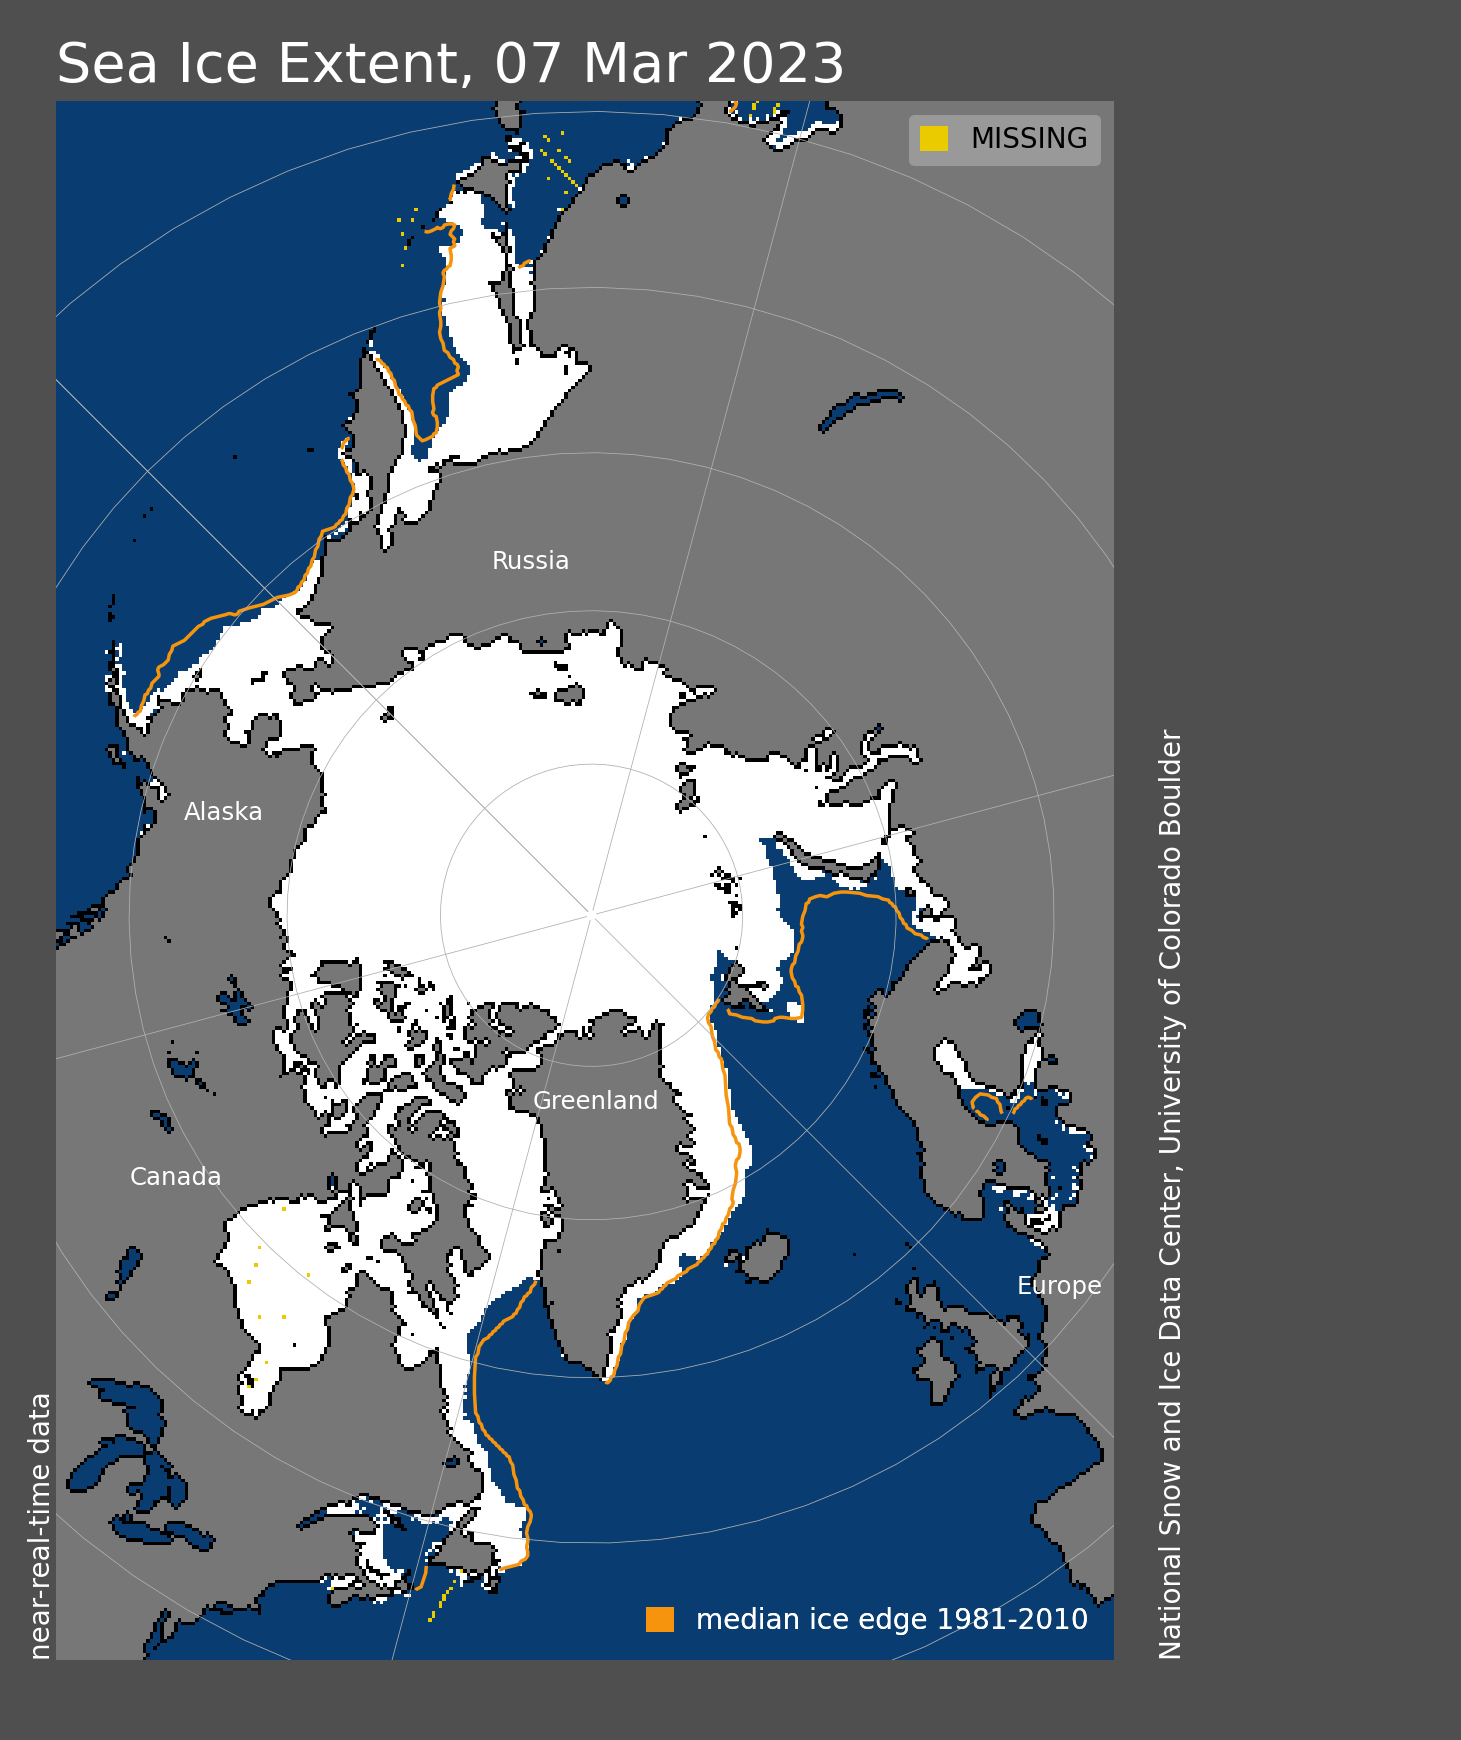
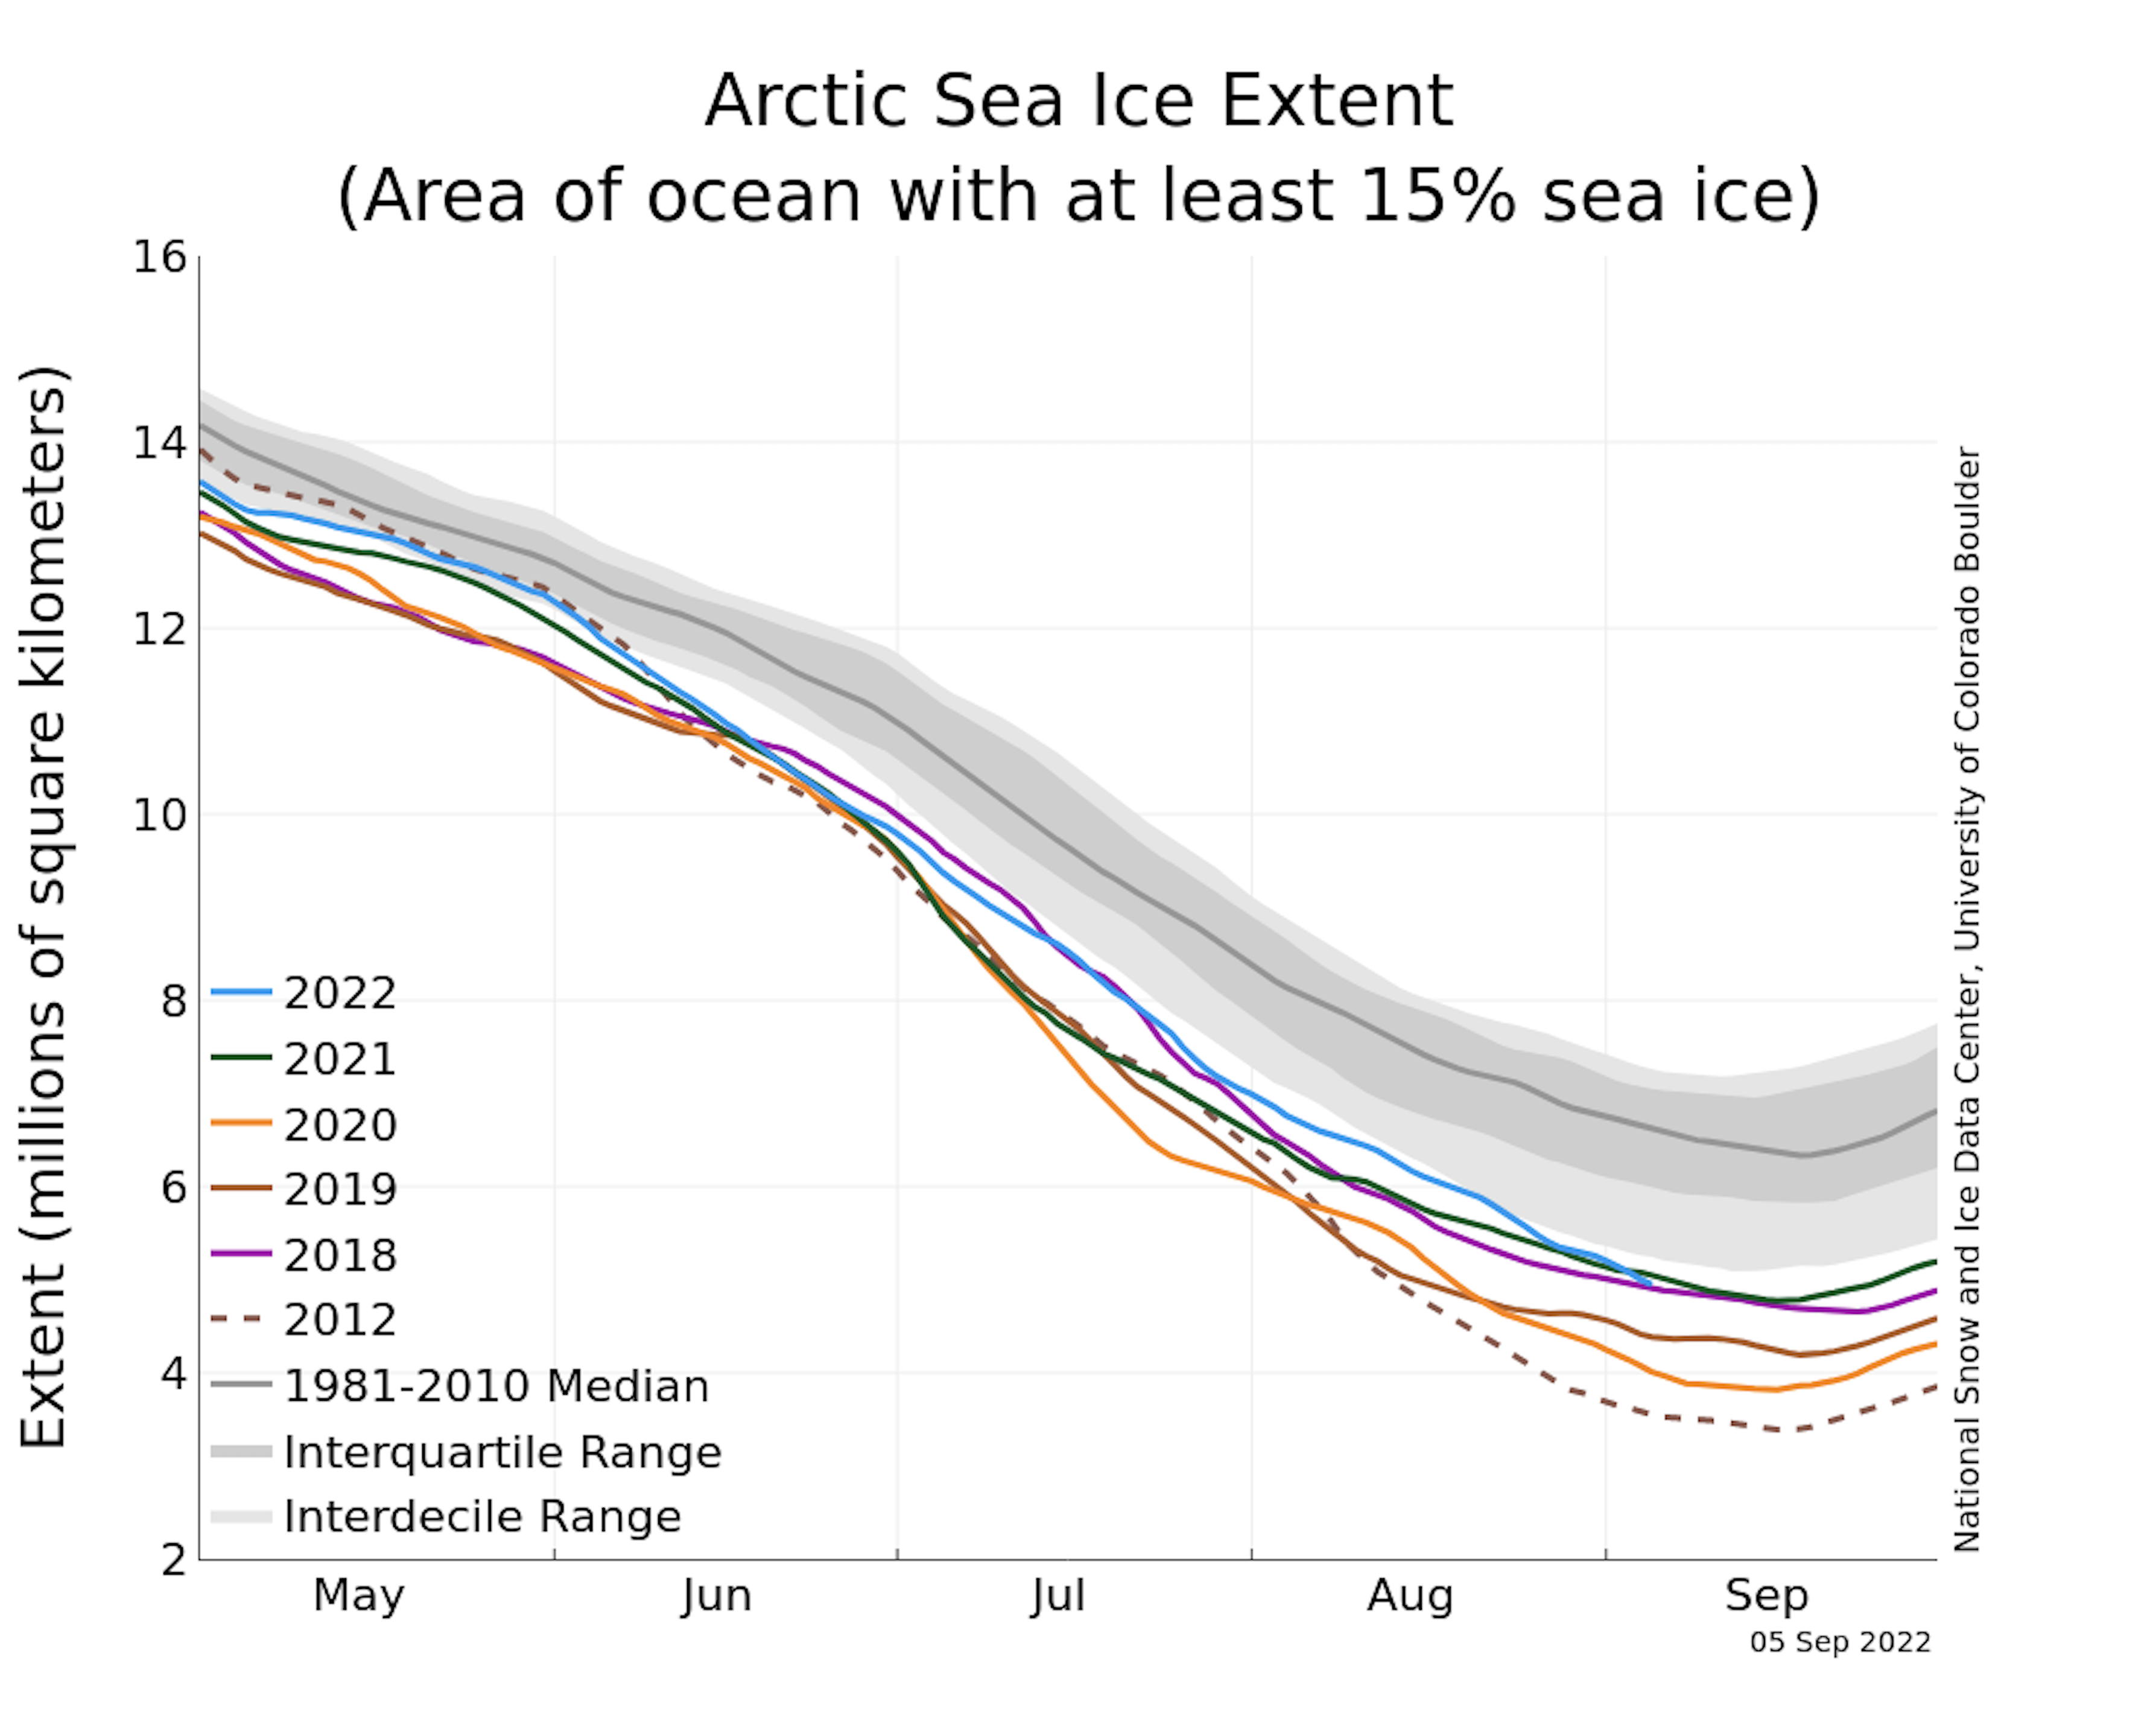
For the month of July, Arctic sea ice extent declined at a pace of 93,300 square kilometers (36,000 square miles) per day, near the 1981 to 2010 average of 86,900 square kilometers (33,600 square miles) per day (Figure 1a). The July average Arctic sea ice extent of 8.18 million square kilometers (3.16 million square miles) was the twelfth lowest in the satellite record, and 1.29 million square kilometers (498,000 square miles) below the 1981 to 2010 reference period. By stark contrast, Antarctic sea ice extent remained far below previous record daily lows throughout the month. While there is speculation that a fundamental change in the Antarctic sea ice system is afoot, there is some evidence from early satellite data that extent may have been similarly low in 1966.
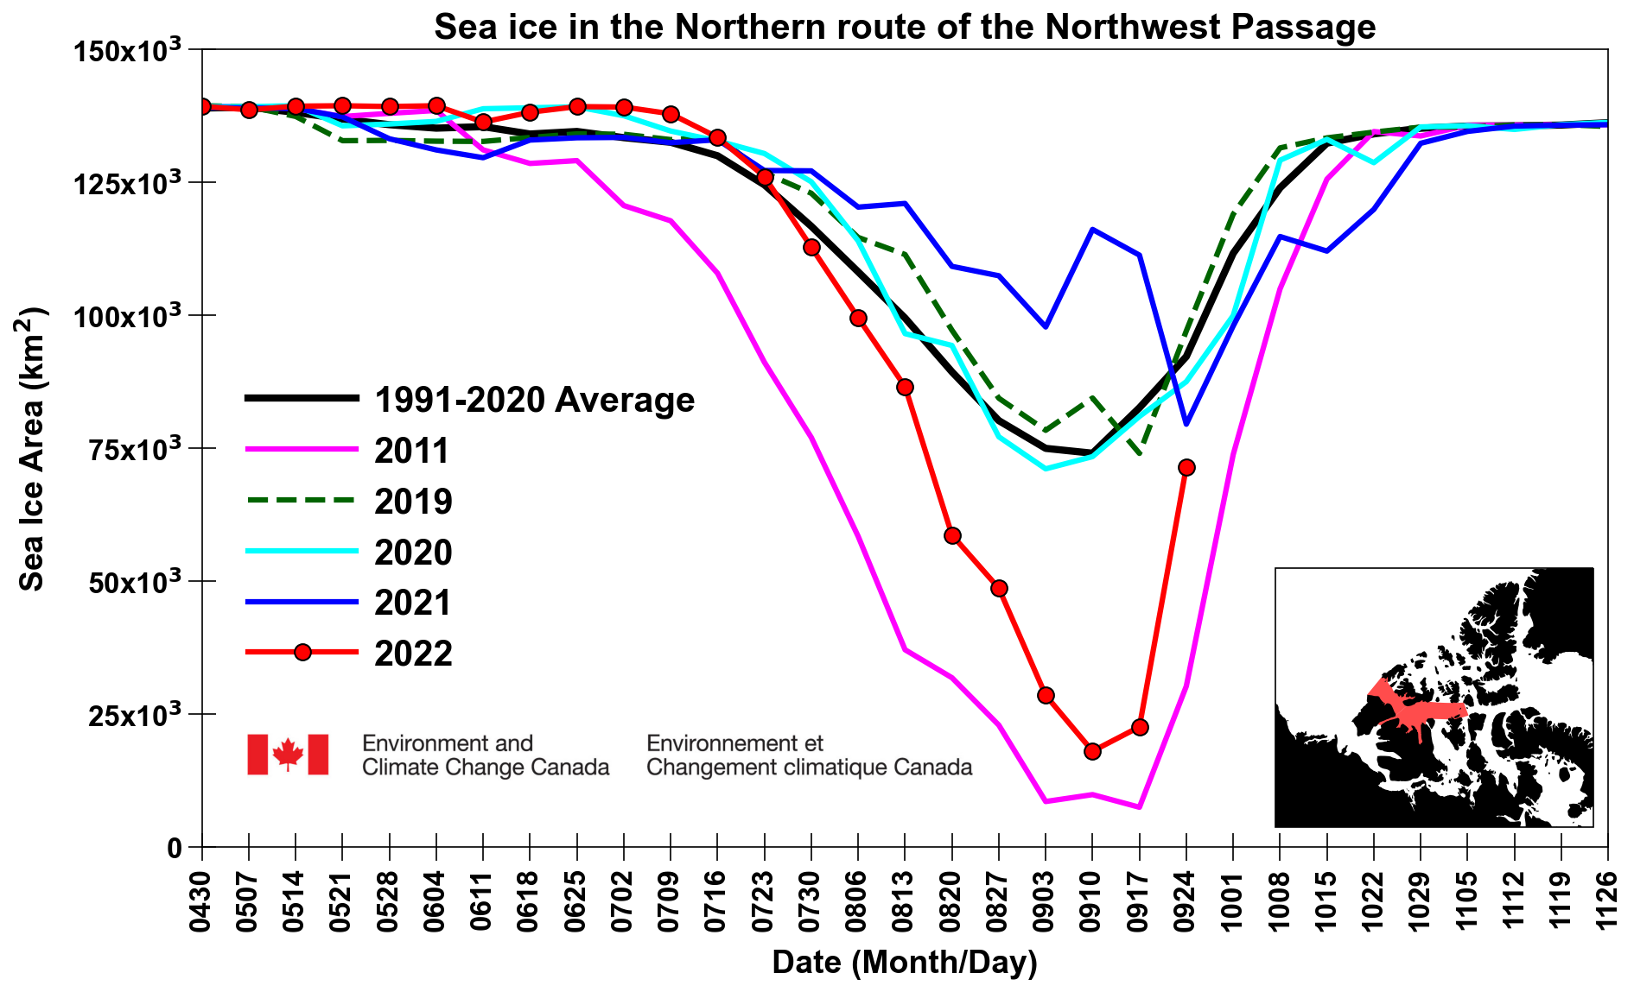
The sea ice concentration image on August 1, 2023, from the Advanced Microwave Scanning Radiometer 2 (AMSR2) offers a detailed view of Arctic sea ice conditions (Figure1b). Large parts of the Laptev and East Siberian seas are largely ice free, and a large area of fairly low ice concentration extends north of the Laptev Sea. However, ice is still present along much of the Northern Sea Route, noting of course that Russian ice breakers are quite capable of keeping routes open. The ice edge has retreated to well north of the Alaskan and Mackenzie Delta coasts, but it is clear that the southern (Amundsen’s) route through the Northwest Passage is still choked with ice. To date since July 1, 2.86 million square kilometers (1.10 million square miles) of sea ice have melted.
Conditions in context
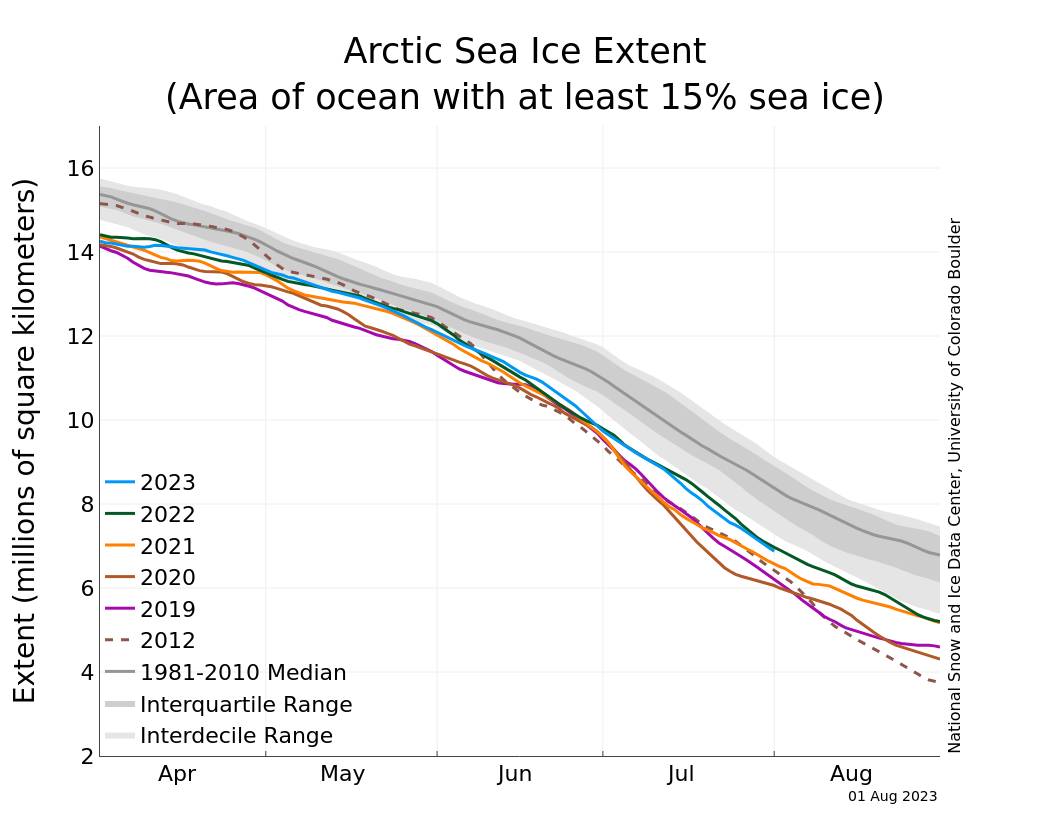
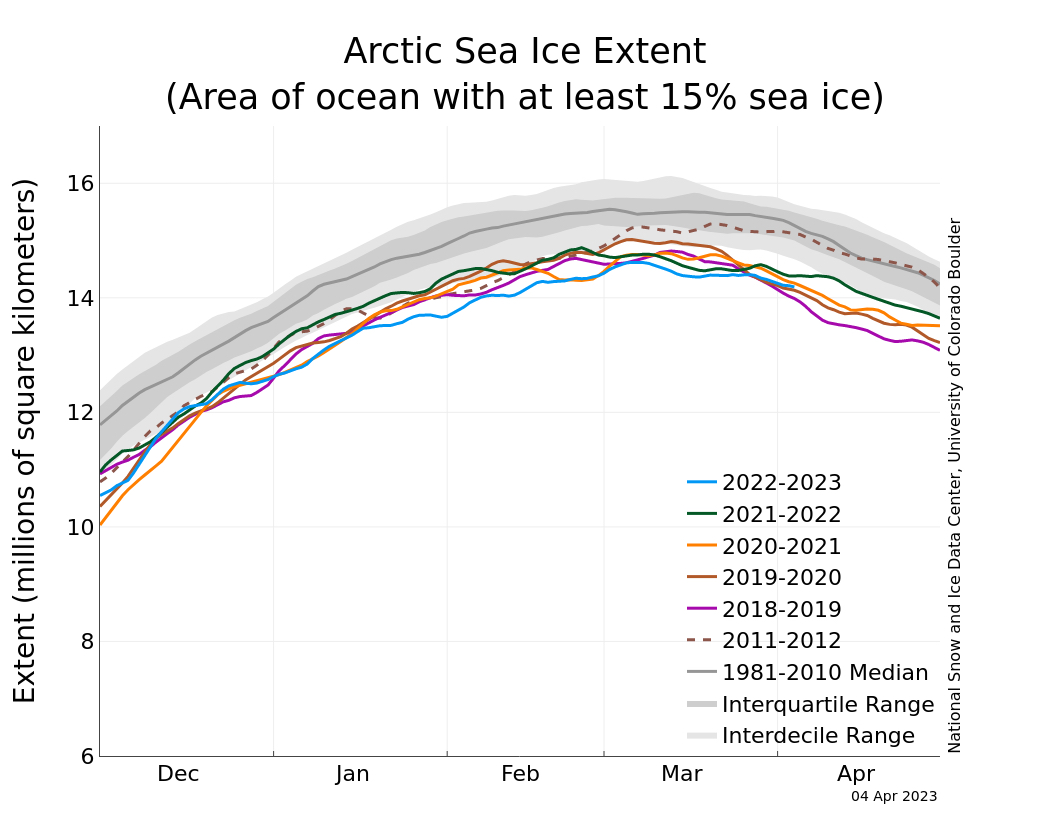
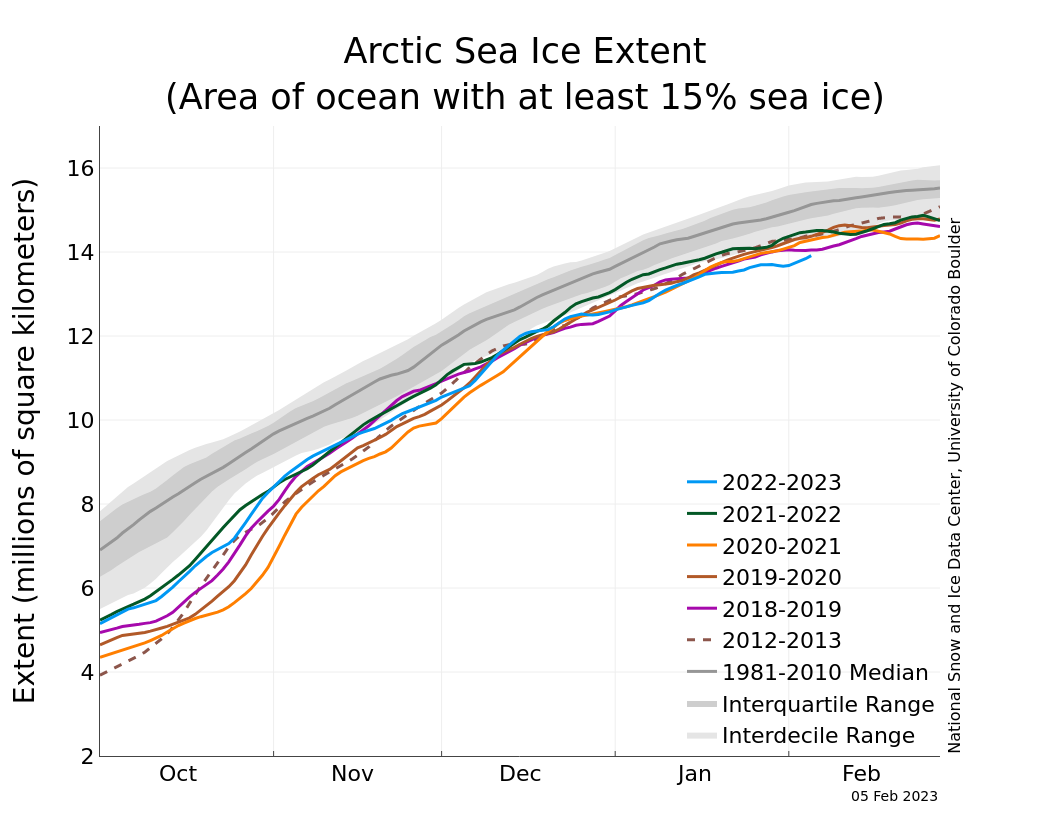
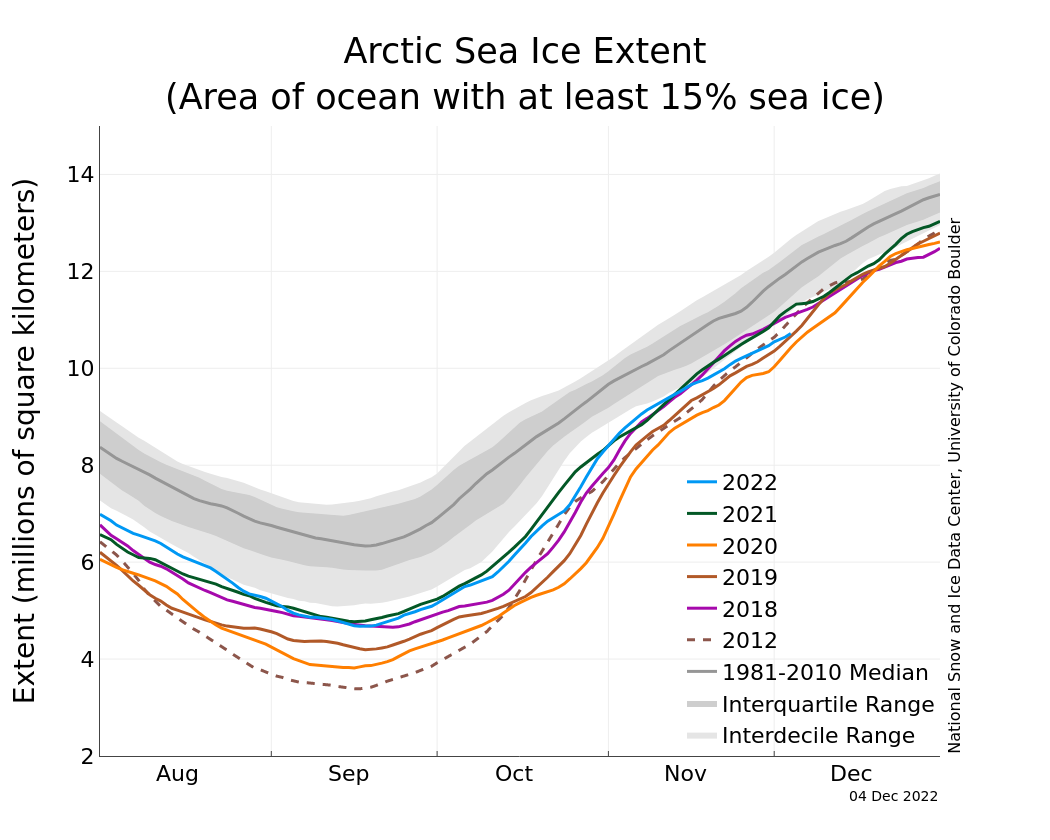
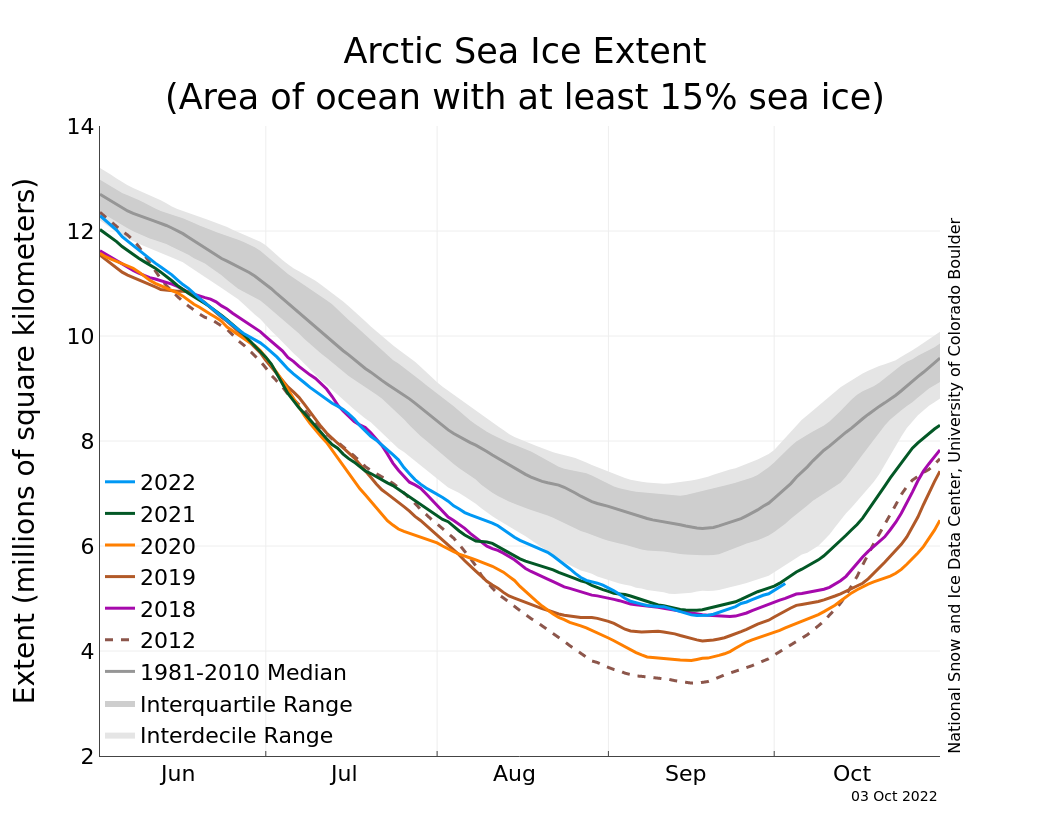
Figure 2a. The graph above shows Arctic sea ice extent as of August 1 2023, along with daily ice extent data for four previous years and the record low year. 2023 is shown in blue, 2022 in green, 2021 in orange, 2020 in brown, 2019 in magenta, and 2012 in dashed brown. The 1981 to 2010 median is in dark gray. The gray areas around the median line show the interquartile and interdecile ranges of the data. Sea Ice Index data.
Credit: National Snow and Ice Data Center
High-resolution image
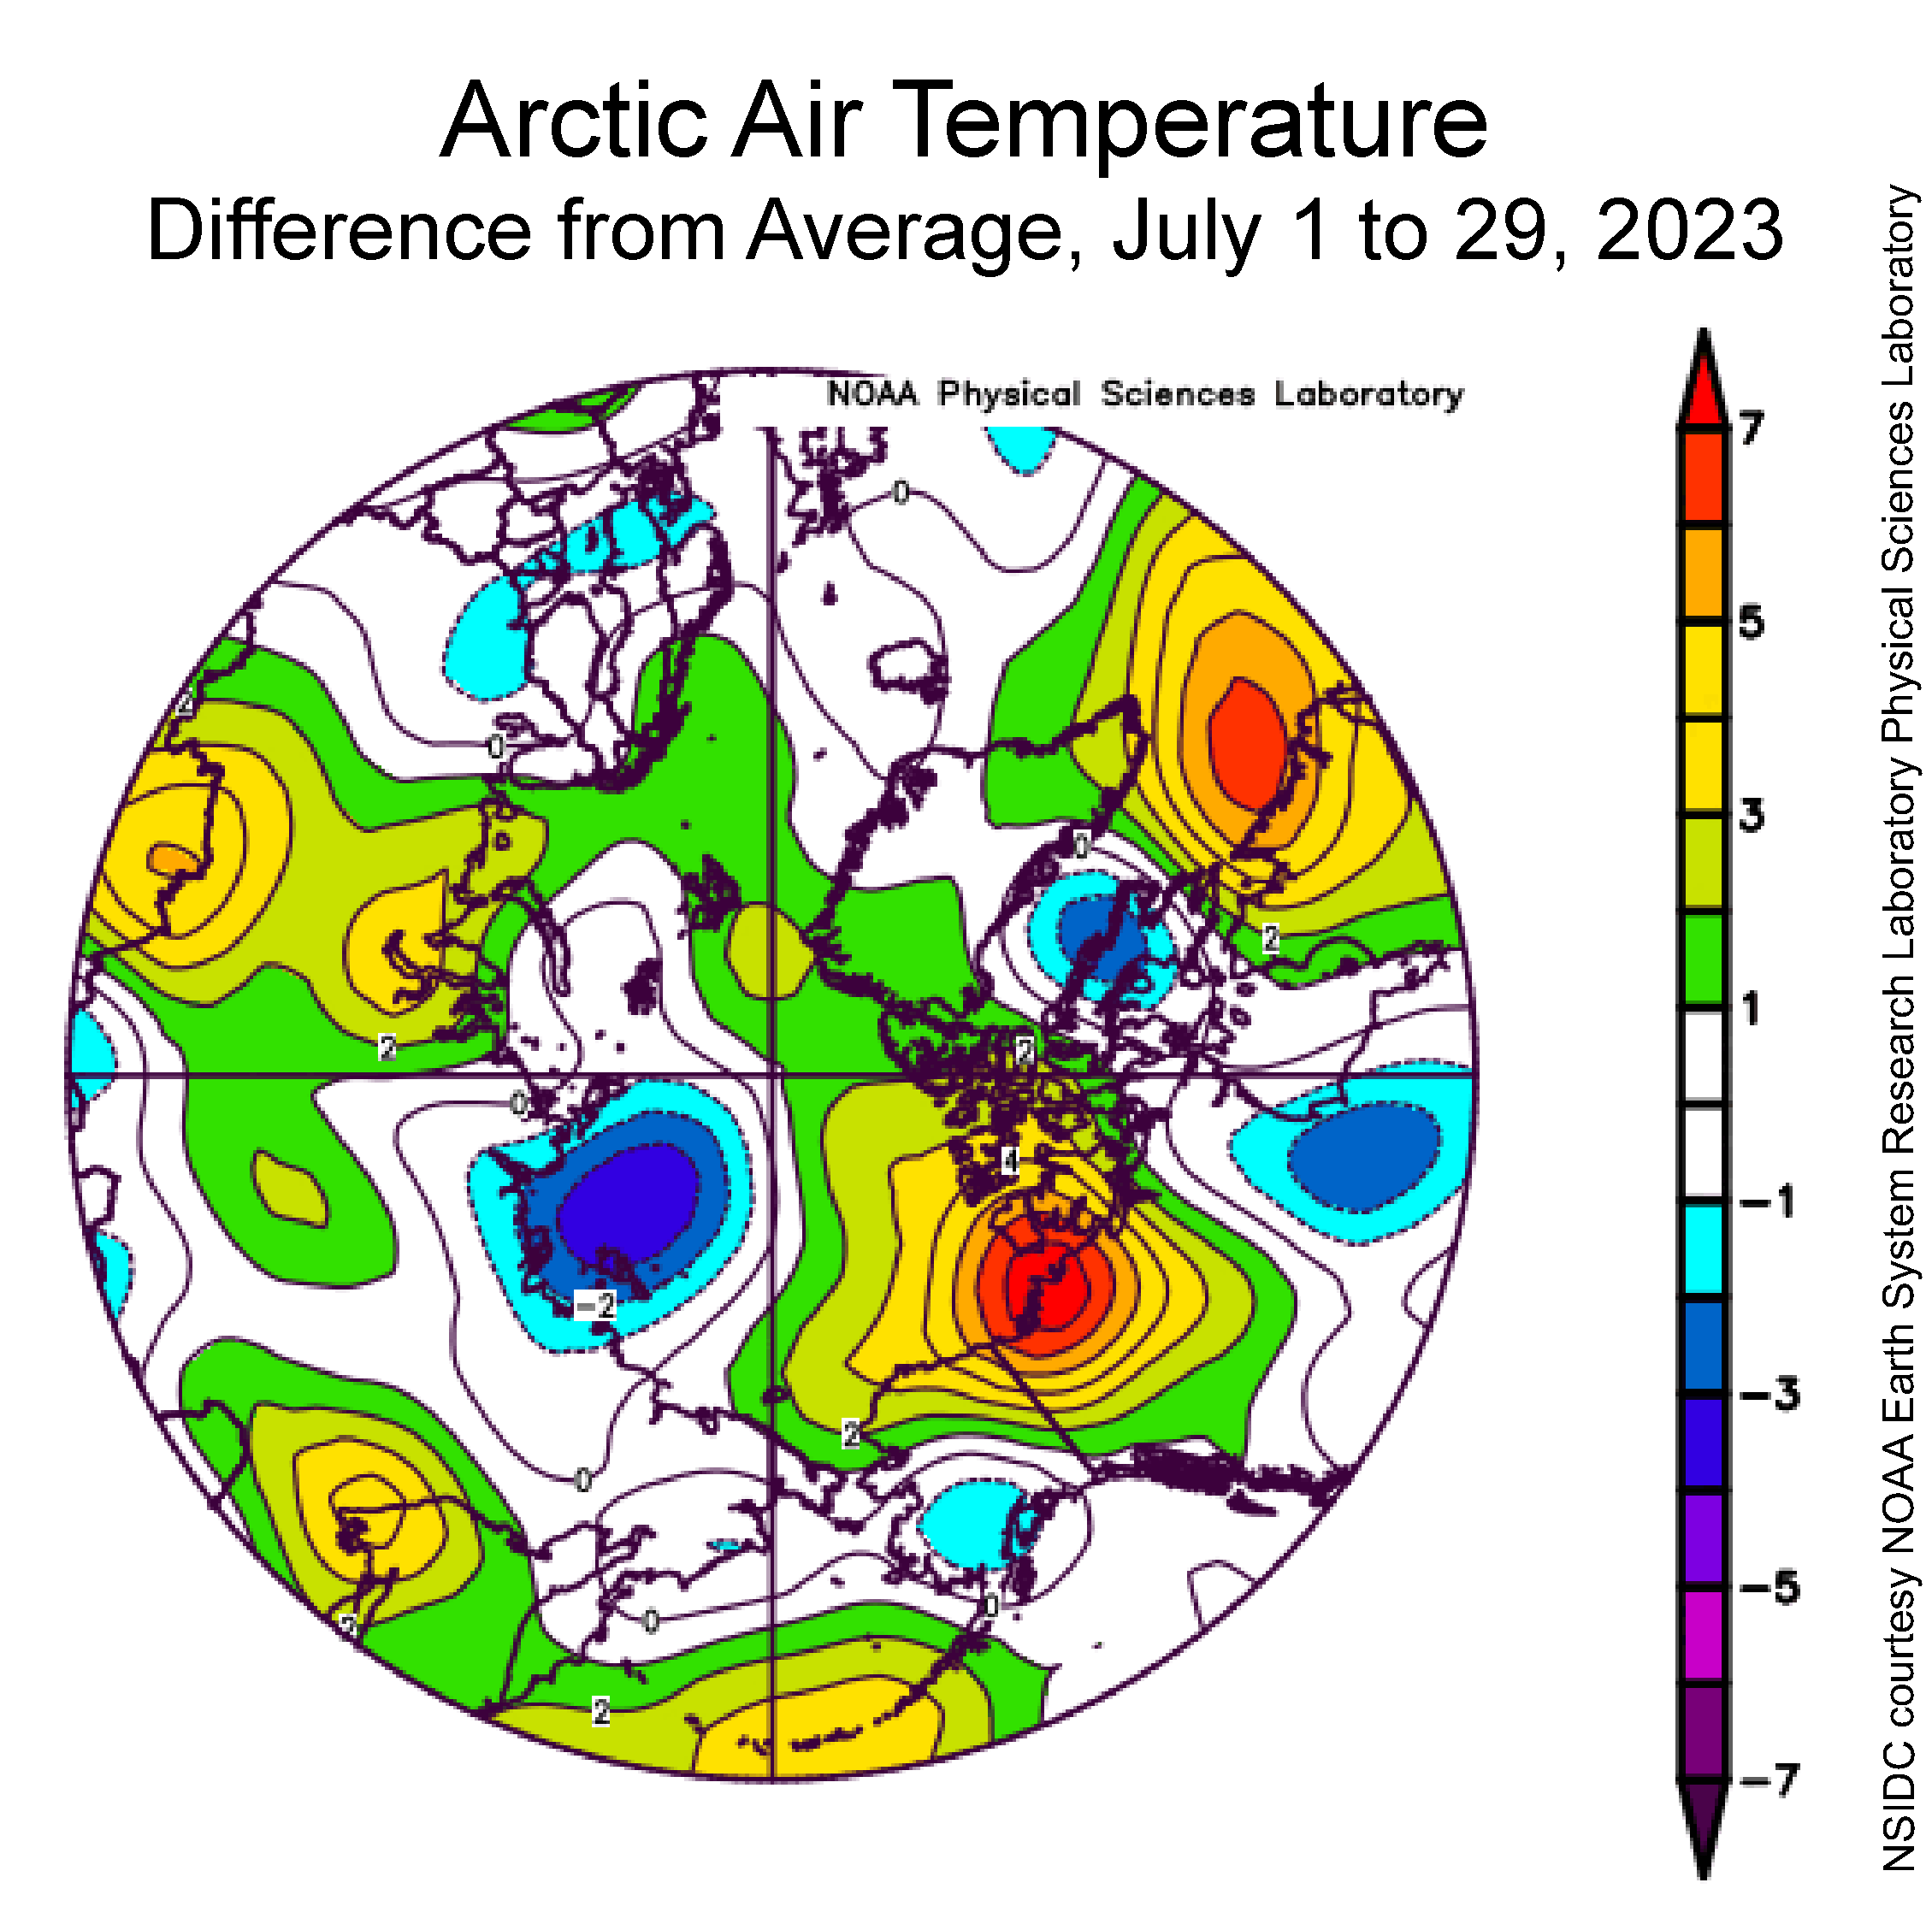
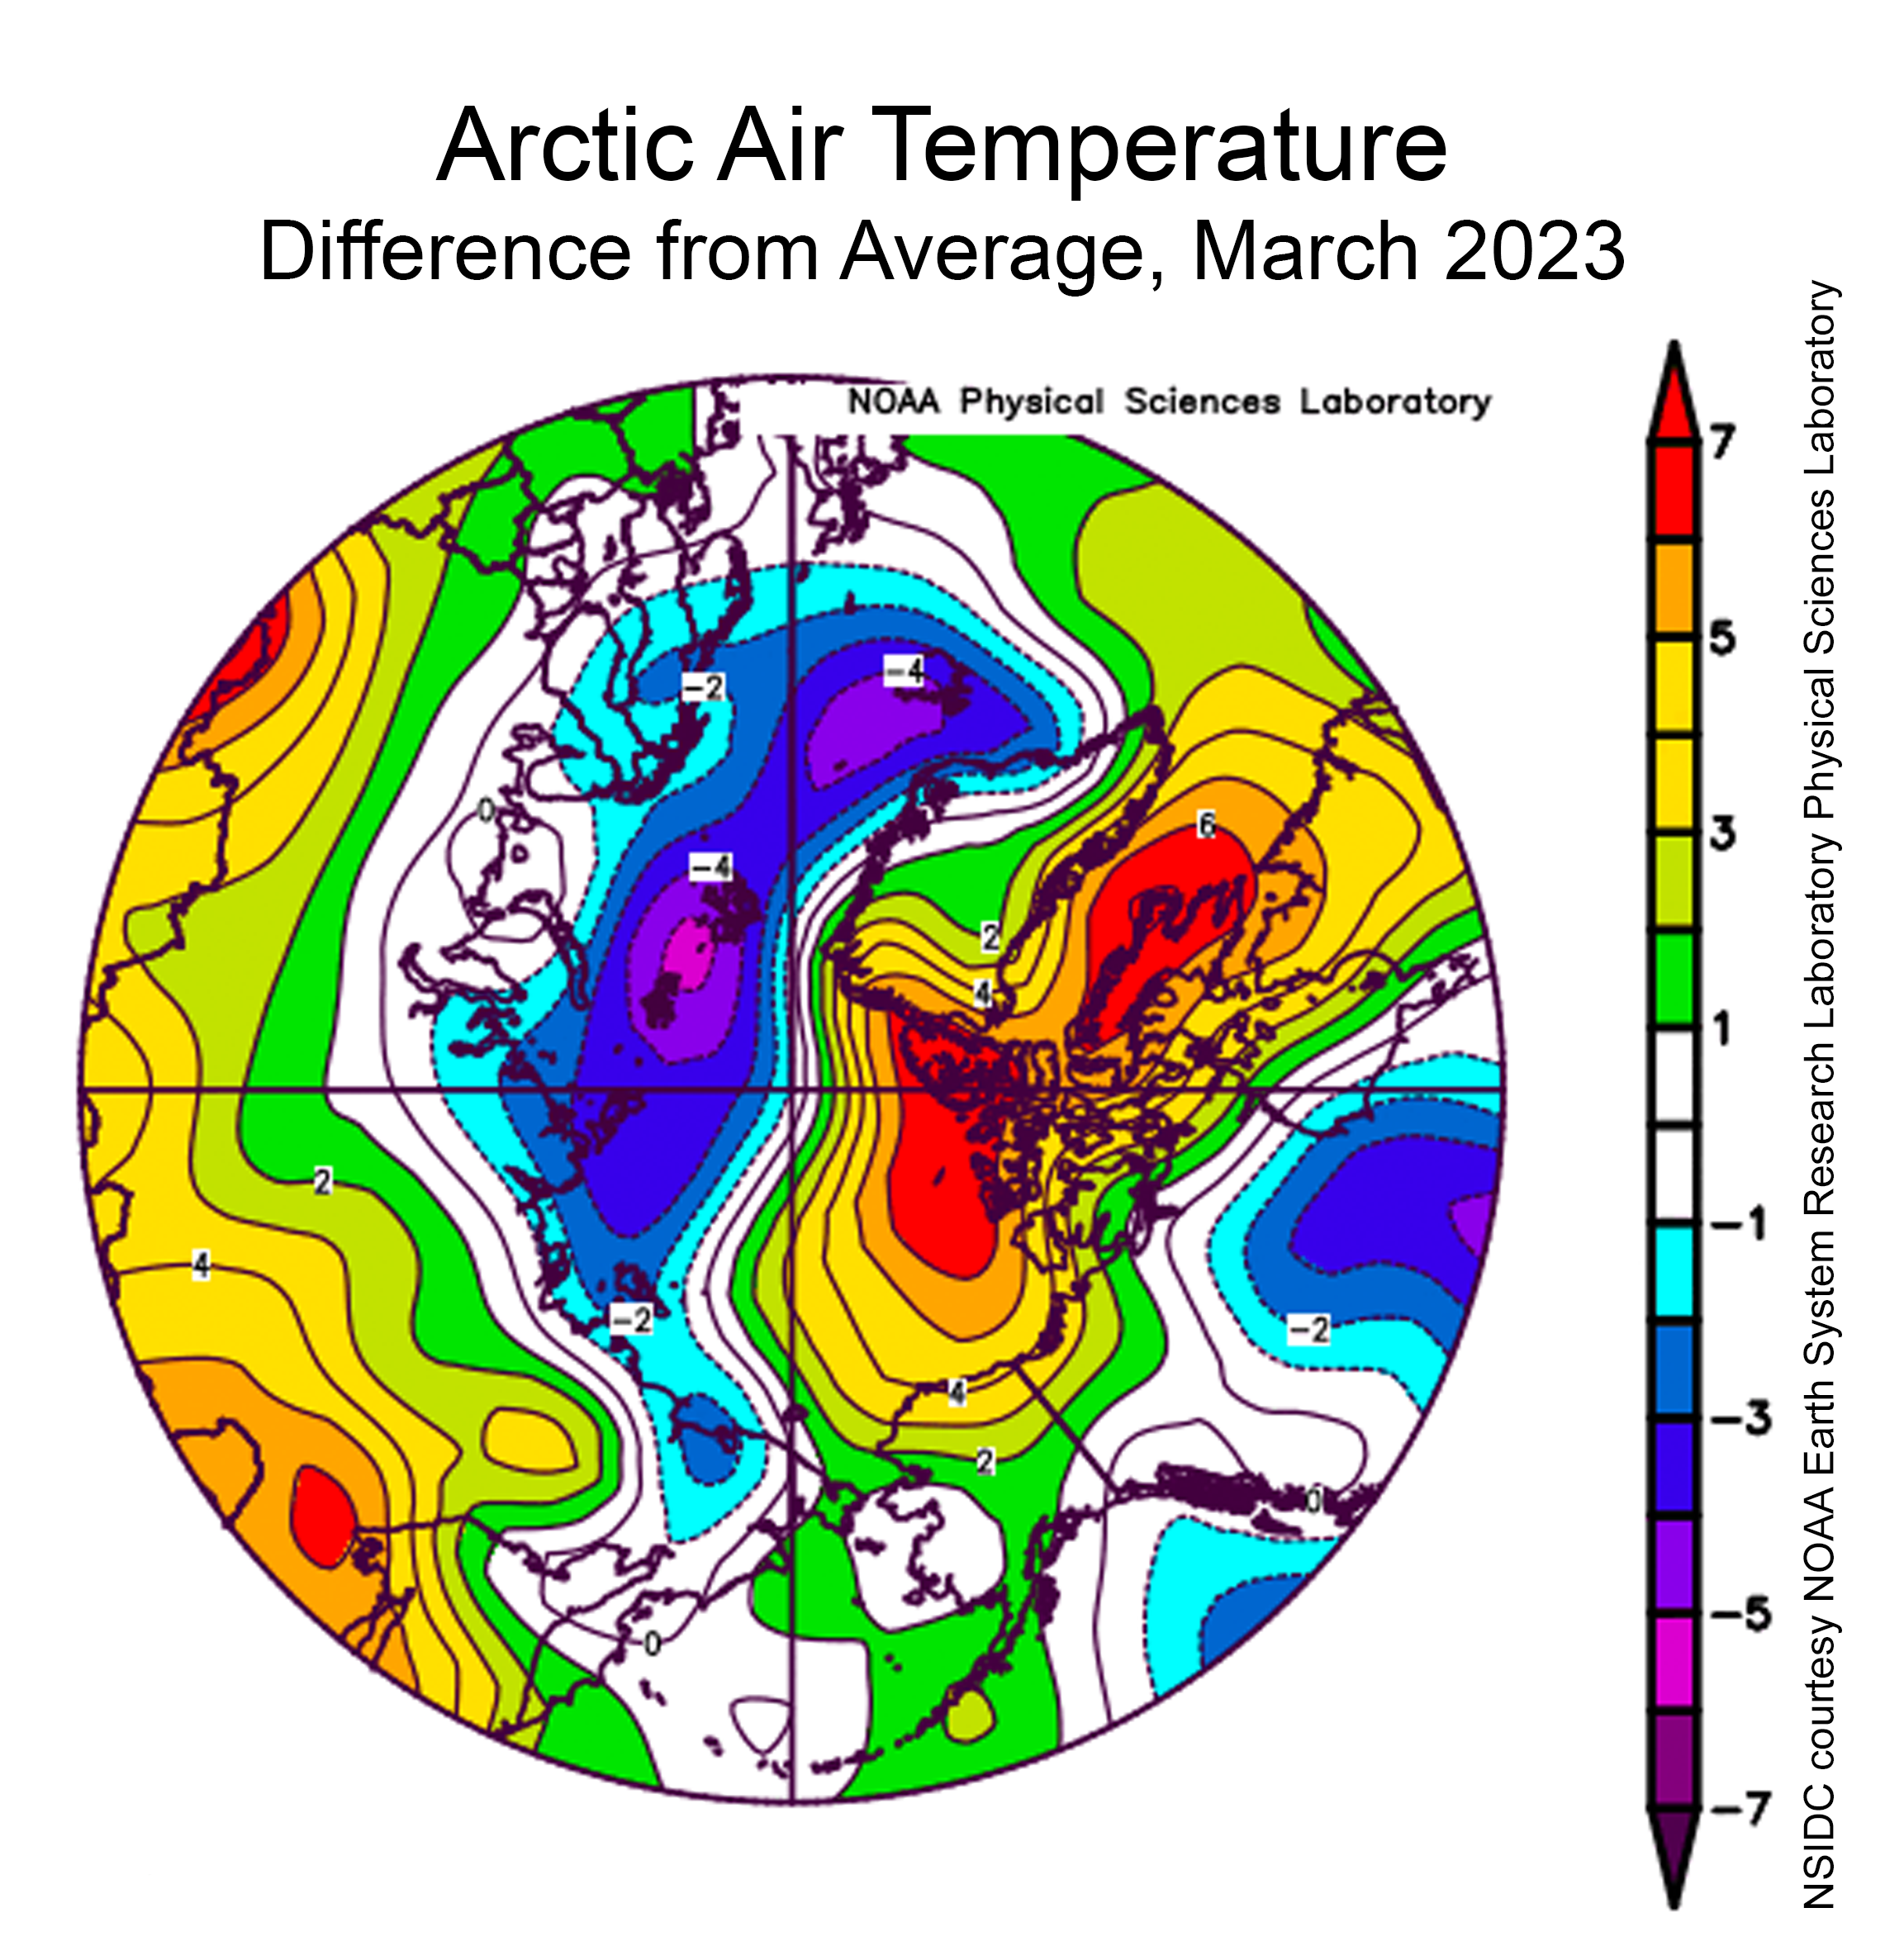
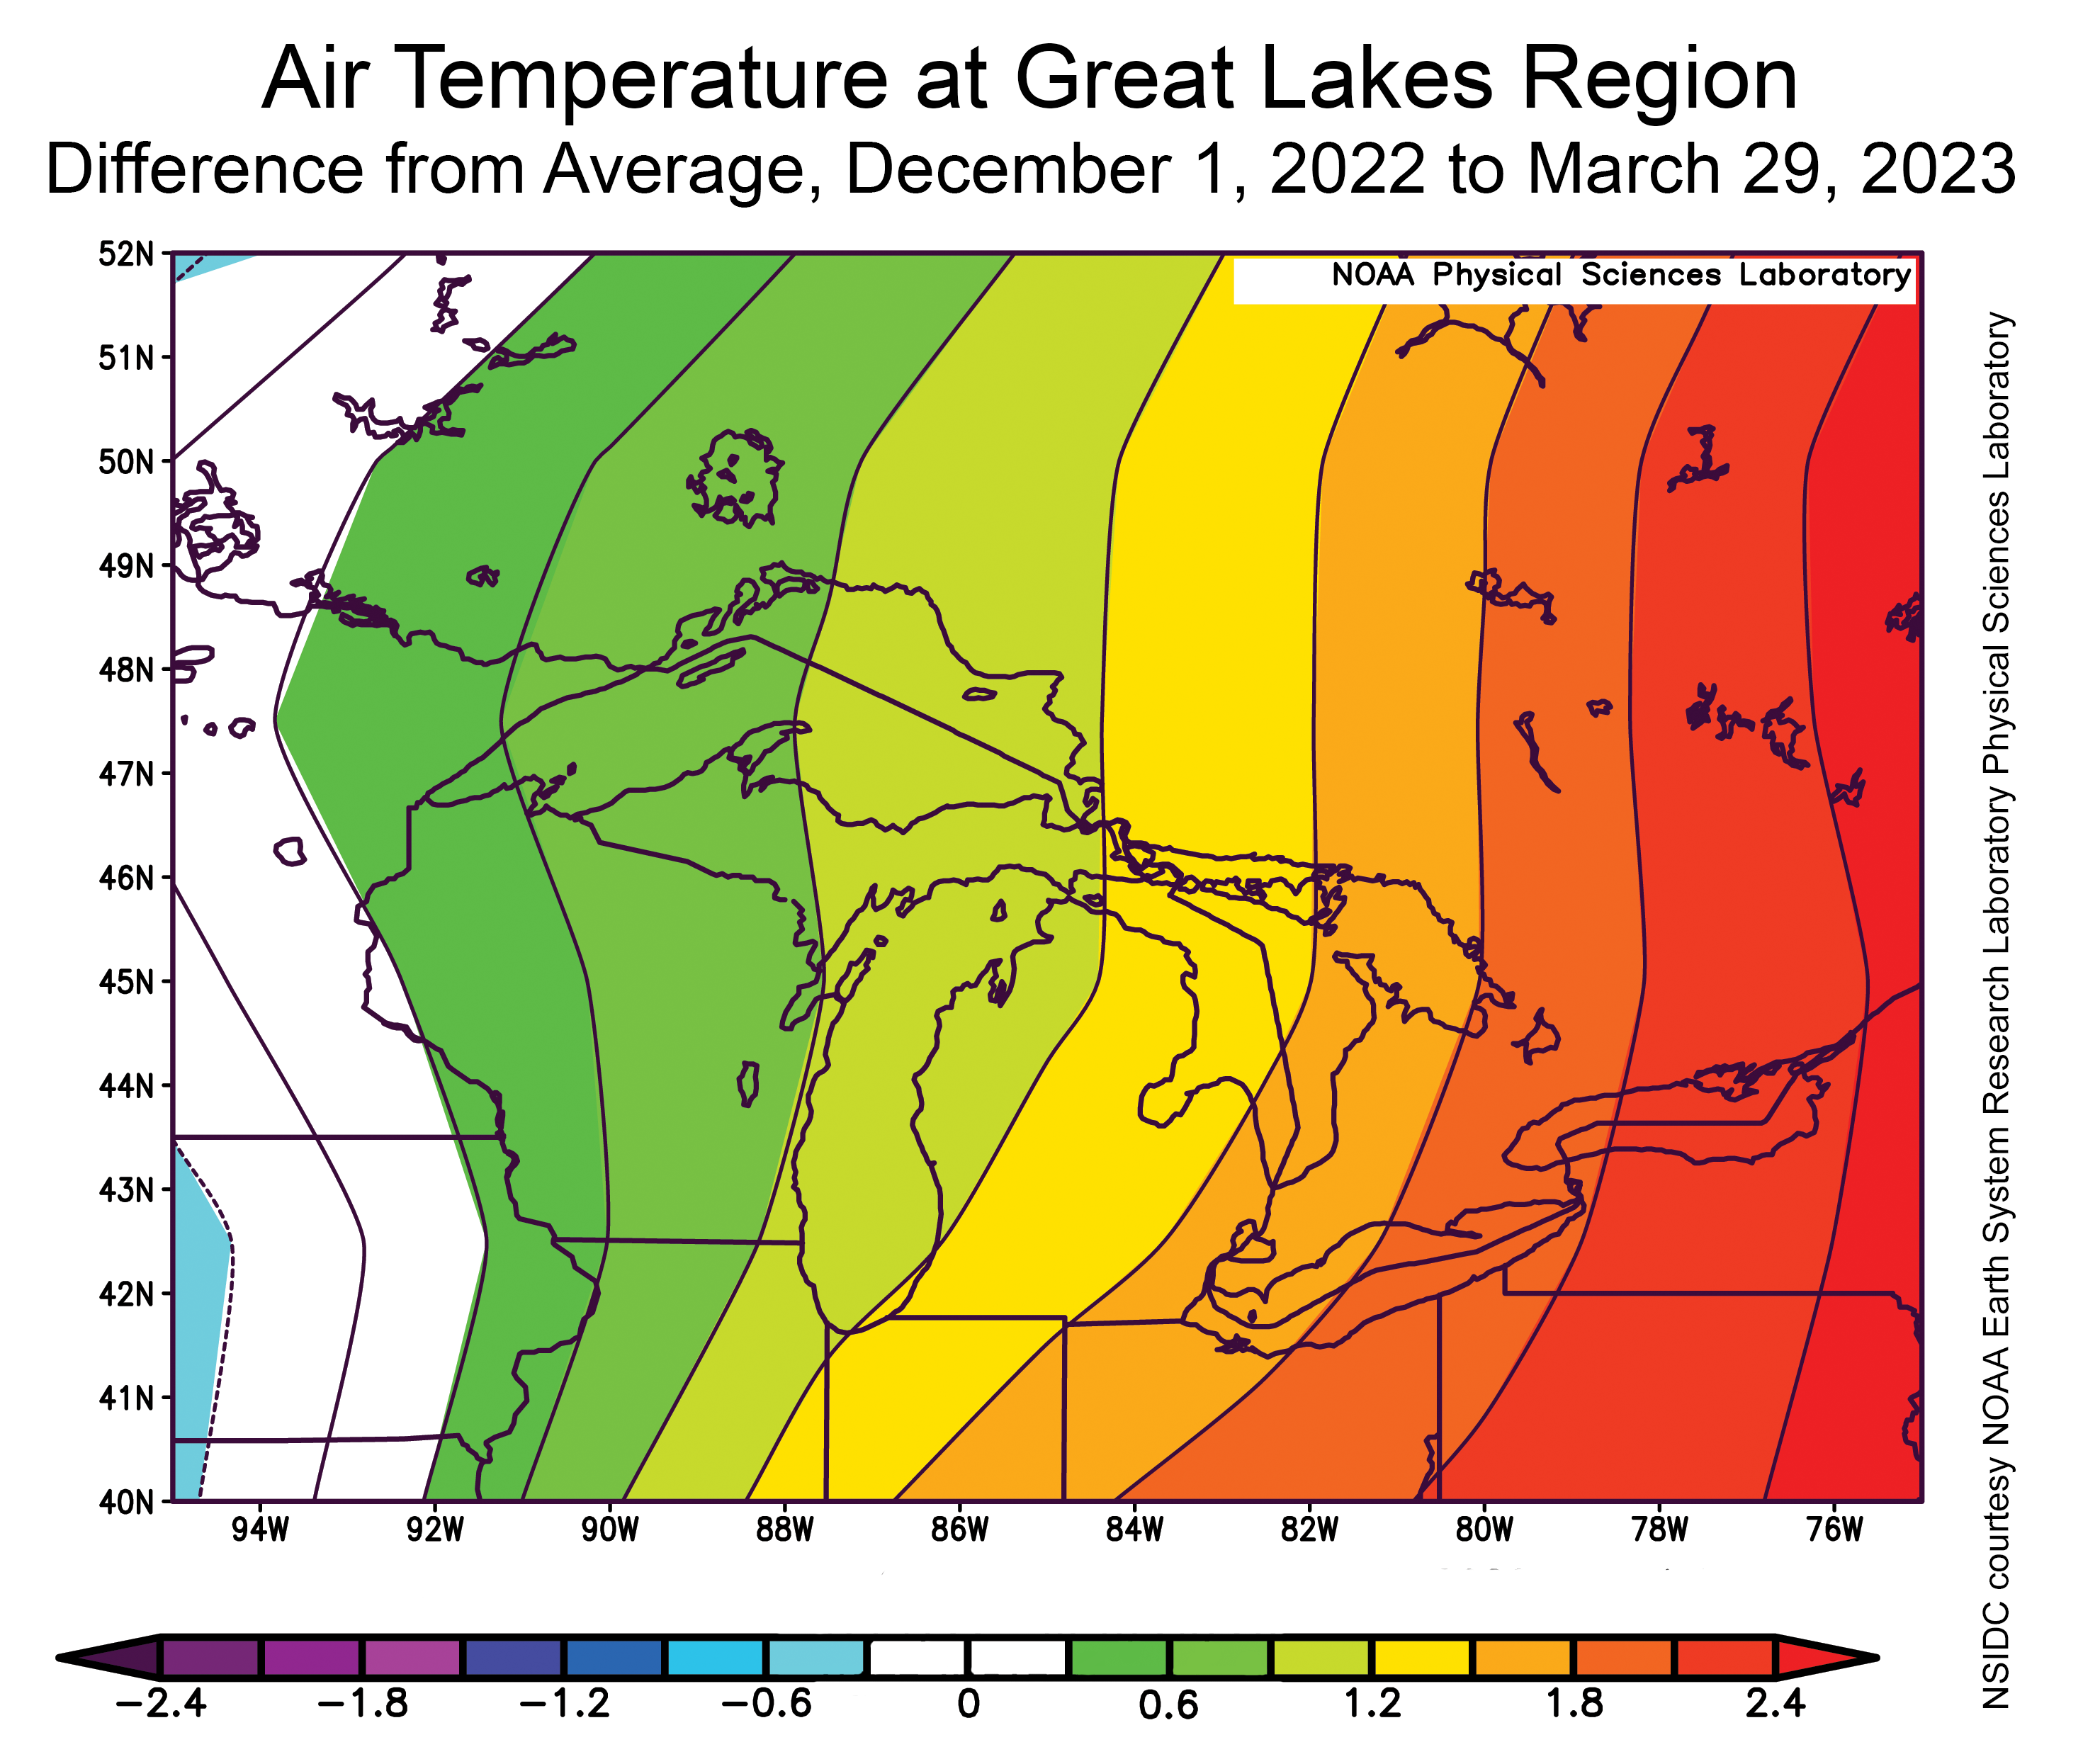
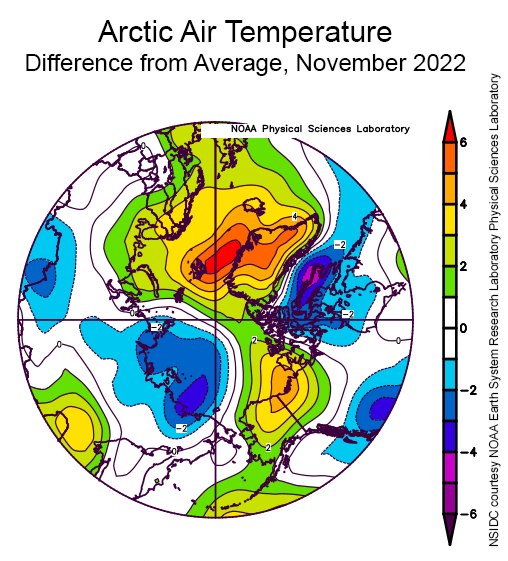
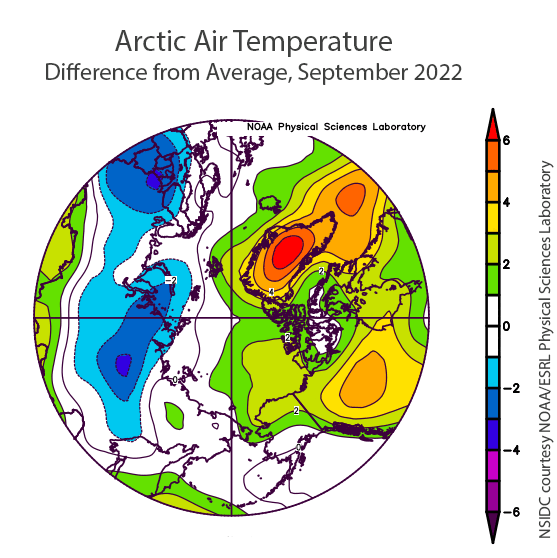
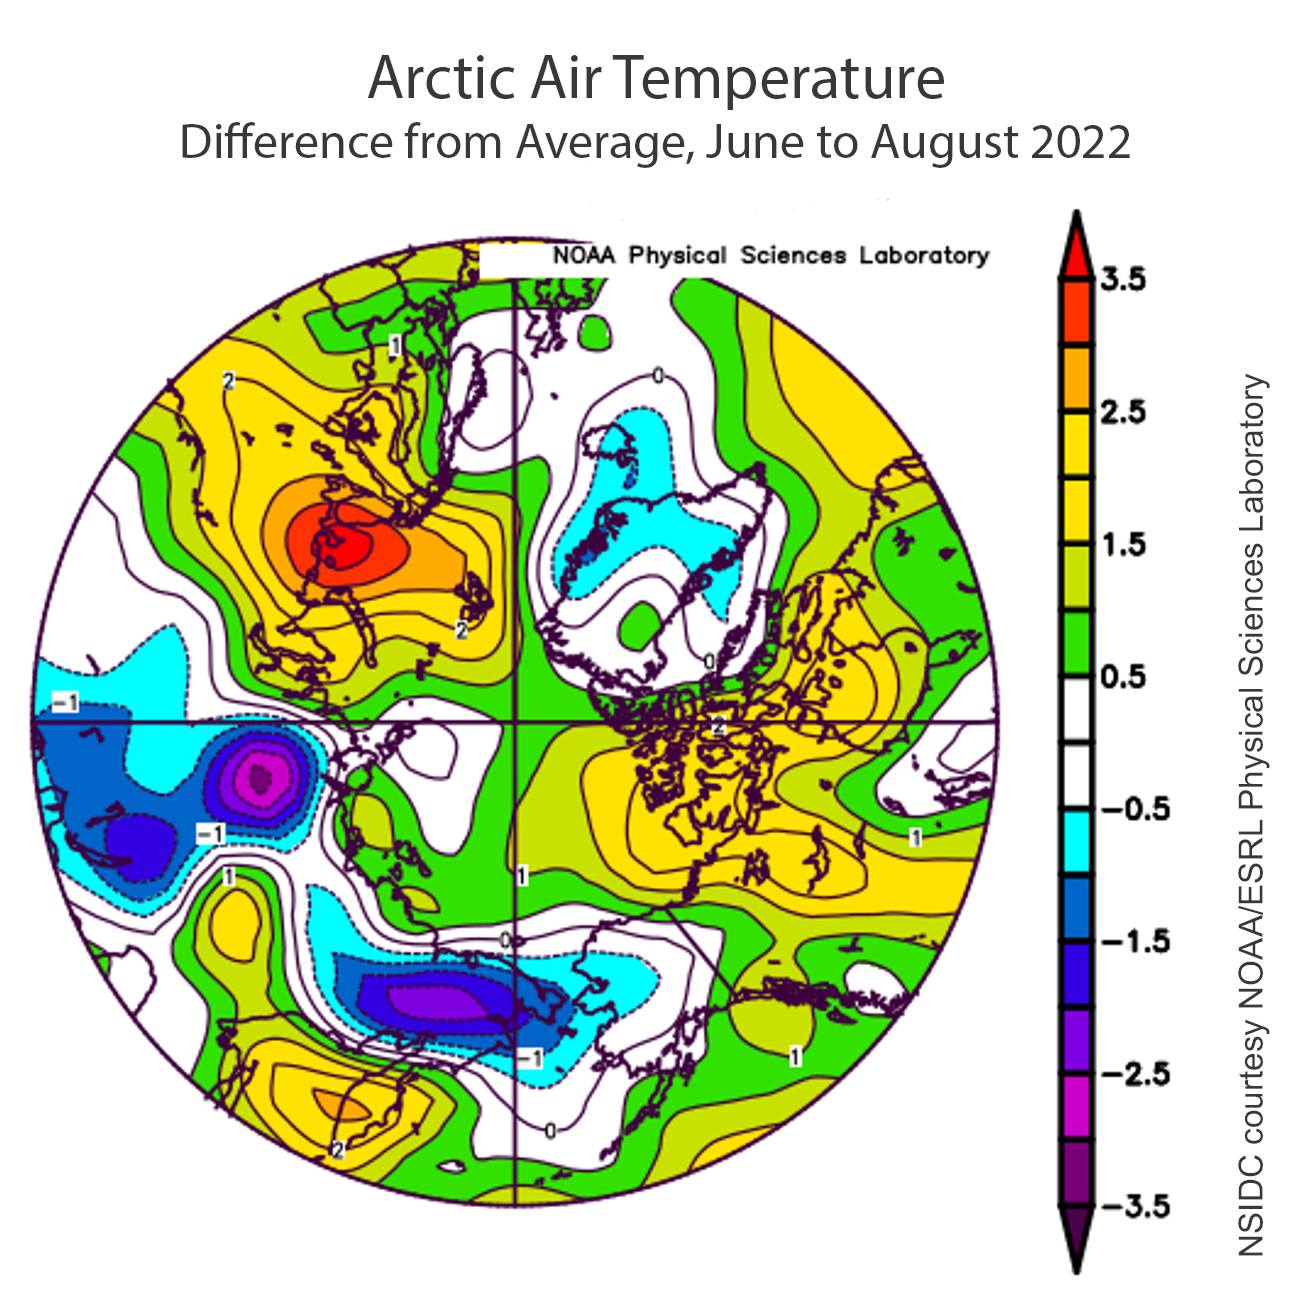
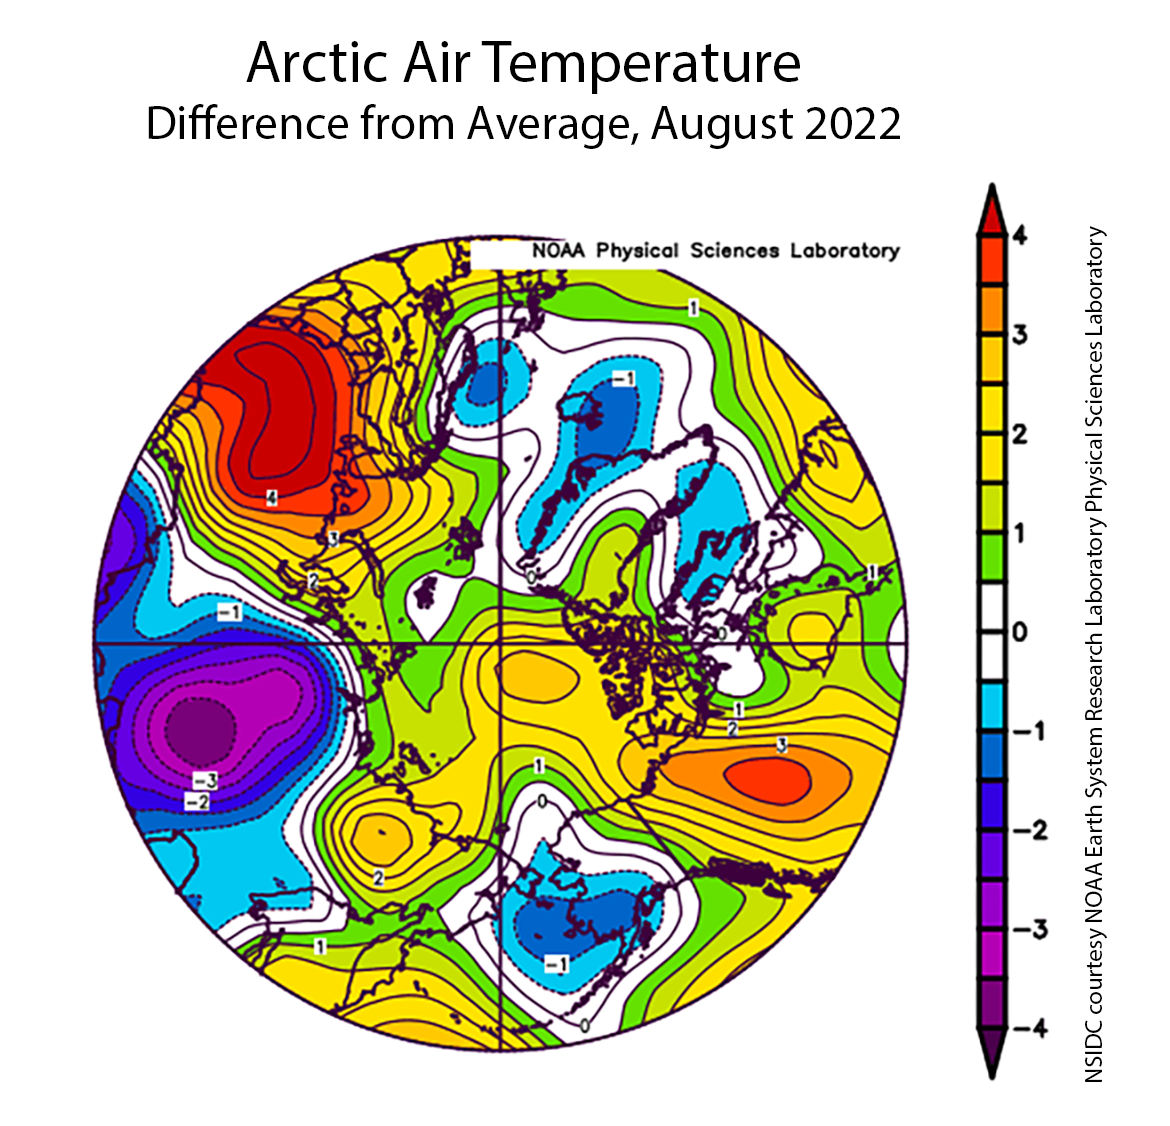
Figure 2b. This plot shows the departure from average air temperature in the Arctic at the 925 hPa level, in degrees Celsius, from July 1 to 29, 2023. Yellows and reds indicate higher than average temperatures; blues and purples indicate lower than average temperatures.
Credit: NSIDC courtesy NOAA Earth System Research Laboratory Physical Sciences Laboratory
High-resolution image
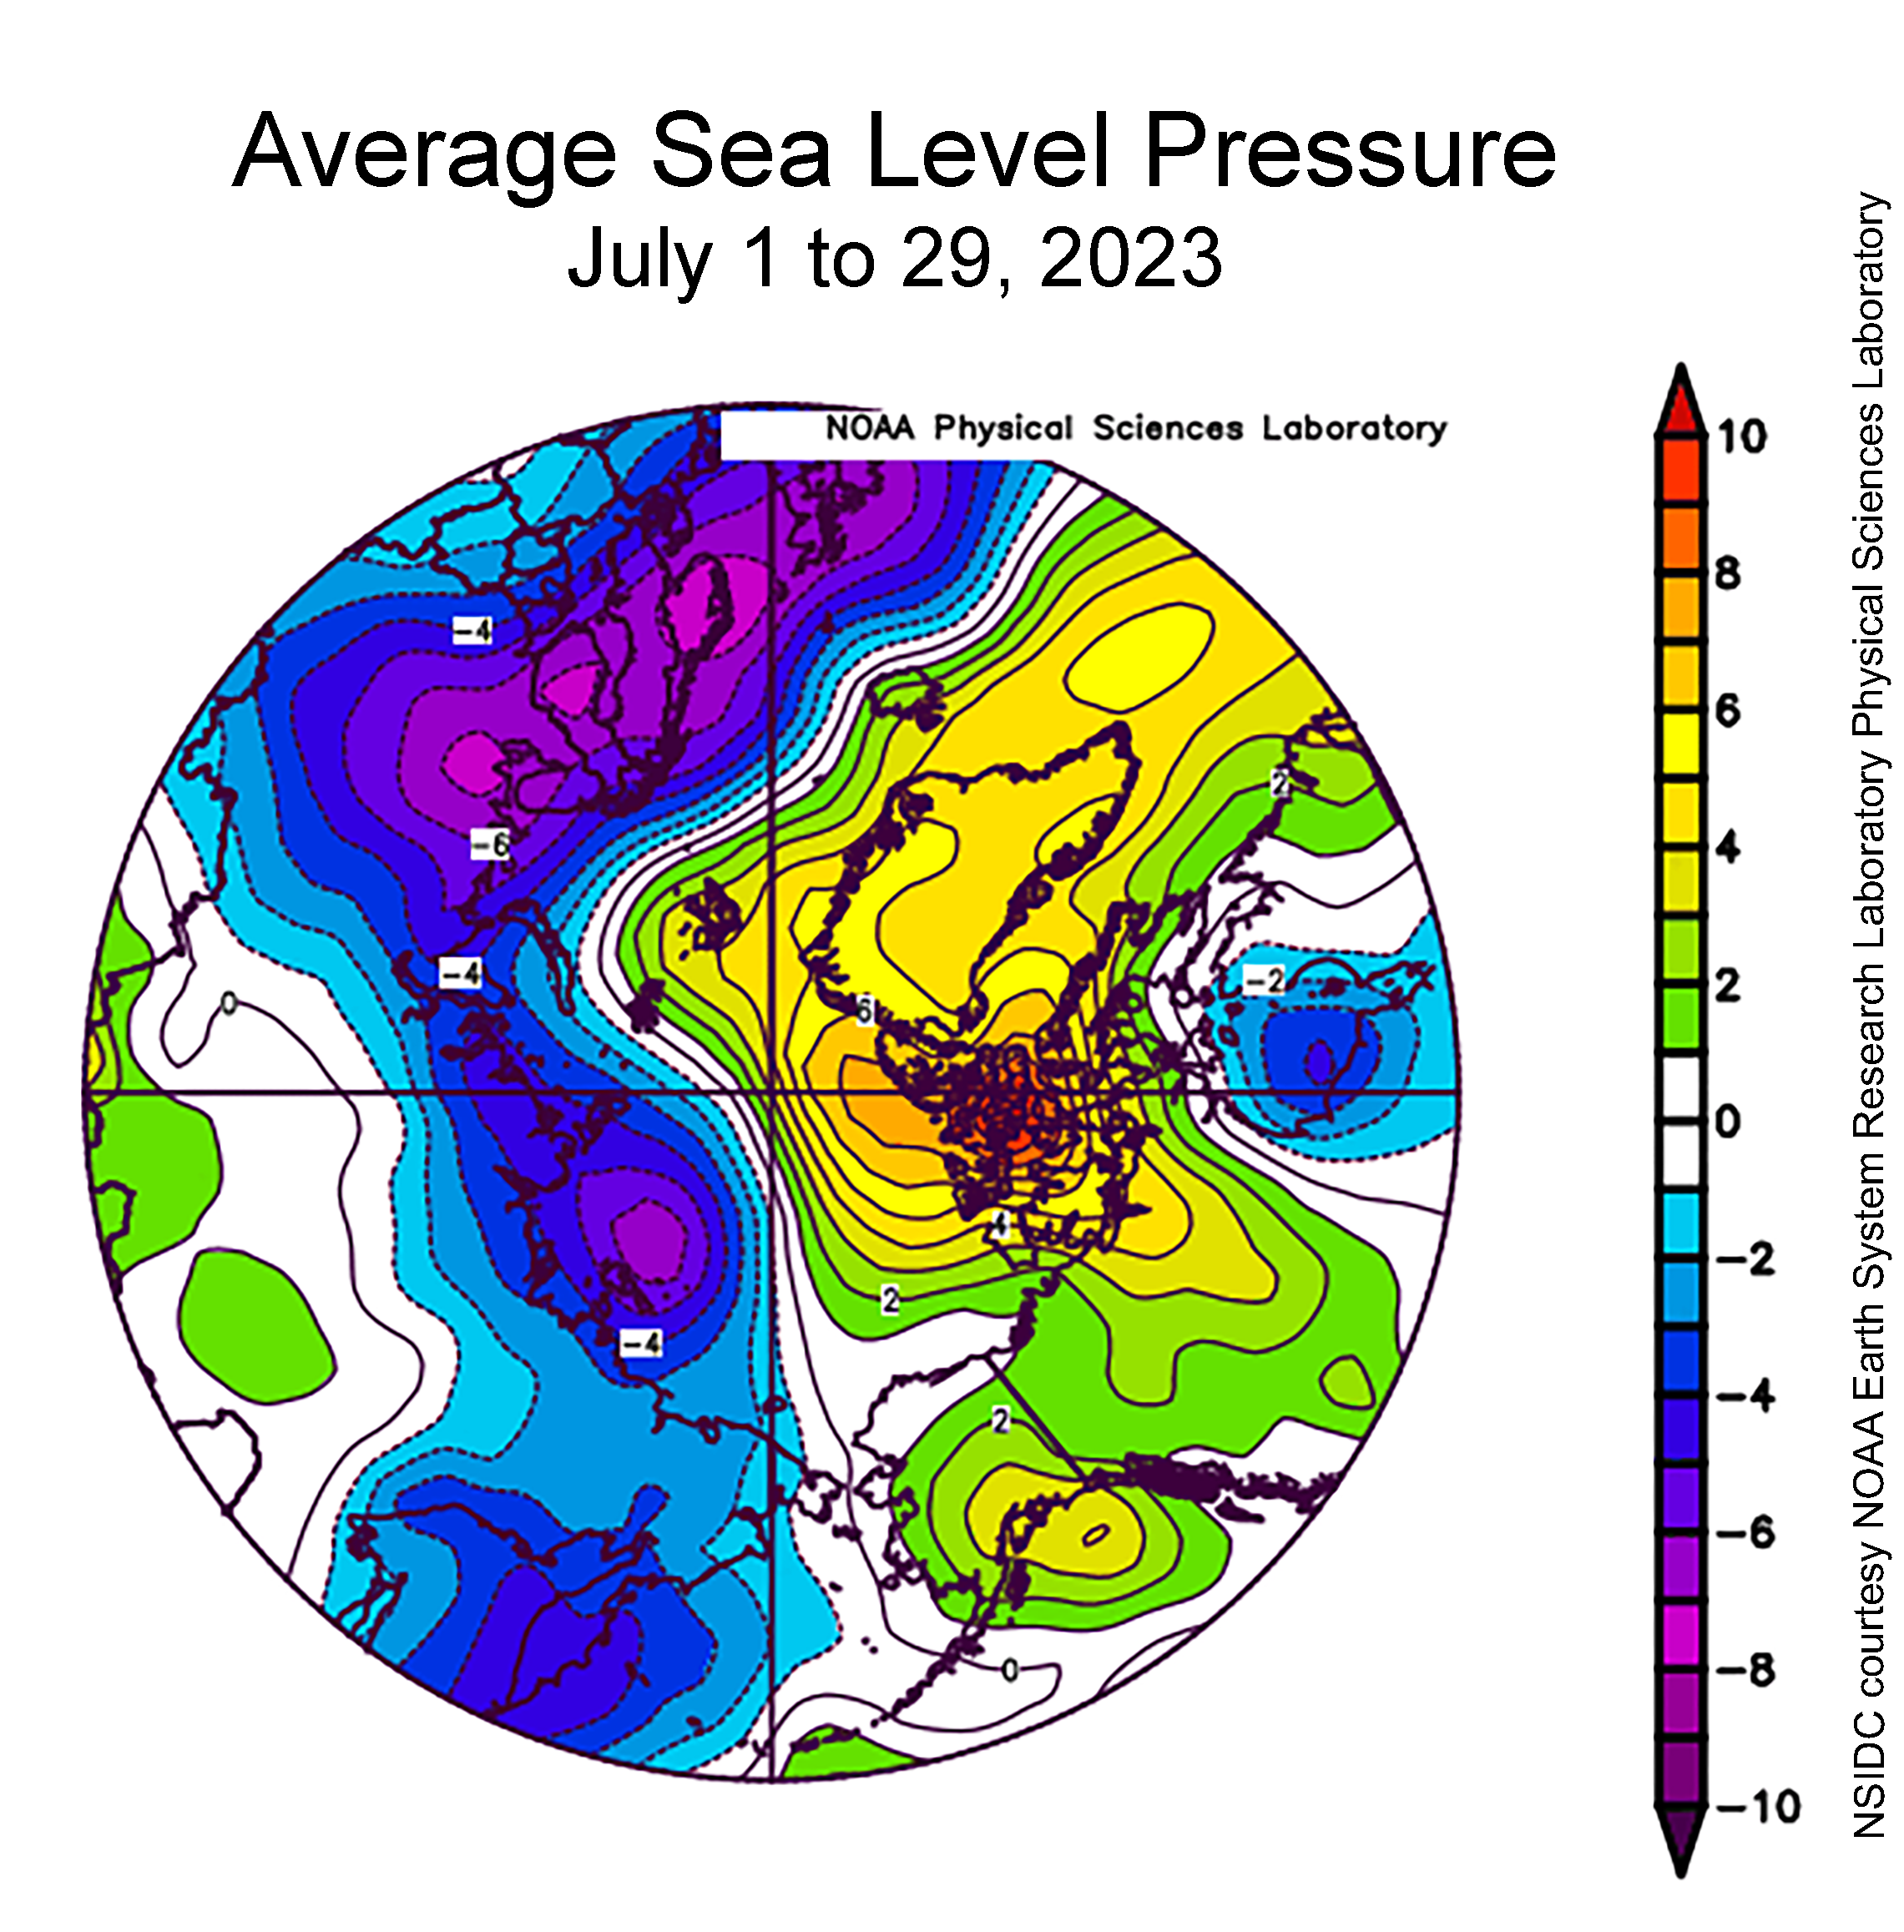
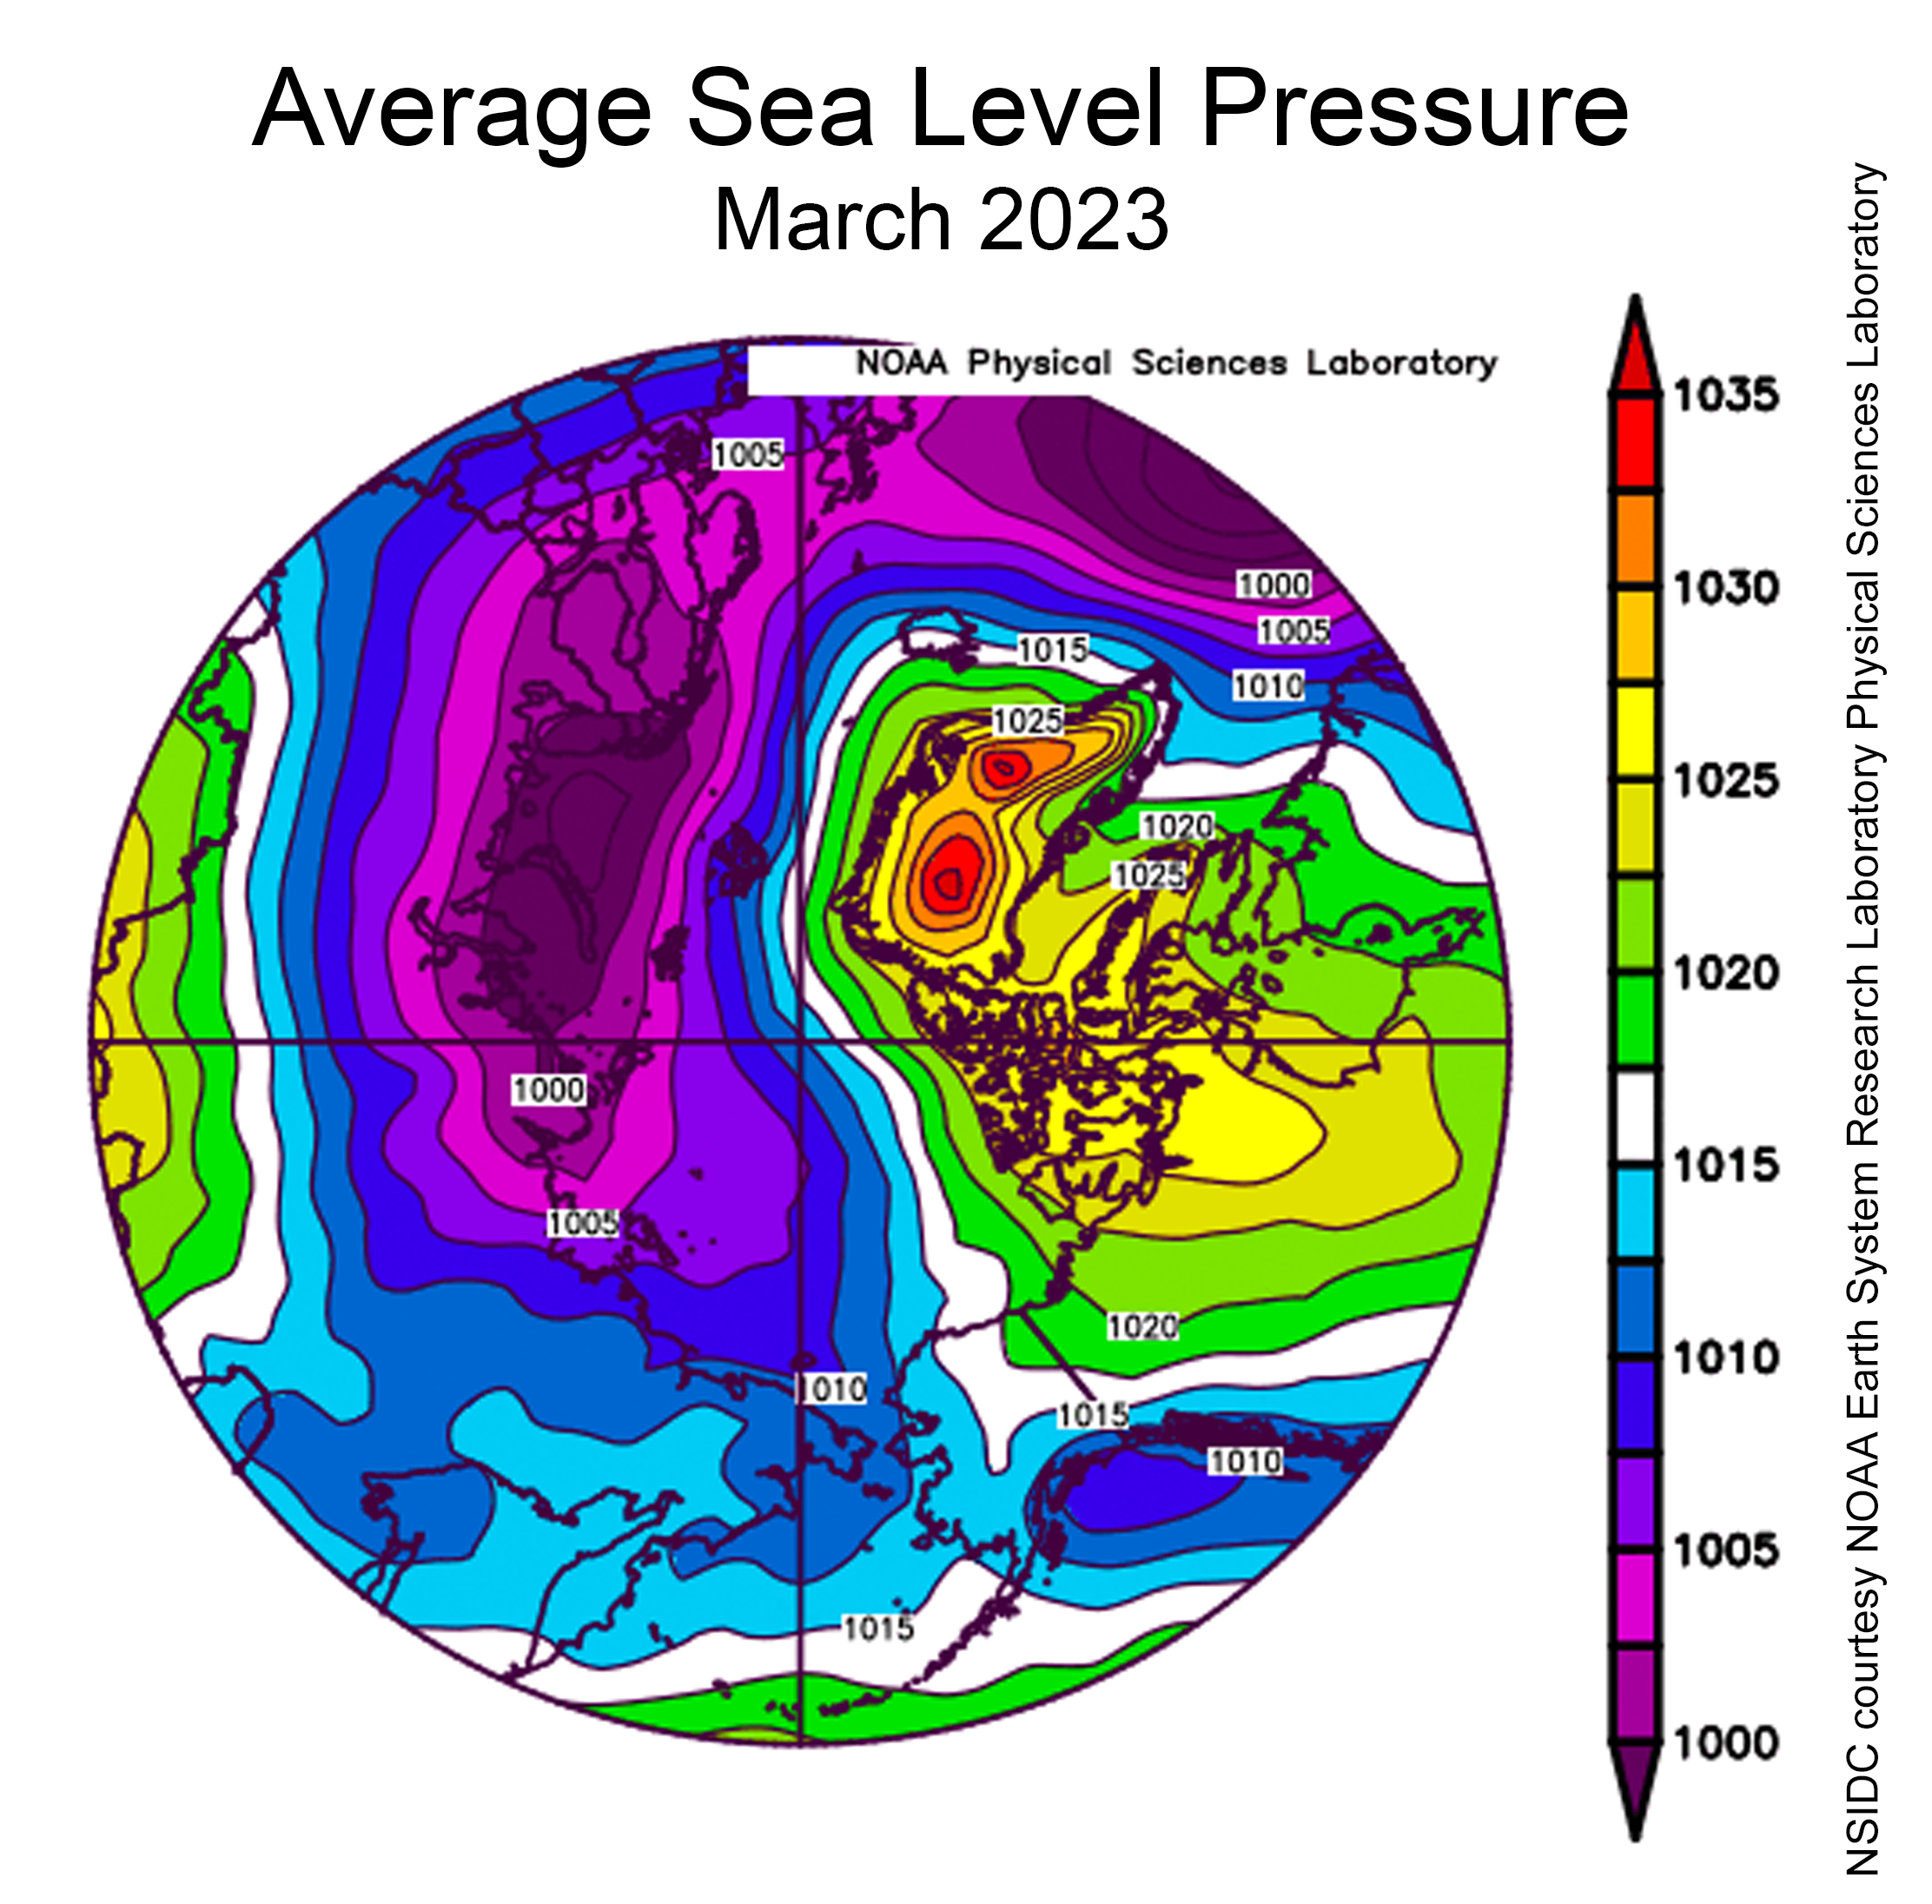
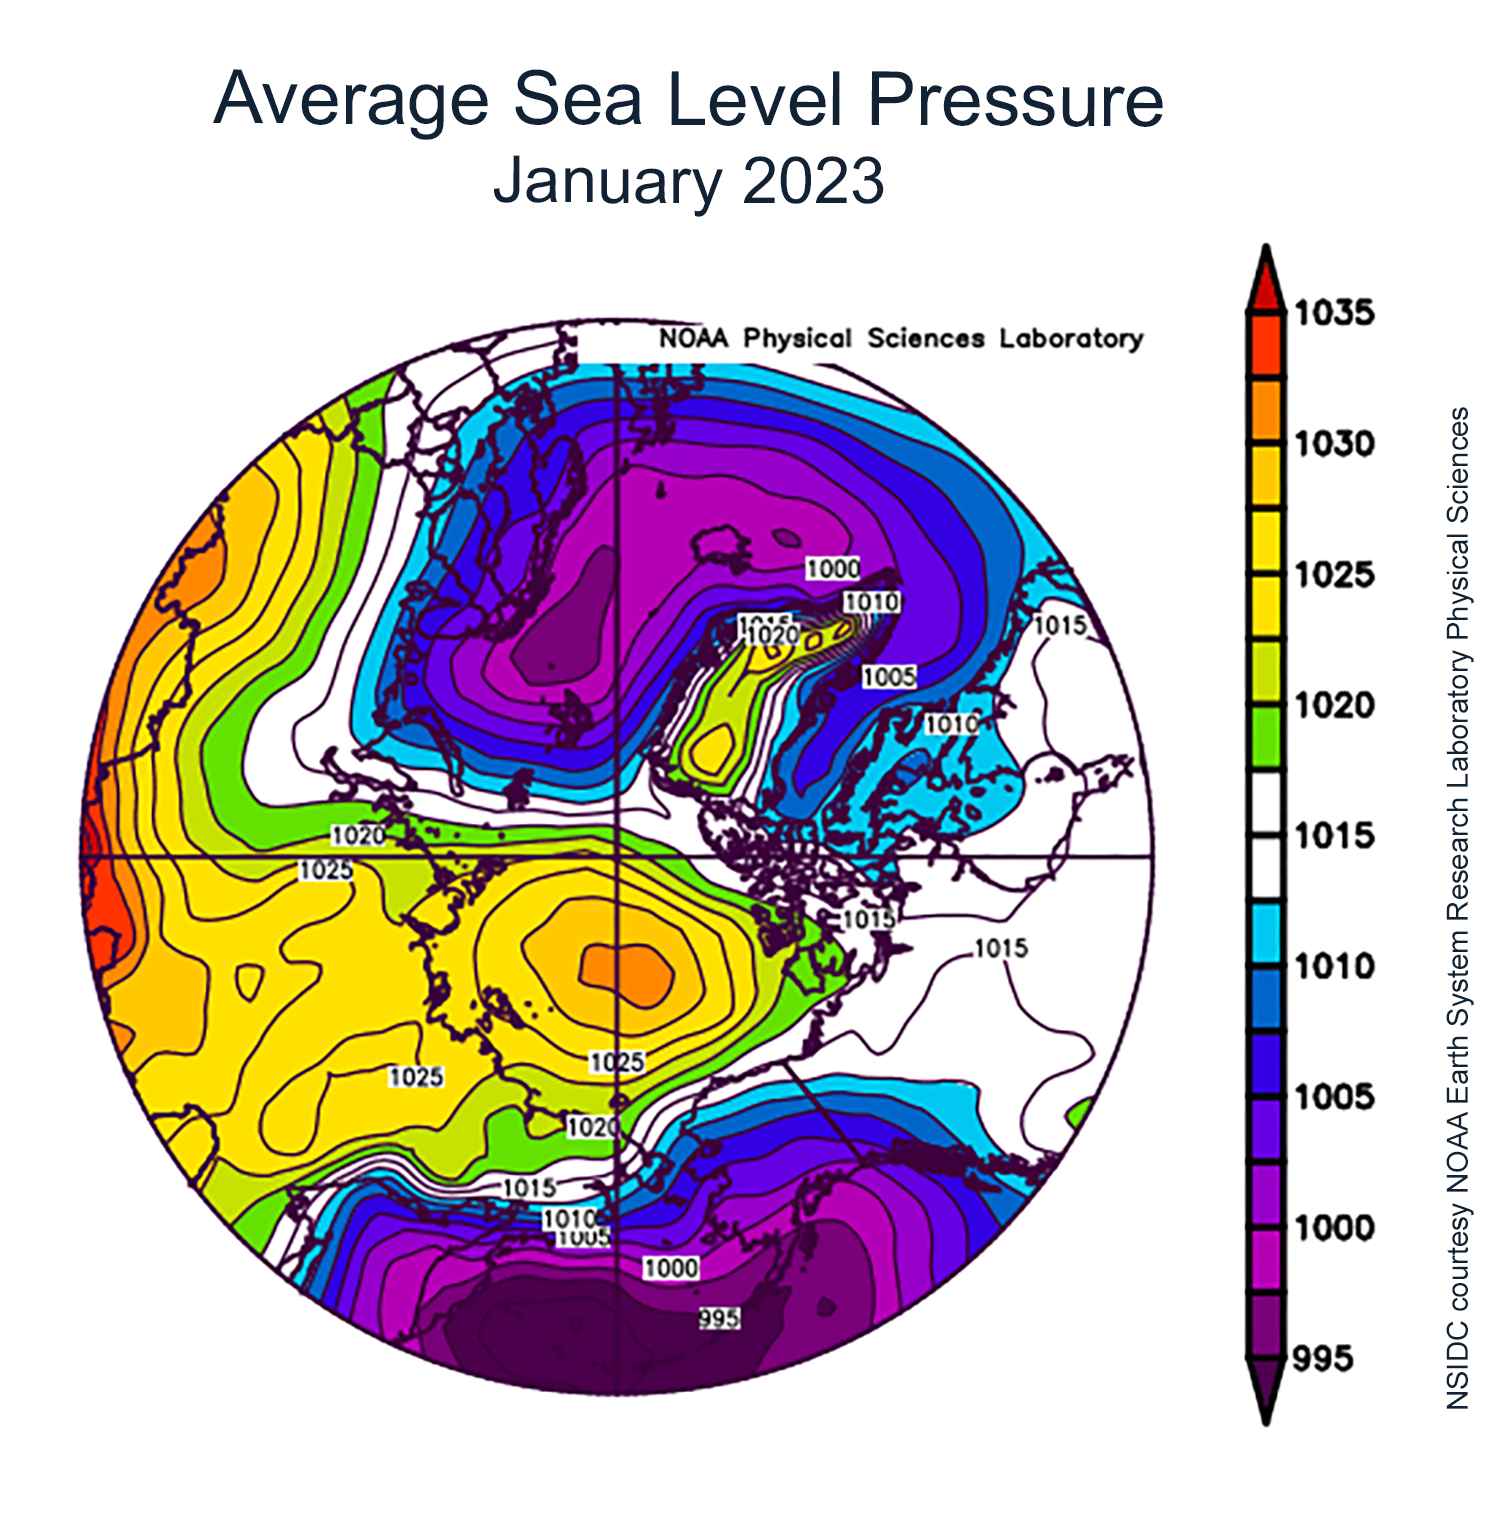
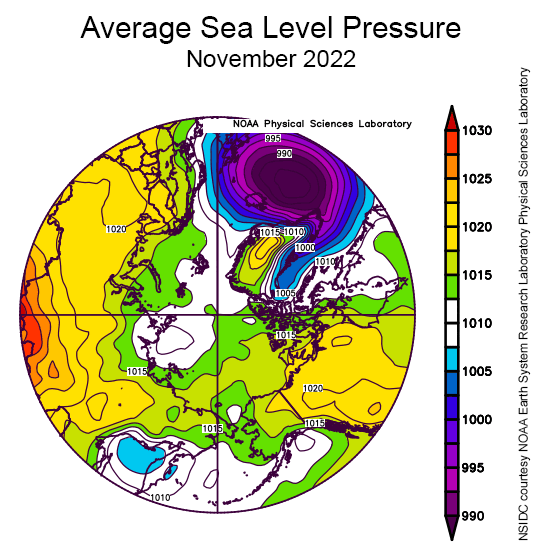
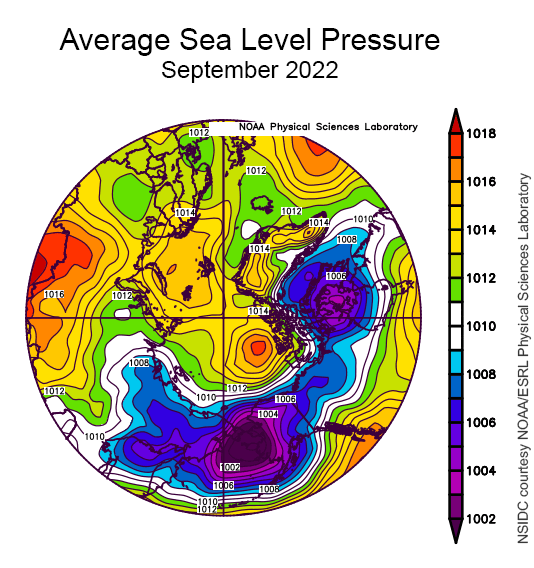
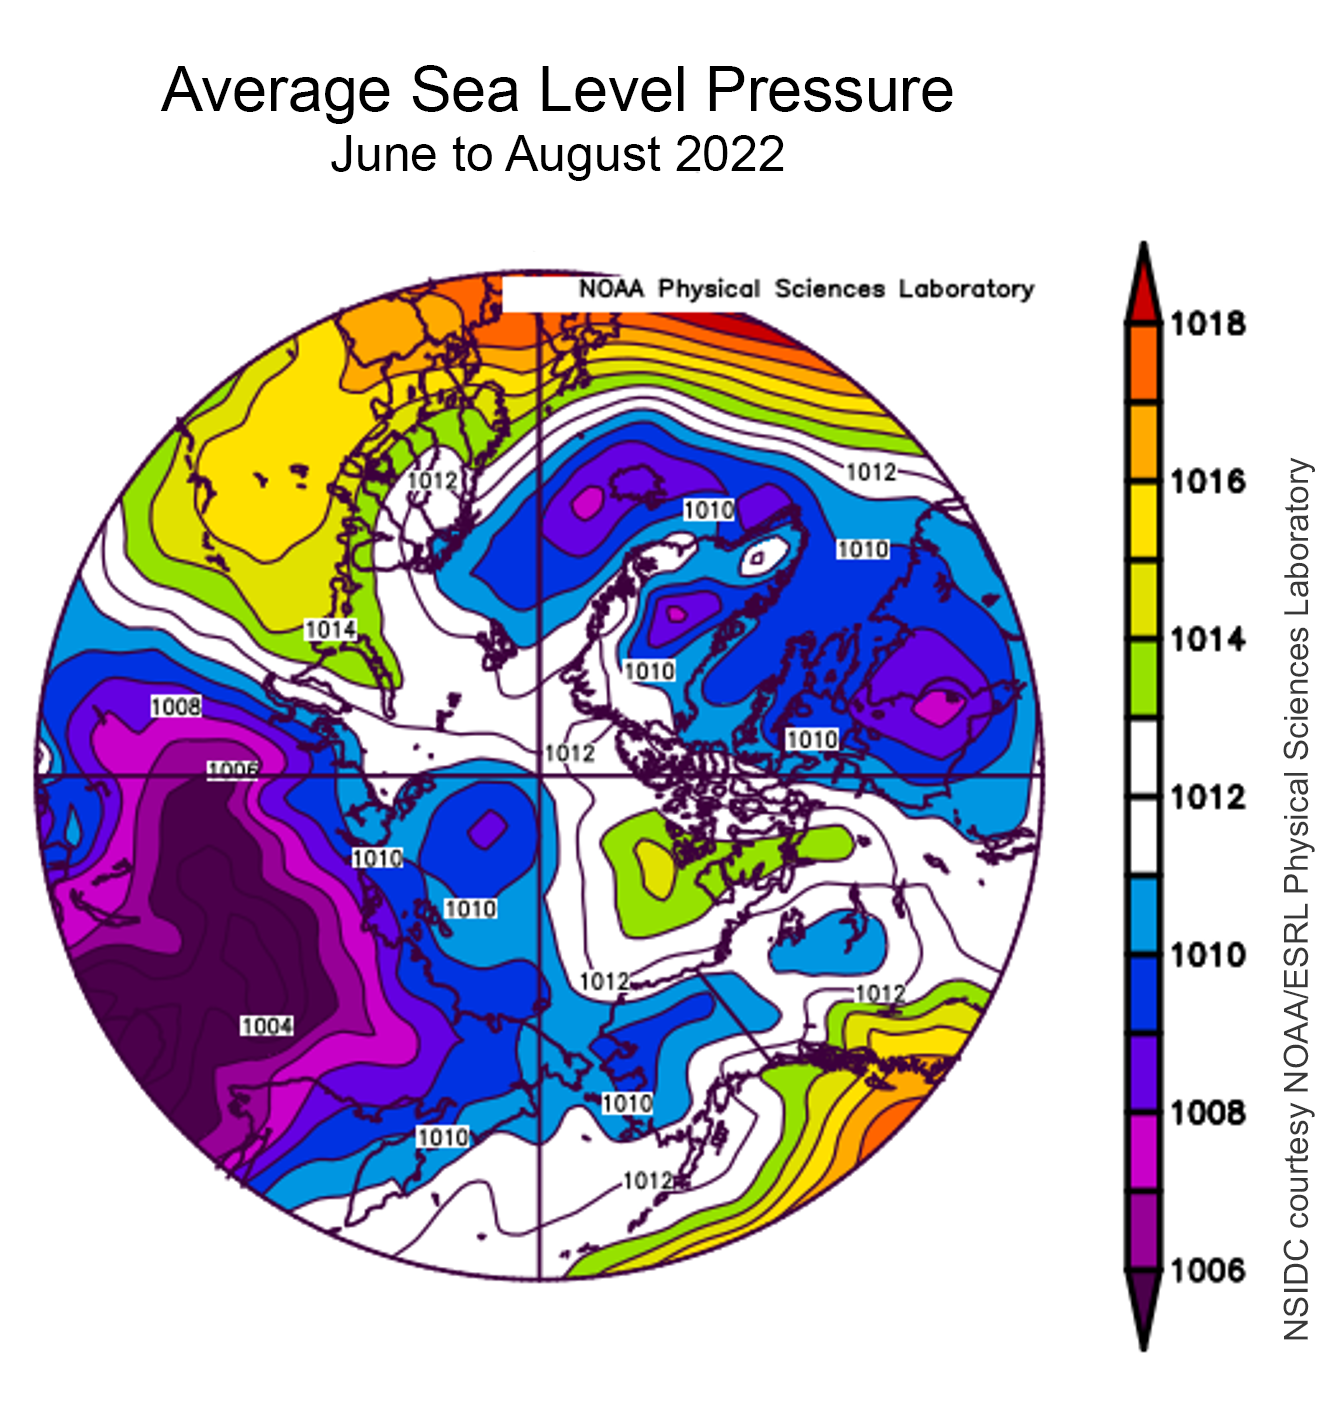
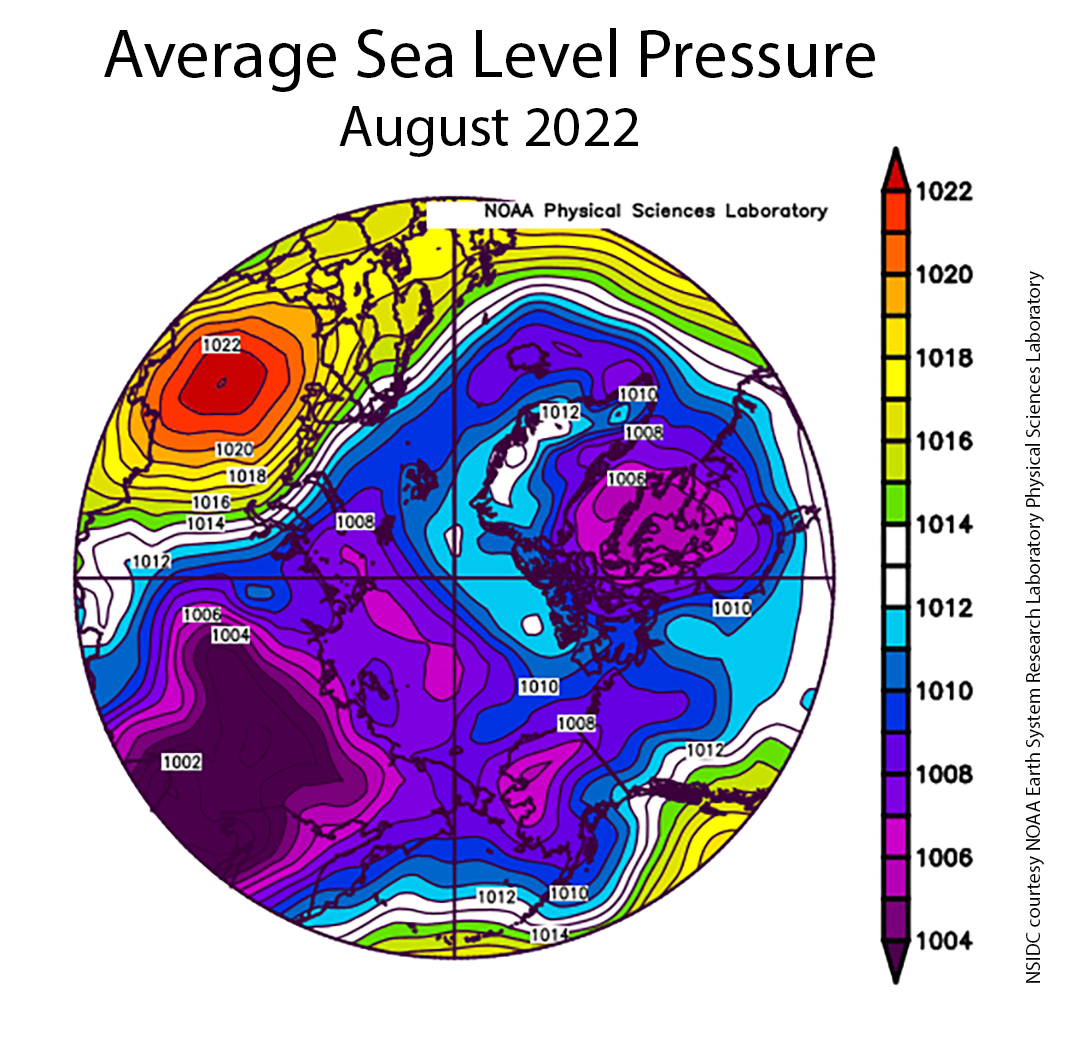
Figure 2c. This plot shows average sea level pressure in the Arctic in millibars from July 1 to 29, 2023. Yellows and reds indicate high air pressure; blues and purples indicate low pressure.
Credit: NSIDC courtesy NOAA Earth System Research Laboratory Physical Sciences Laboratory
High-resolution image
Air temperatures at the 925 hPa level (approximately 2,500 feet above the surface) averaged for July 2023 were with one exception unremarkable (Figure 2). This contrasts sharply with the record high global average surface air temperature (2 meters or 6.6 feet above the surface) for the month as shown in records compiled by NASA, the National Oceanic and Atmospheric Administration (NOAA) and other agencies. Arctic temperatures at the 925 hPa level were from 1 to 3 degrees Celsius (2 to 5 degrees Fahrenheit) above average across much of the Arctic Ocean but below average by 1 to 4 degrees Celsius (2 to 7 degrees Fahrenheit) over the Laptev Sea, which as noted above is largely ice free. The one area of pronounced warmth is centered over the Mackenzie River Delta, with temperatures up to 7 degrees Celsius (13 degrees Fahrenheit) above average. The atmospheric circulation pattern for the month was by contrast quite interesting, with low pressure over the Eurasian side of the Arctic and high pressure over the North American side (Figure 2c). As a result, there was a strong pressure gradient across the central Arctic Ocean extending to the east of Svalbard and then towards Iceland, pointing to strong winds and hence strong sea ice transport.
July 2023 compared to previous years
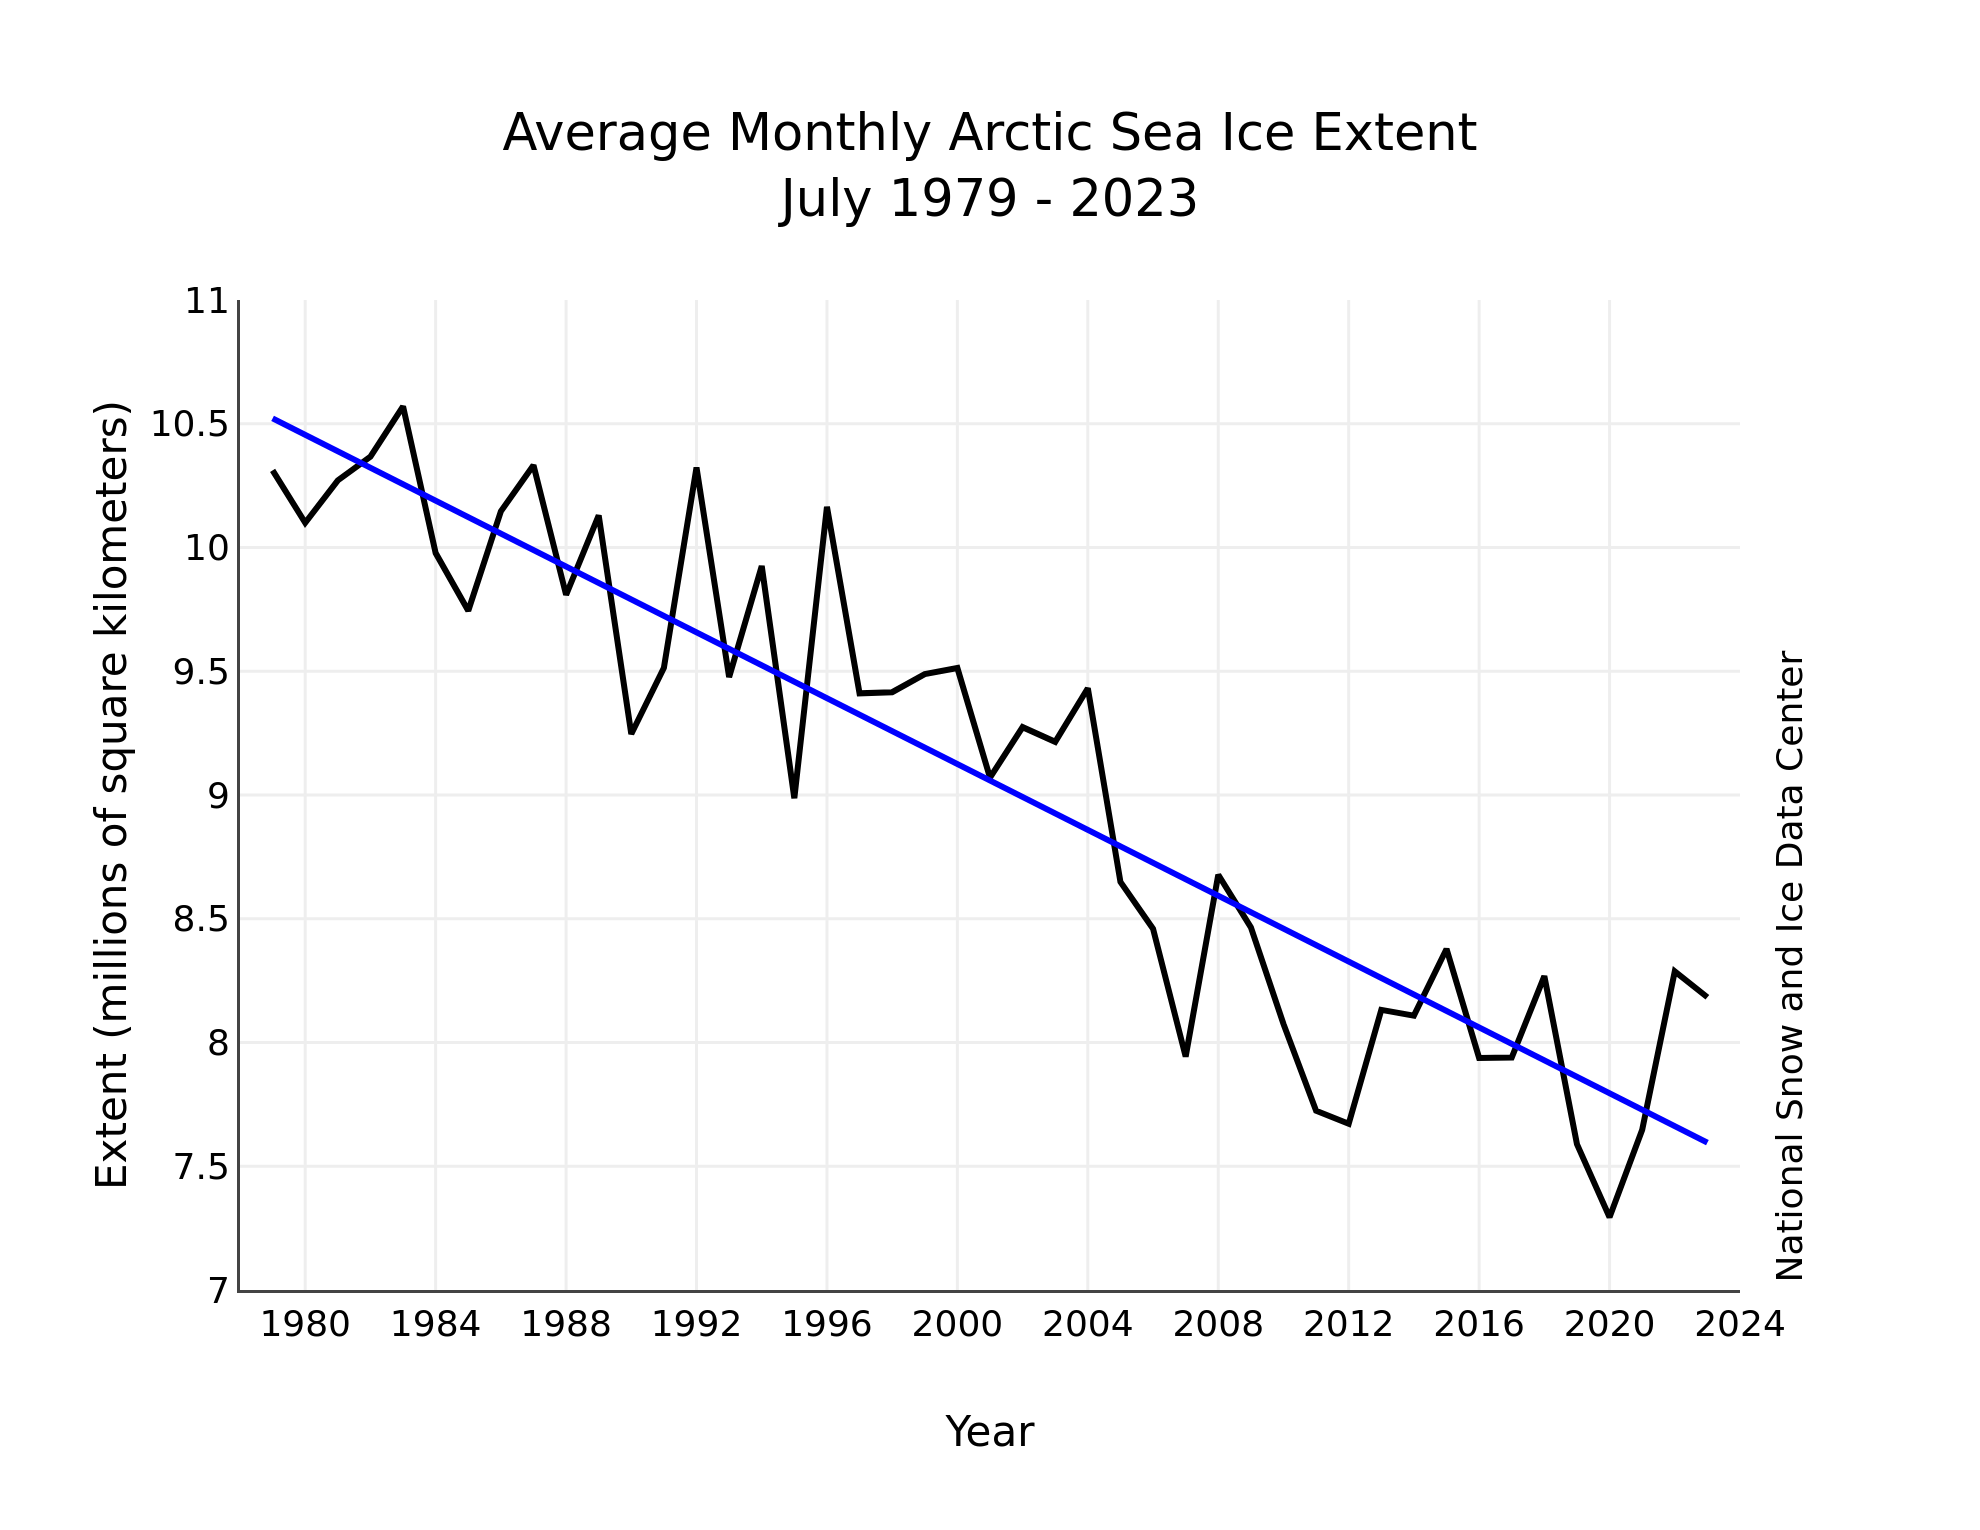
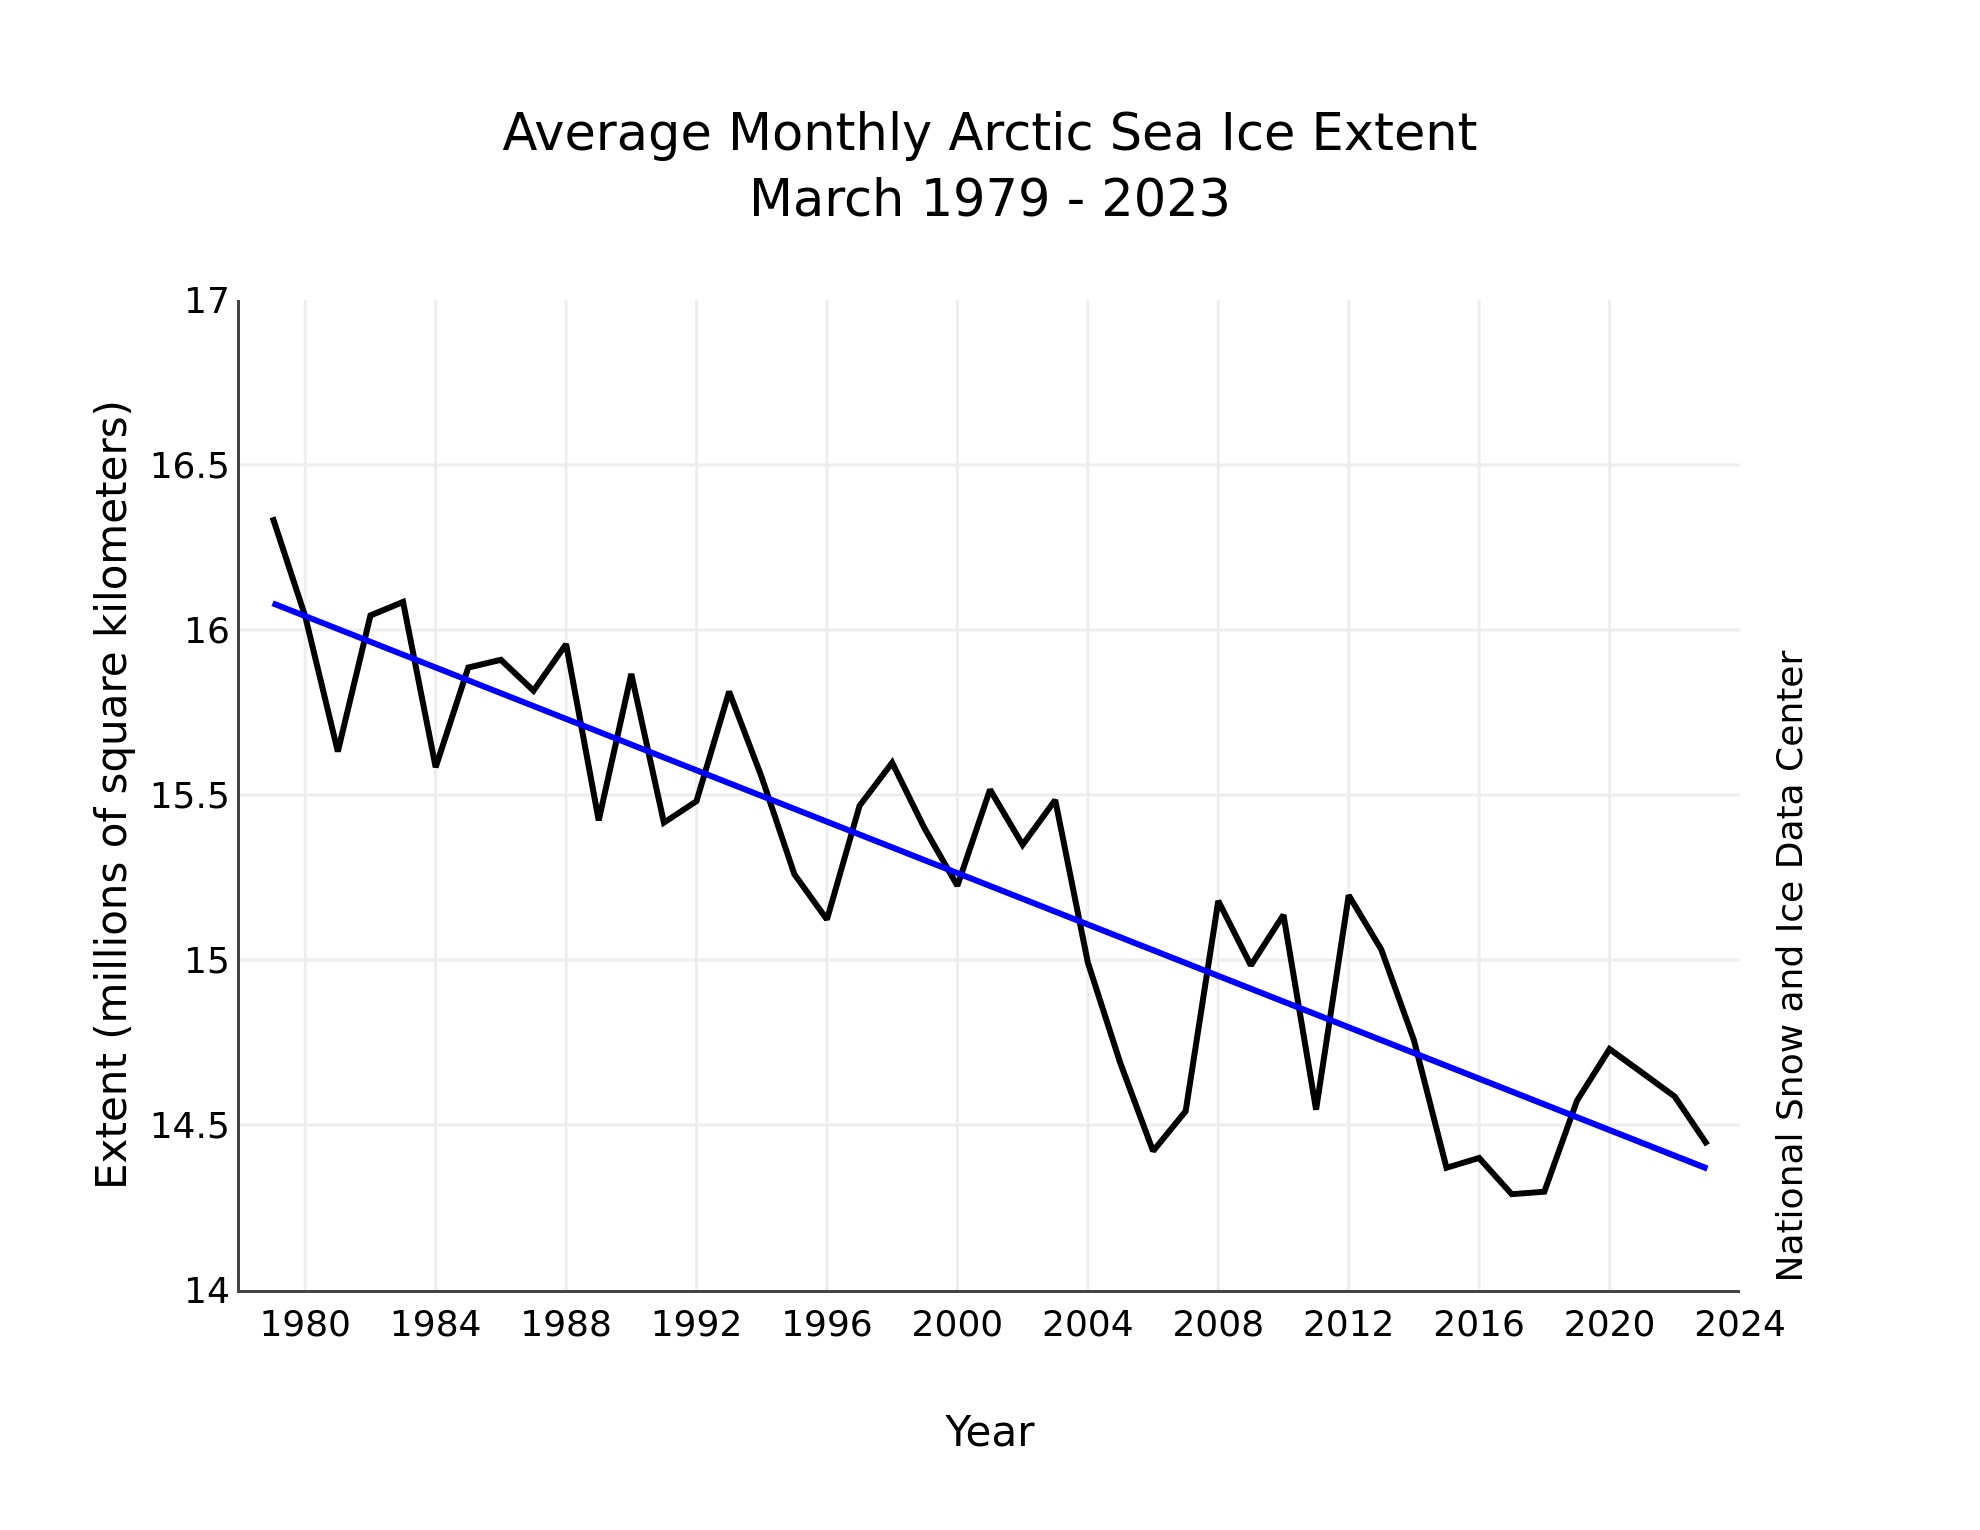
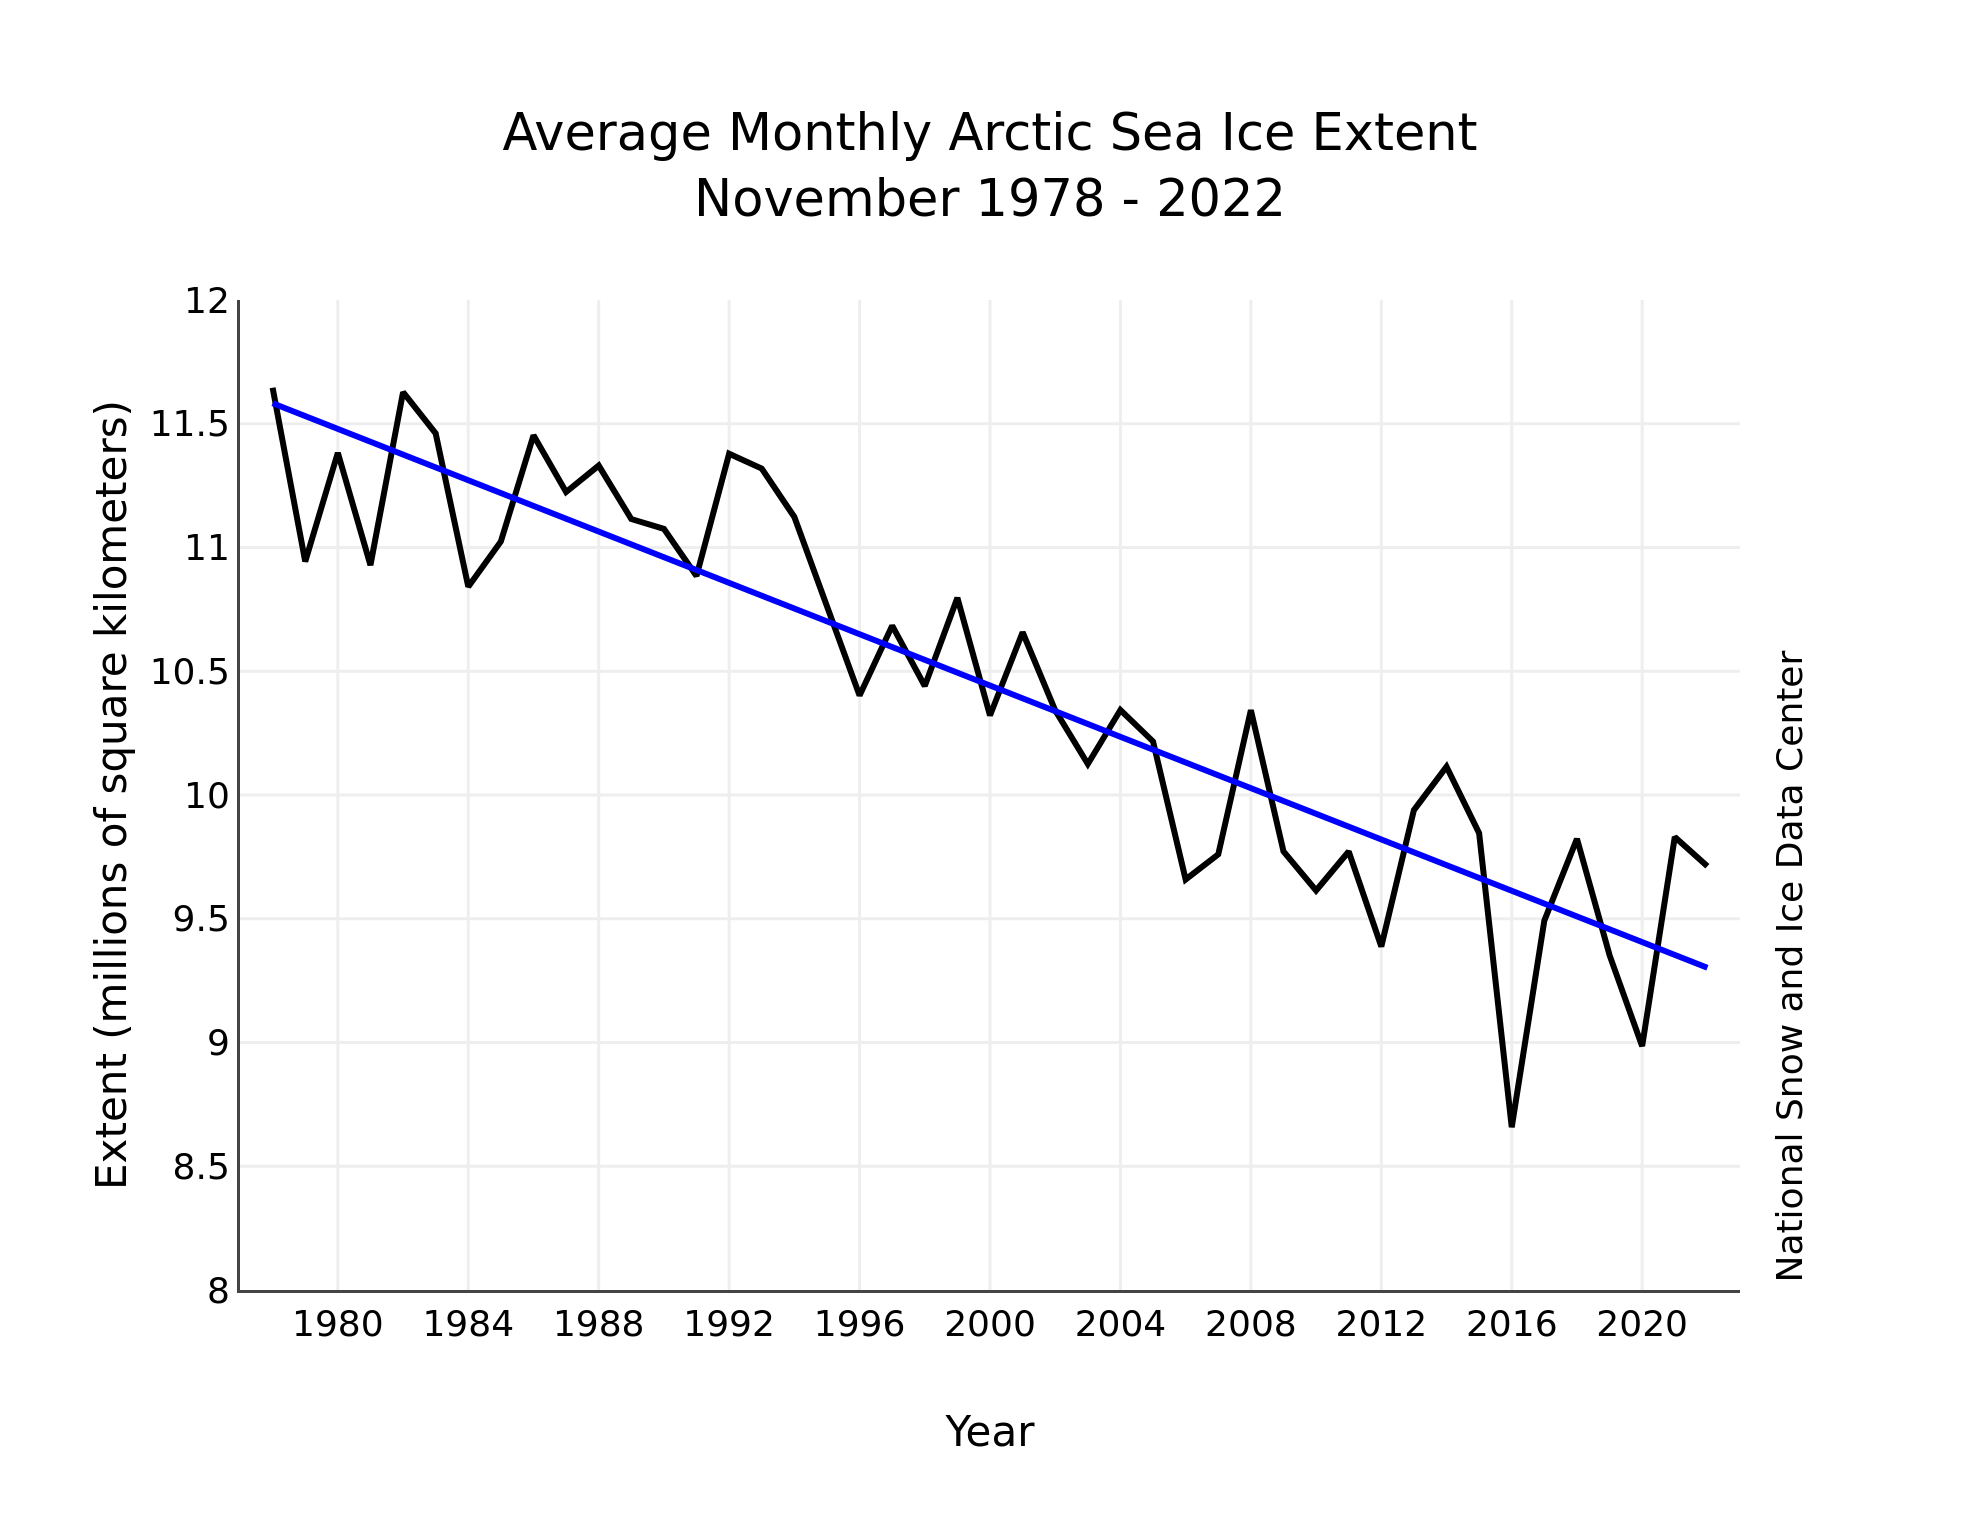
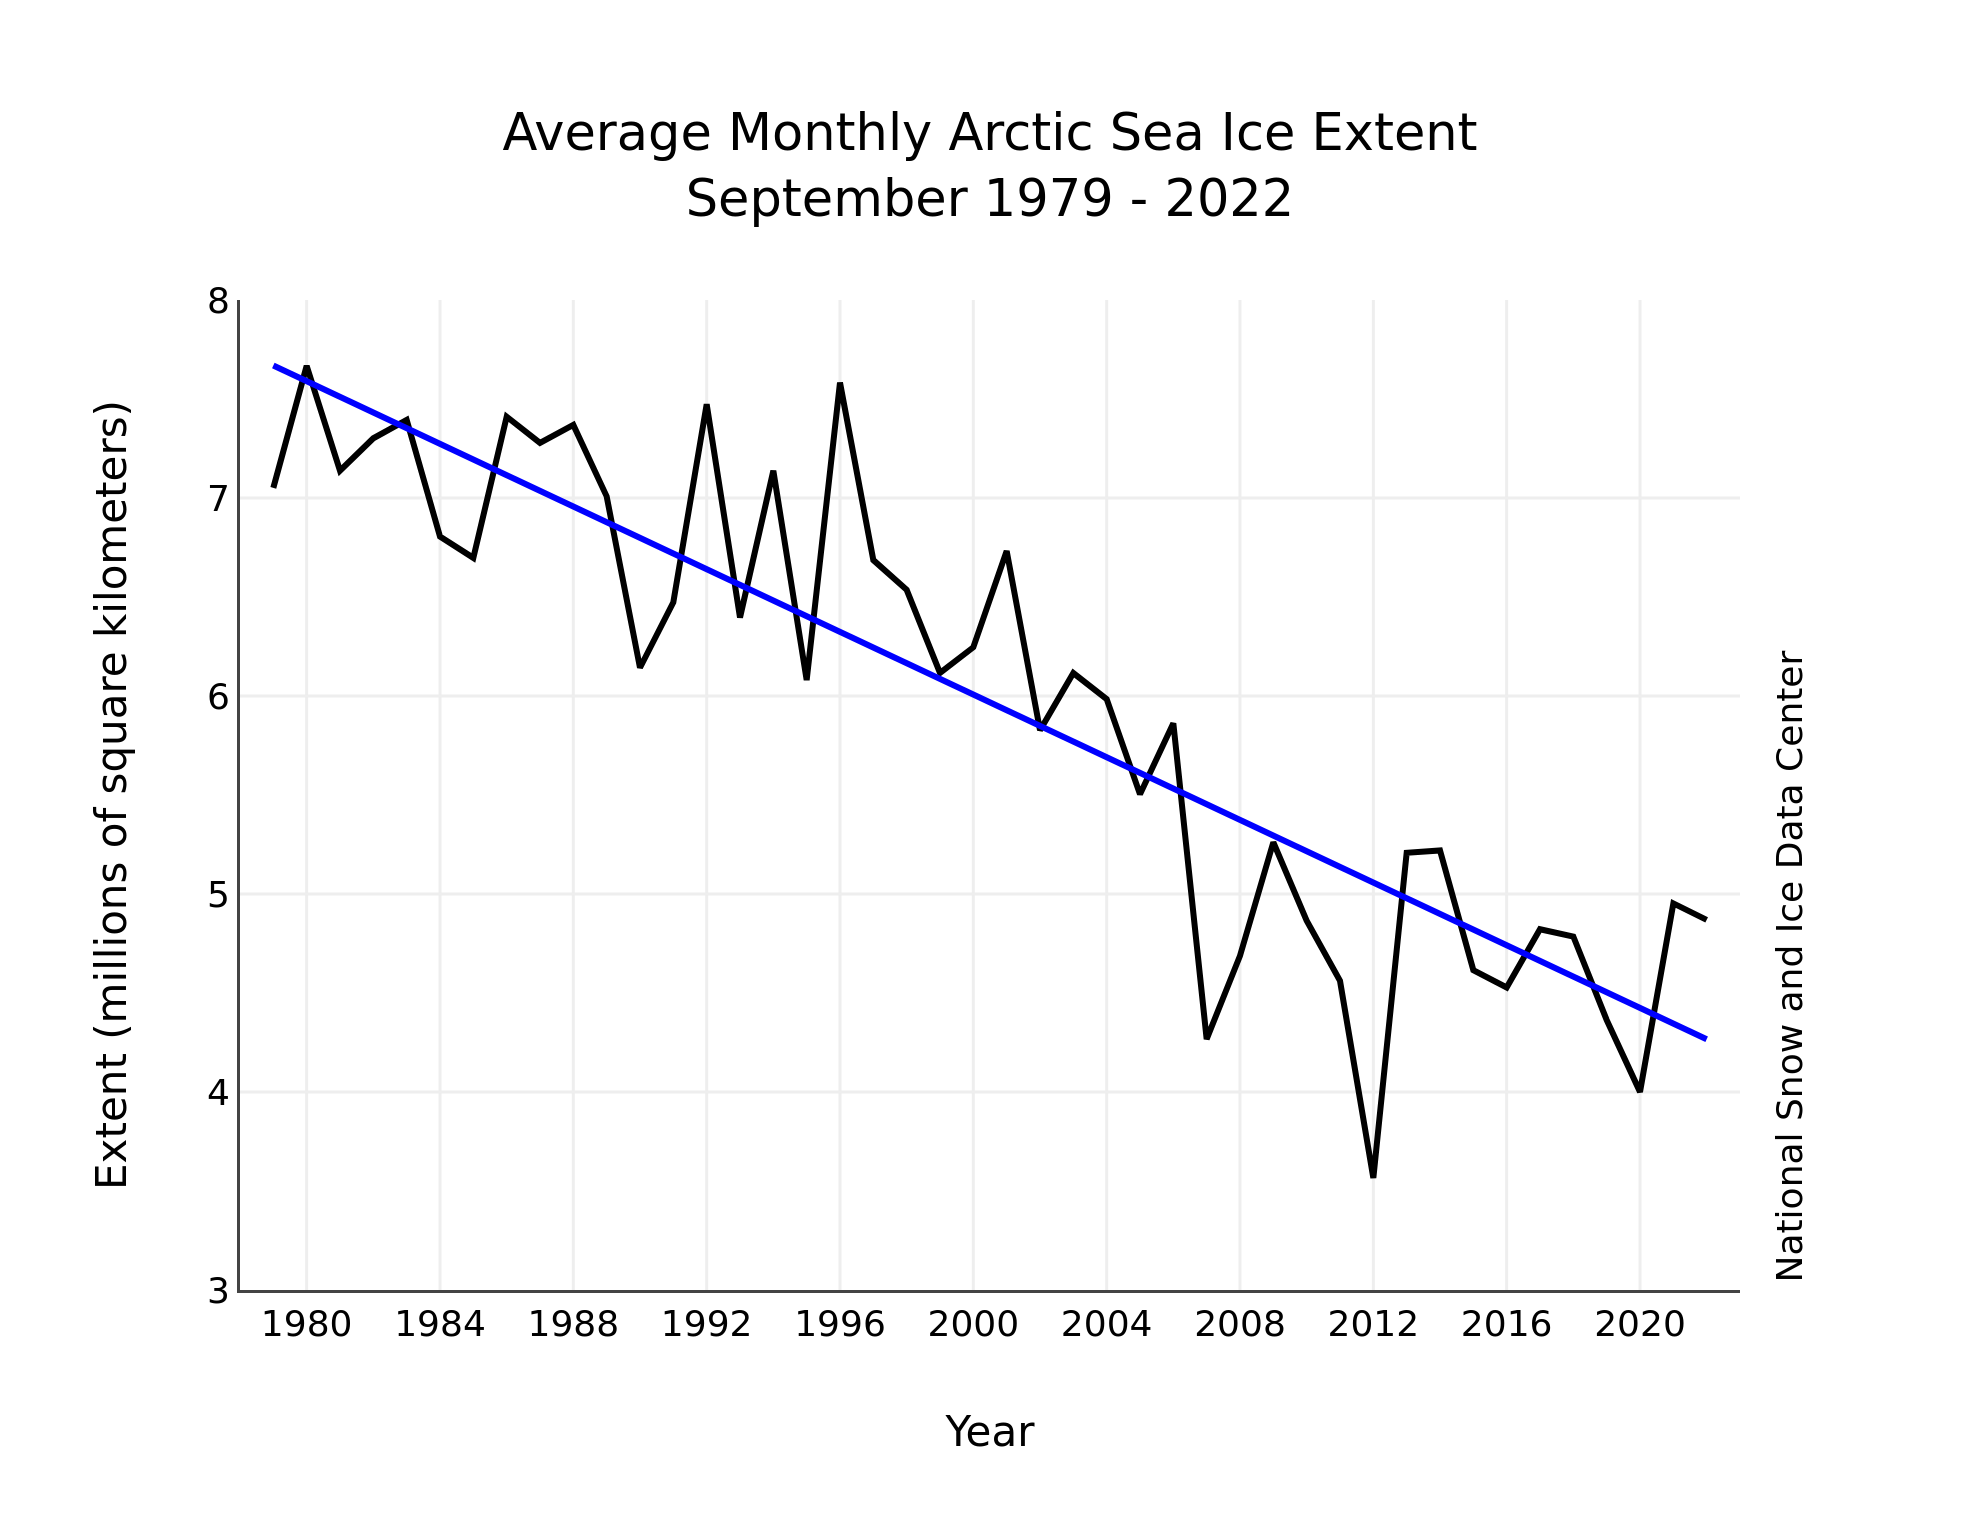
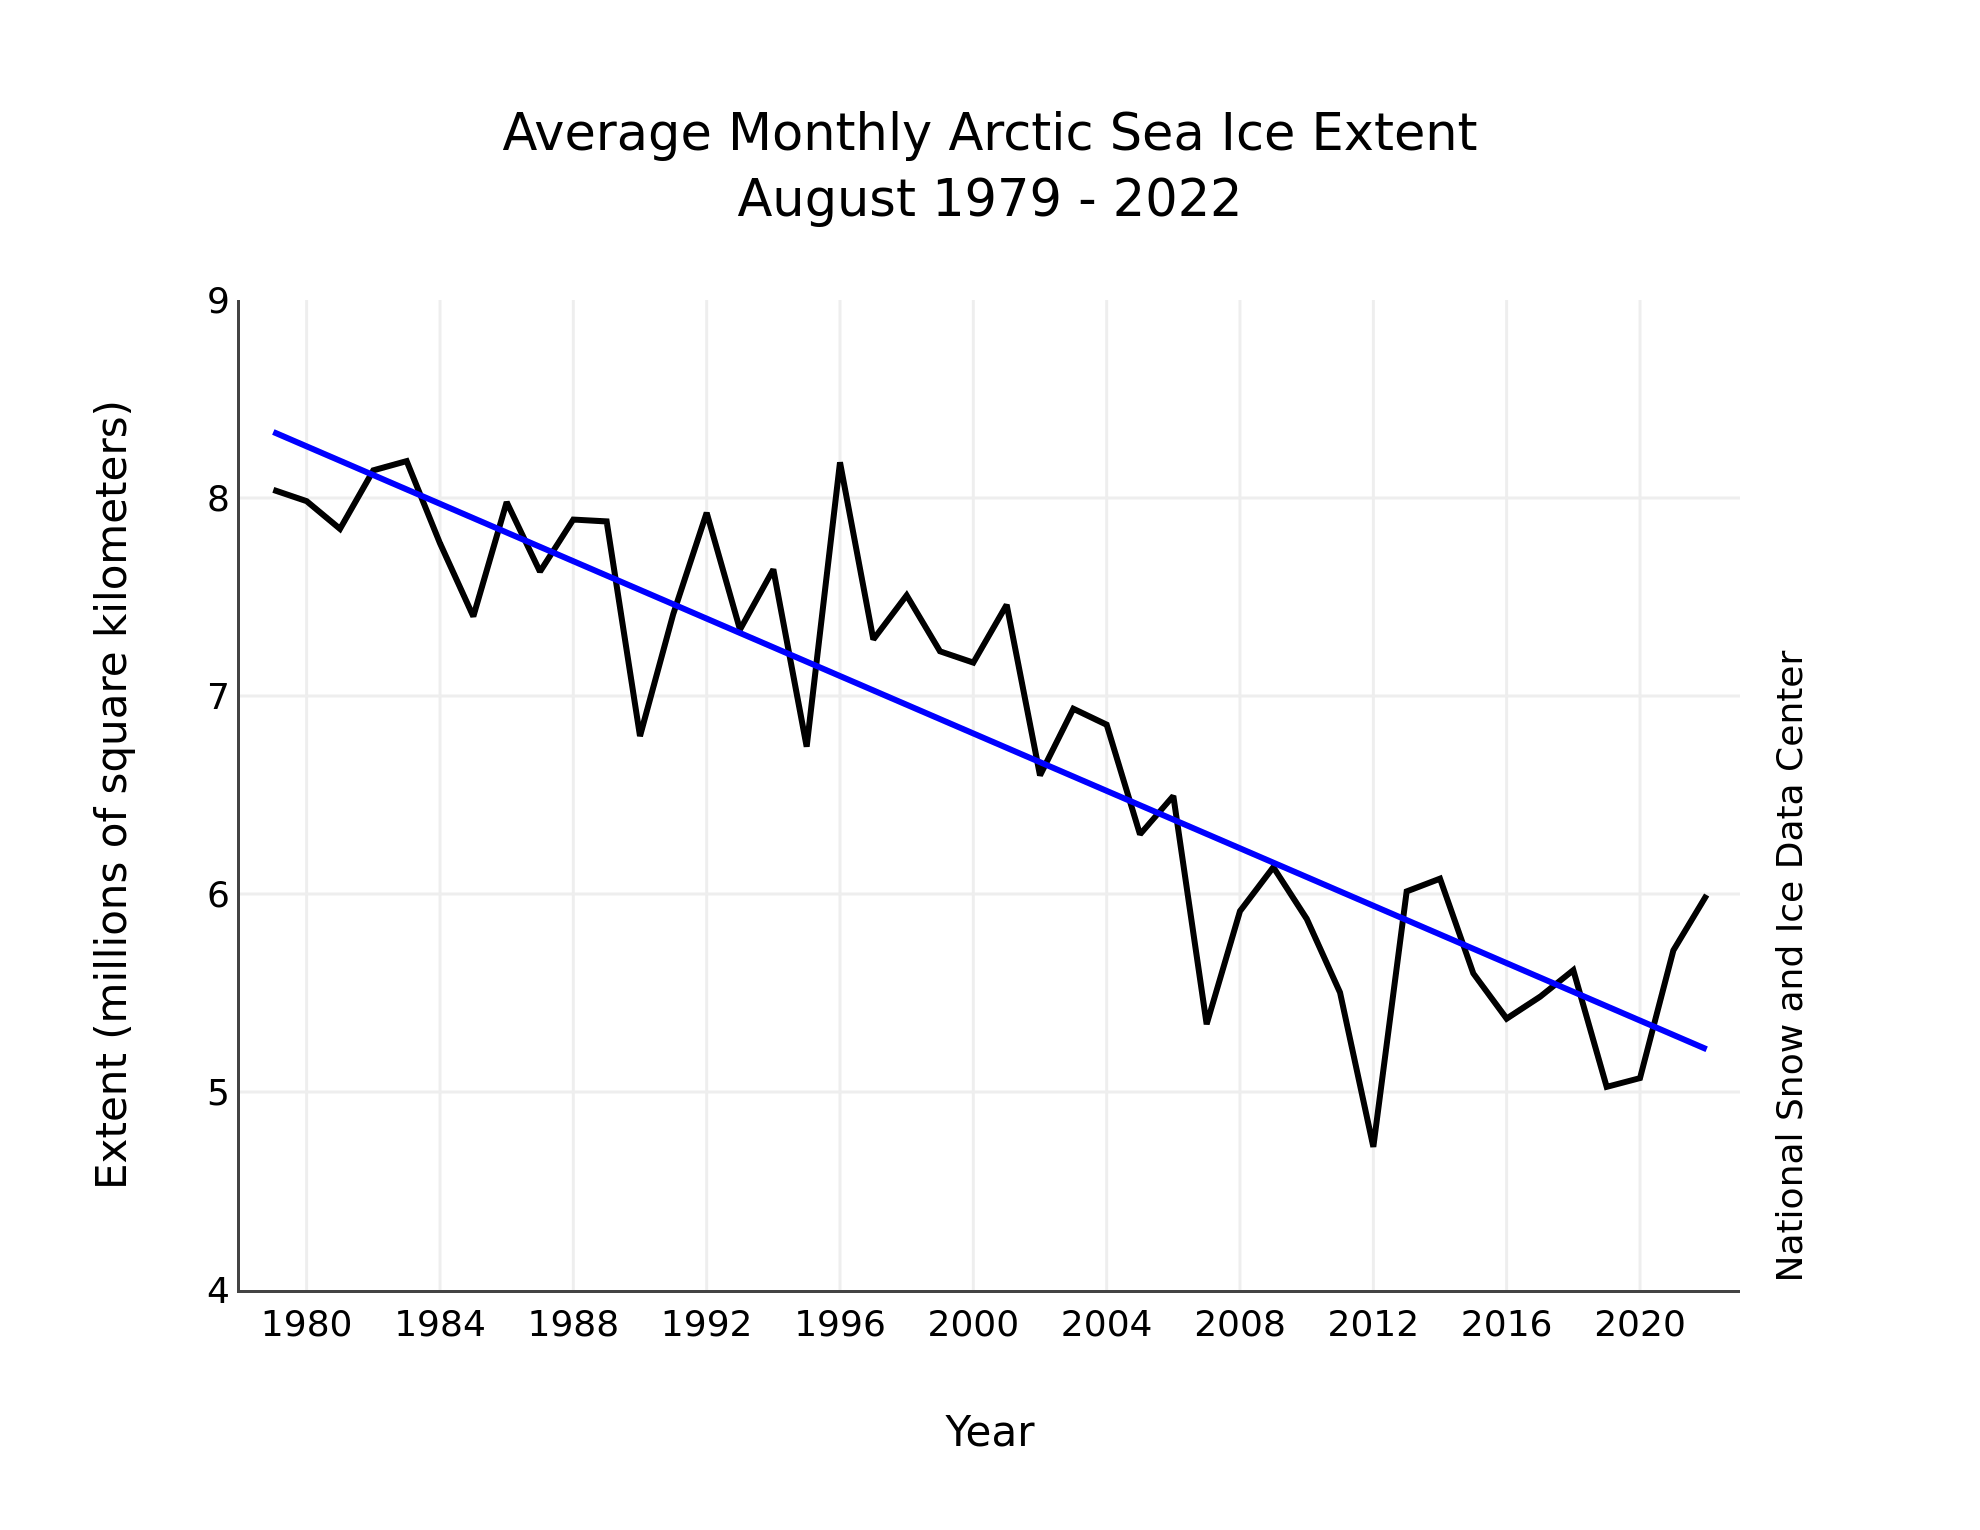
Figure 3. Monthly July ice extent for 1979 to 2023 shows a decline of 7.0 percent per decade.
Credit: National Snow and Ice Data Center
High-resolution image
The downward linear trend for Arctic sea ice extent in July over the 45-year satellite record is 66,500 square kilometers (25,700 square miles) per year, or 7.0 percent per decade relative to the 1981 to 2010 average (Figure 3). Based on the linear trend, since 1979, July has lost 2.92 million square kilometers (1.13 million square miles) of ice. This is roughly equivalent to four times the size of Texas.
An update on the Southern Hemisphere

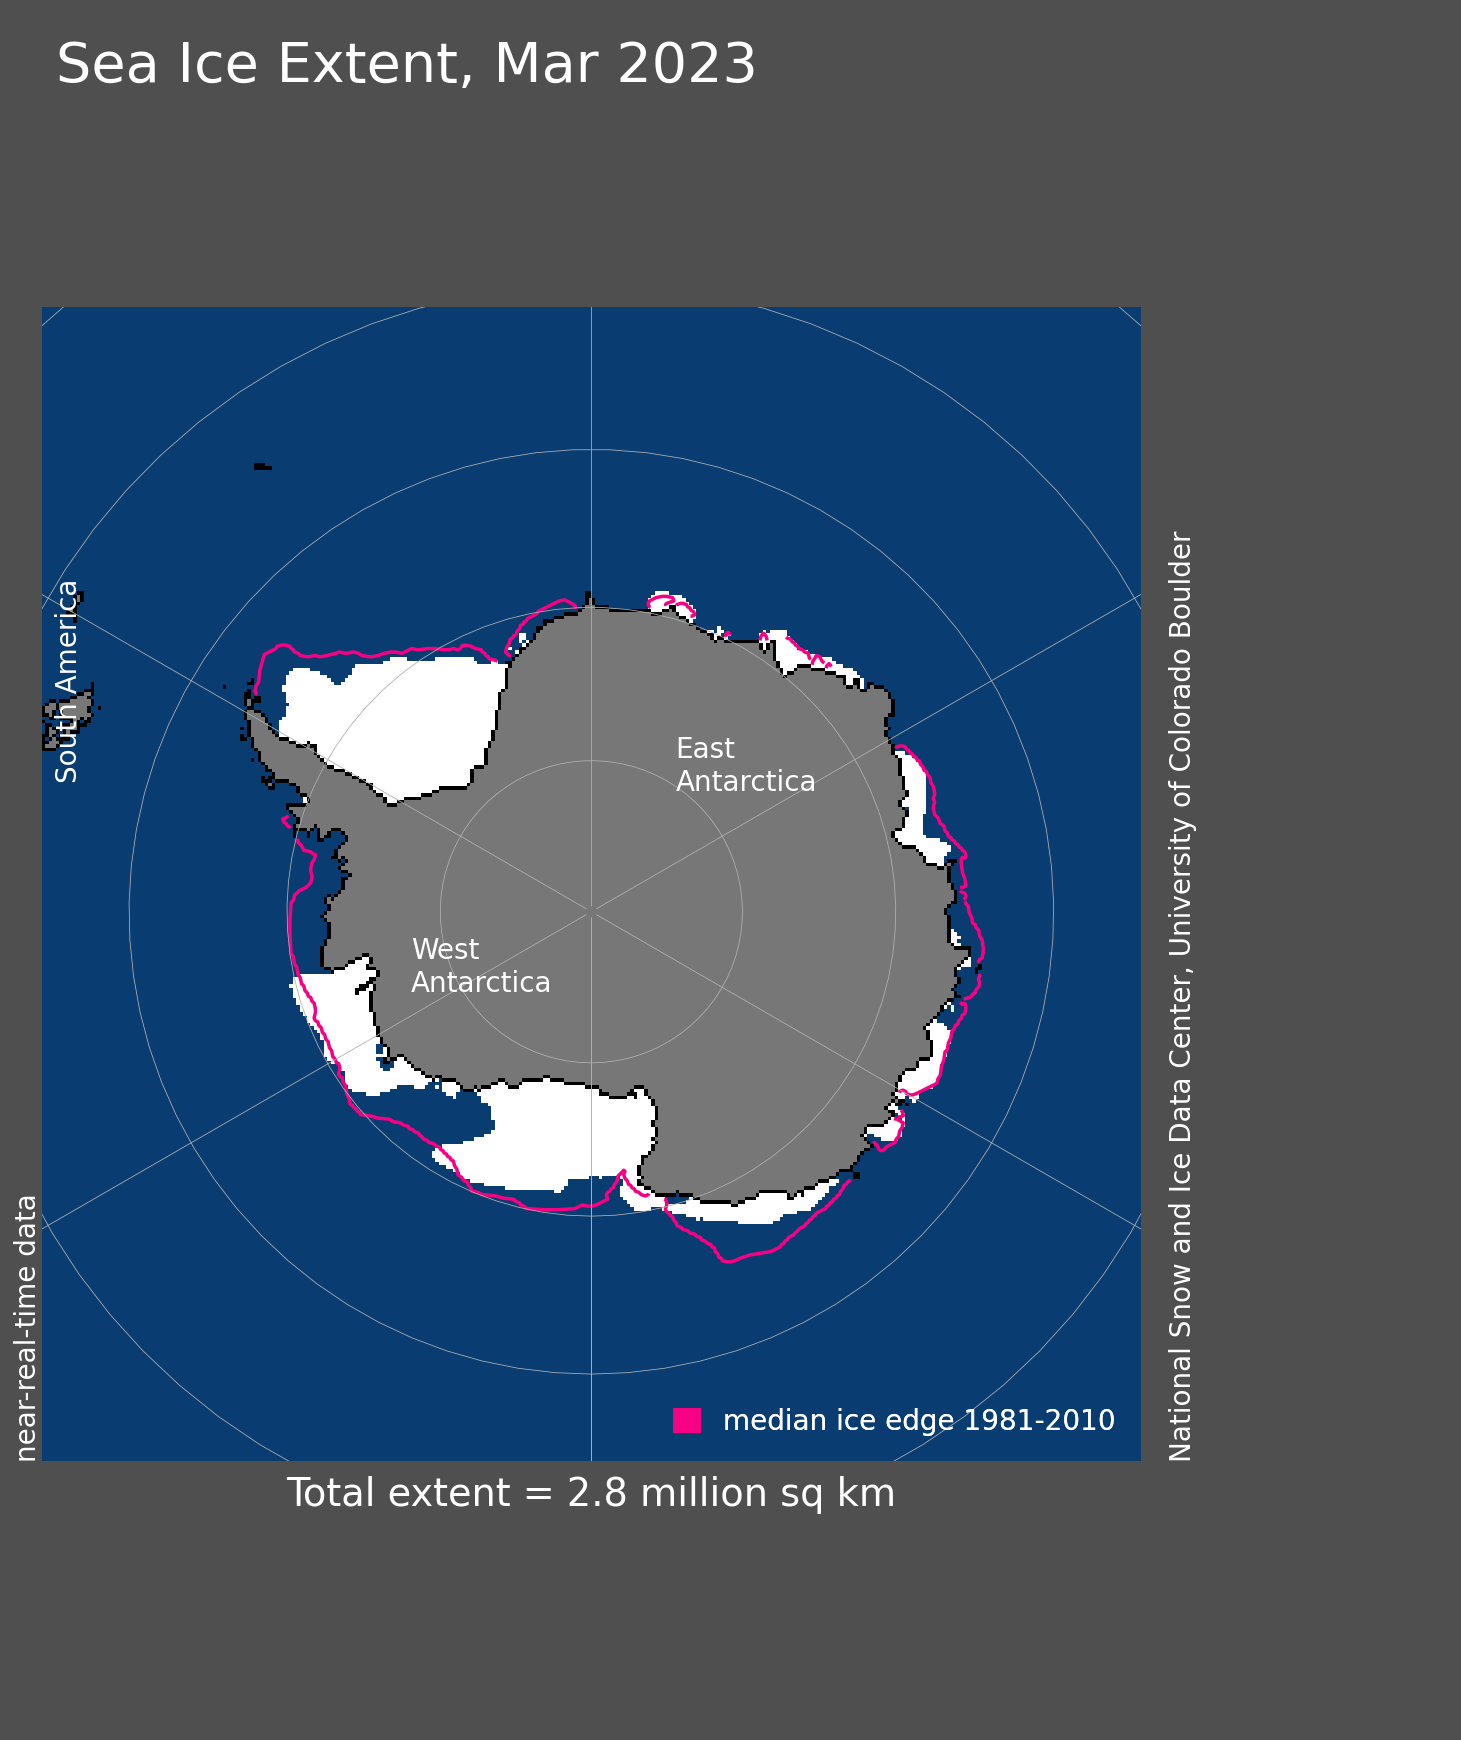
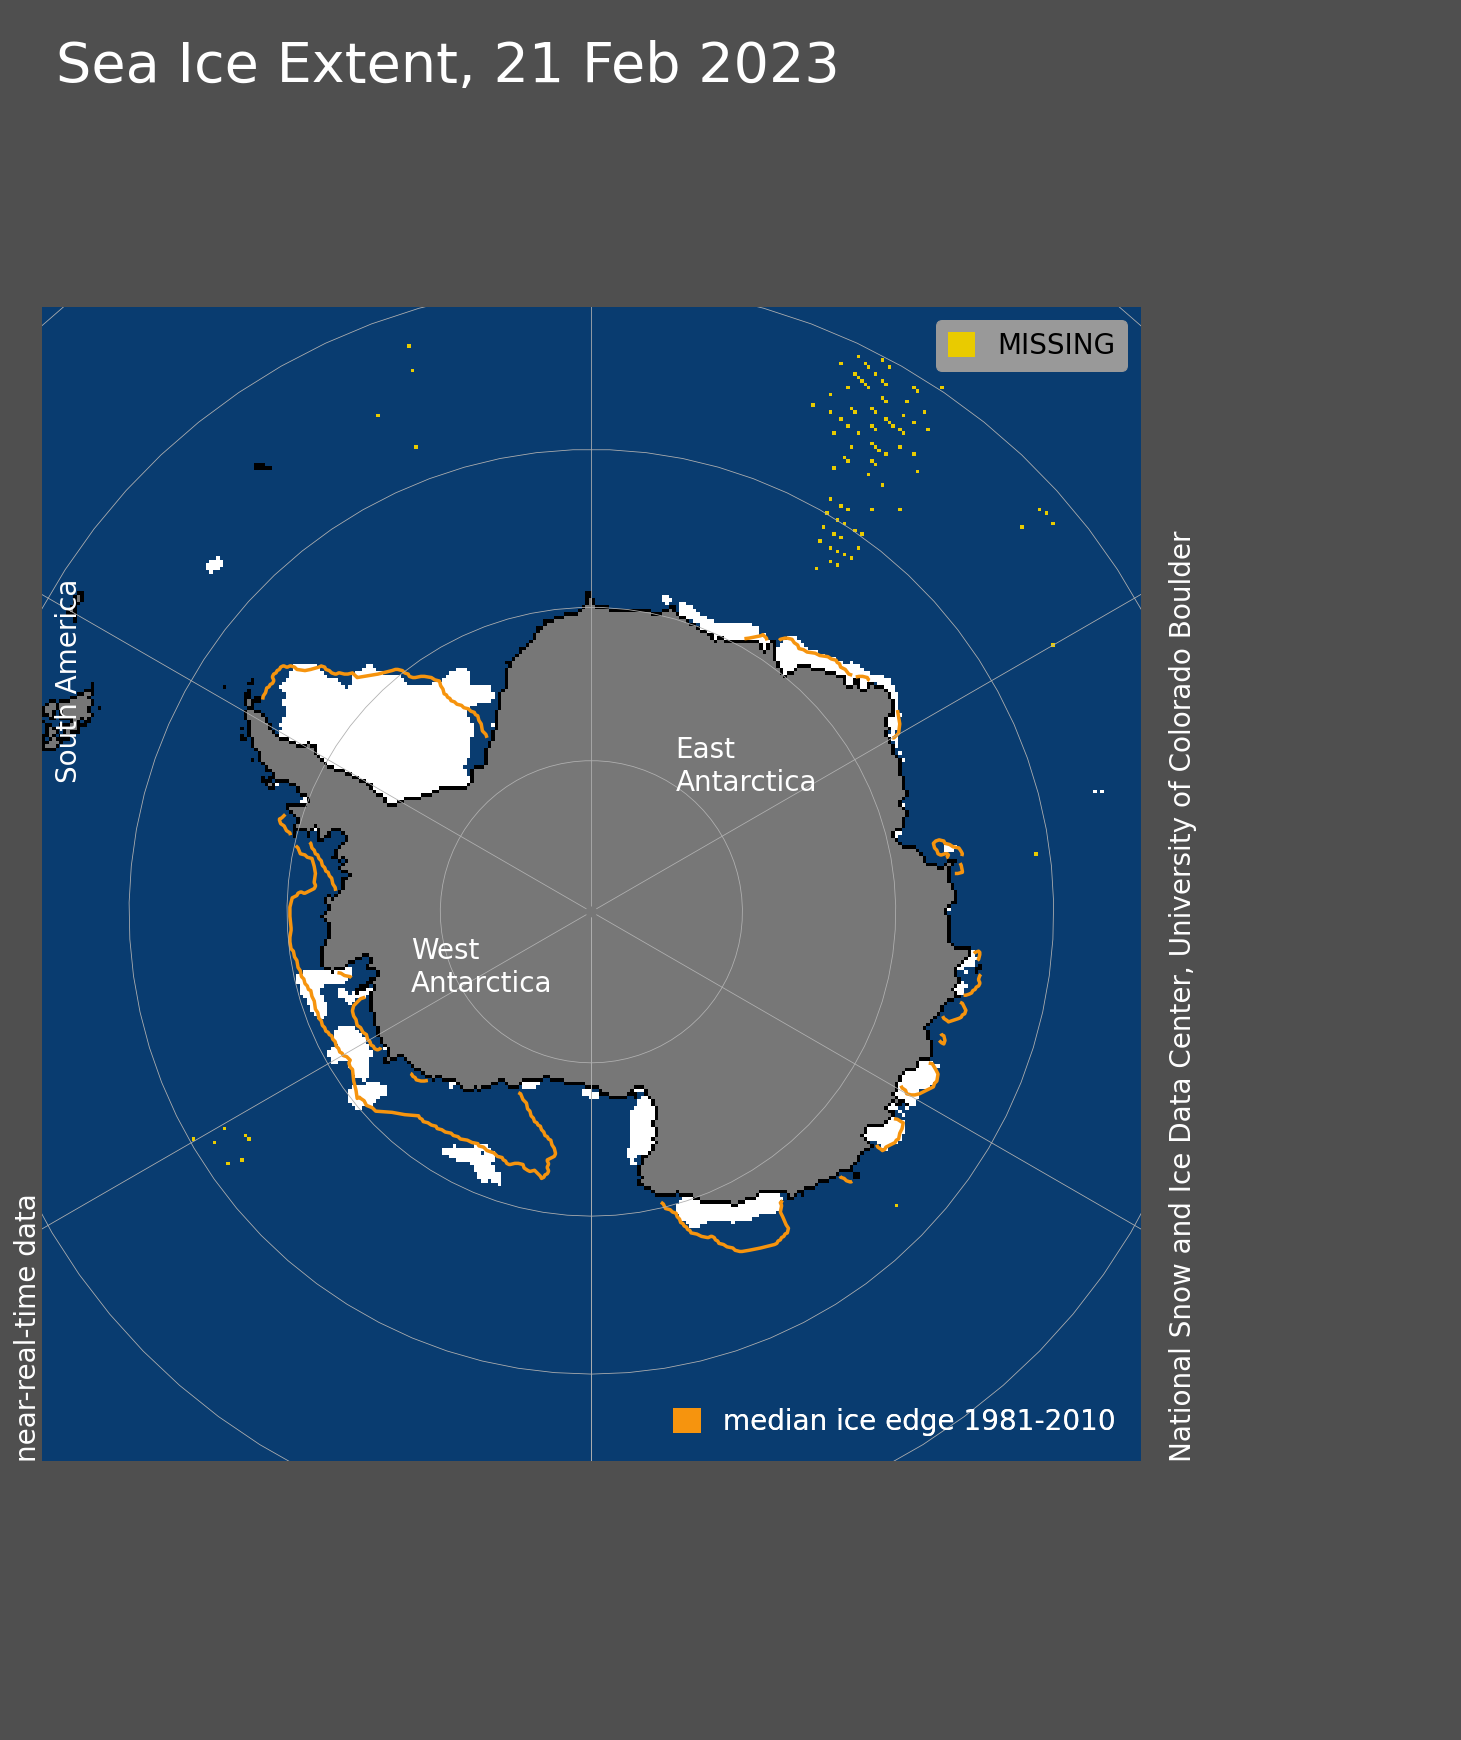
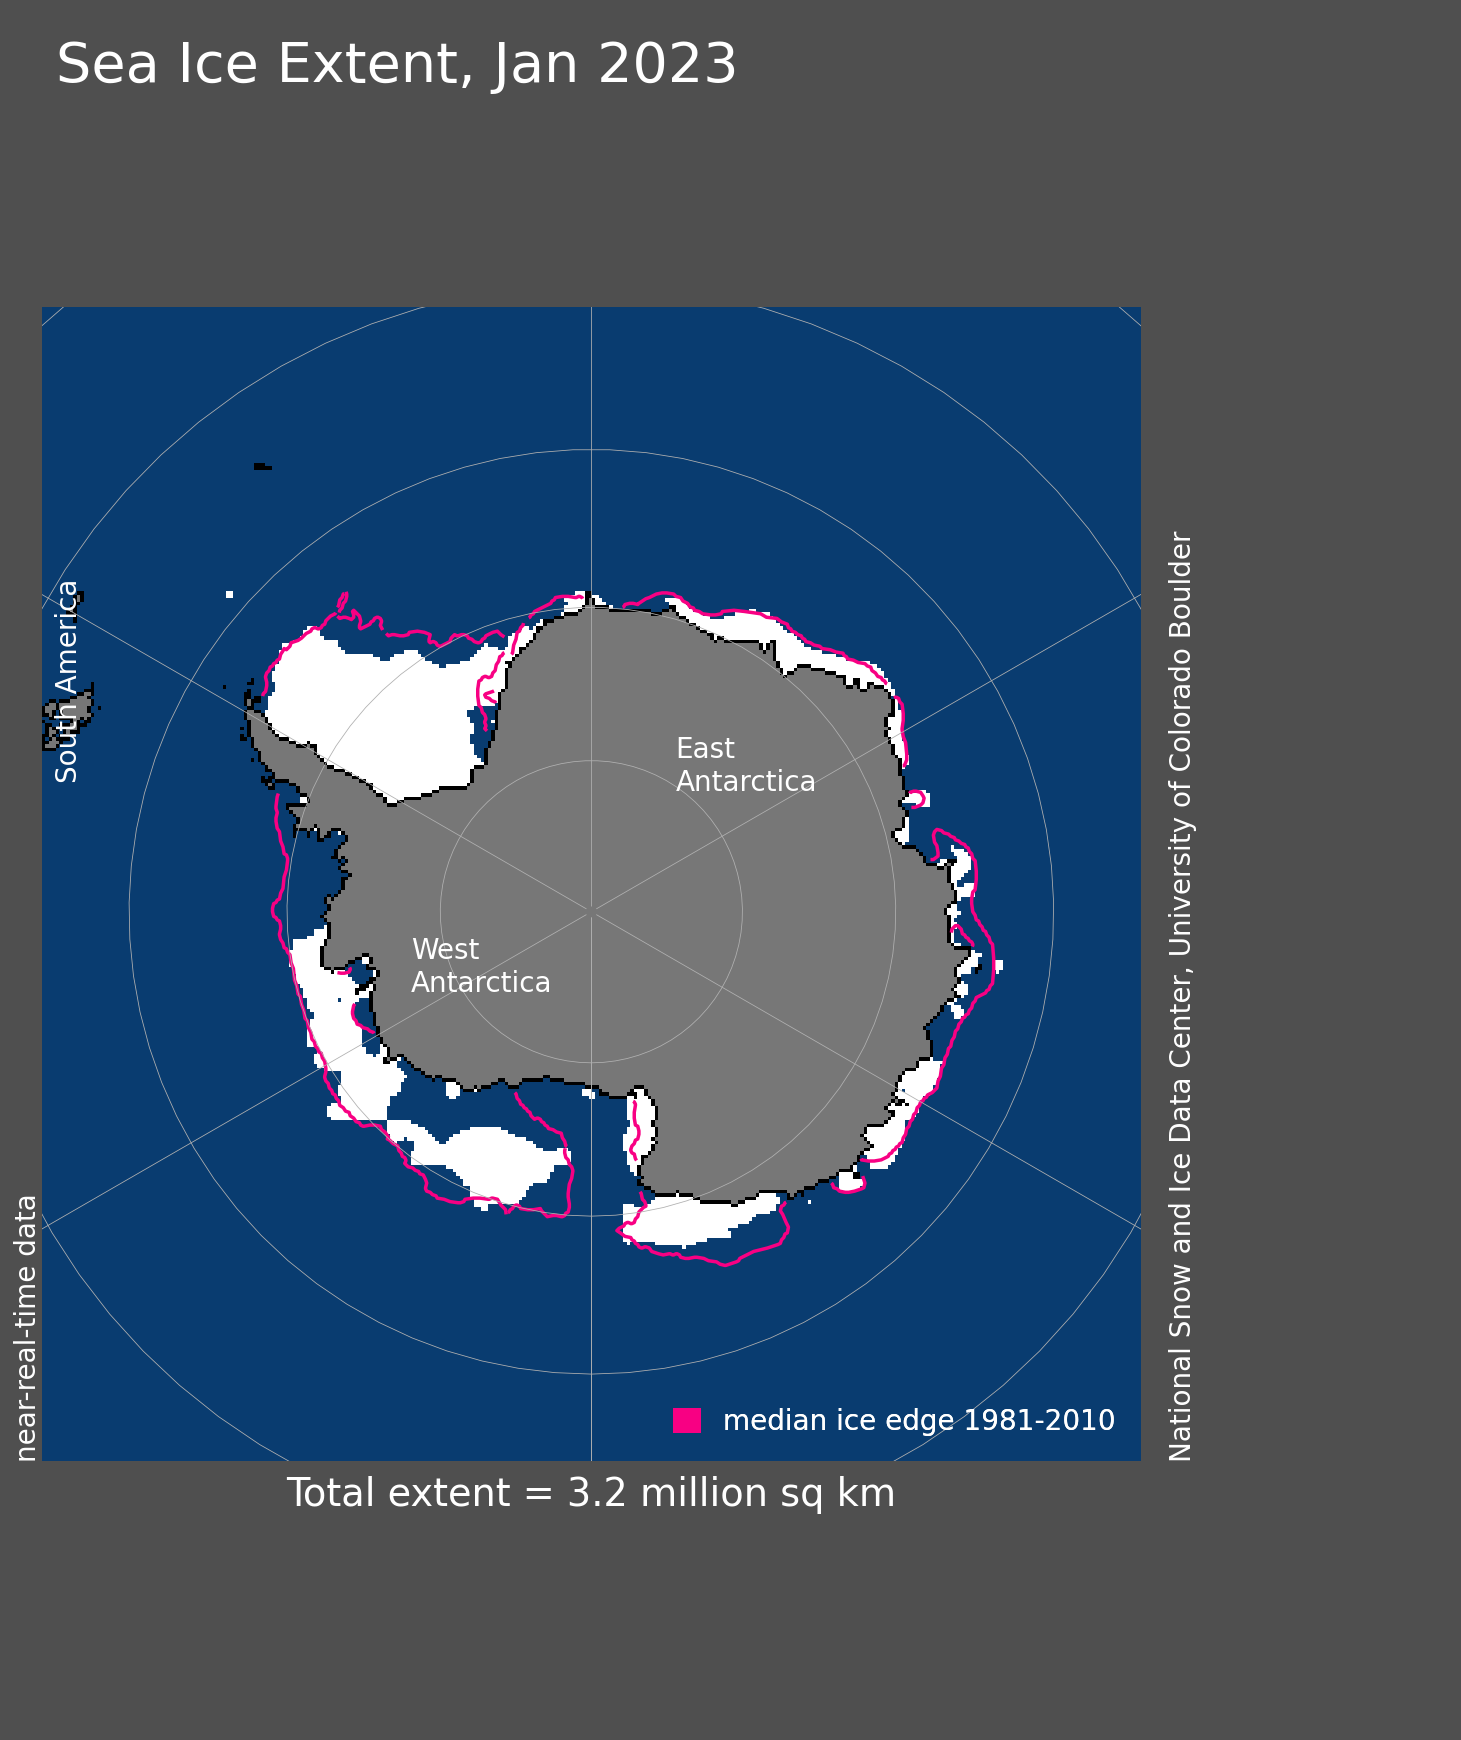
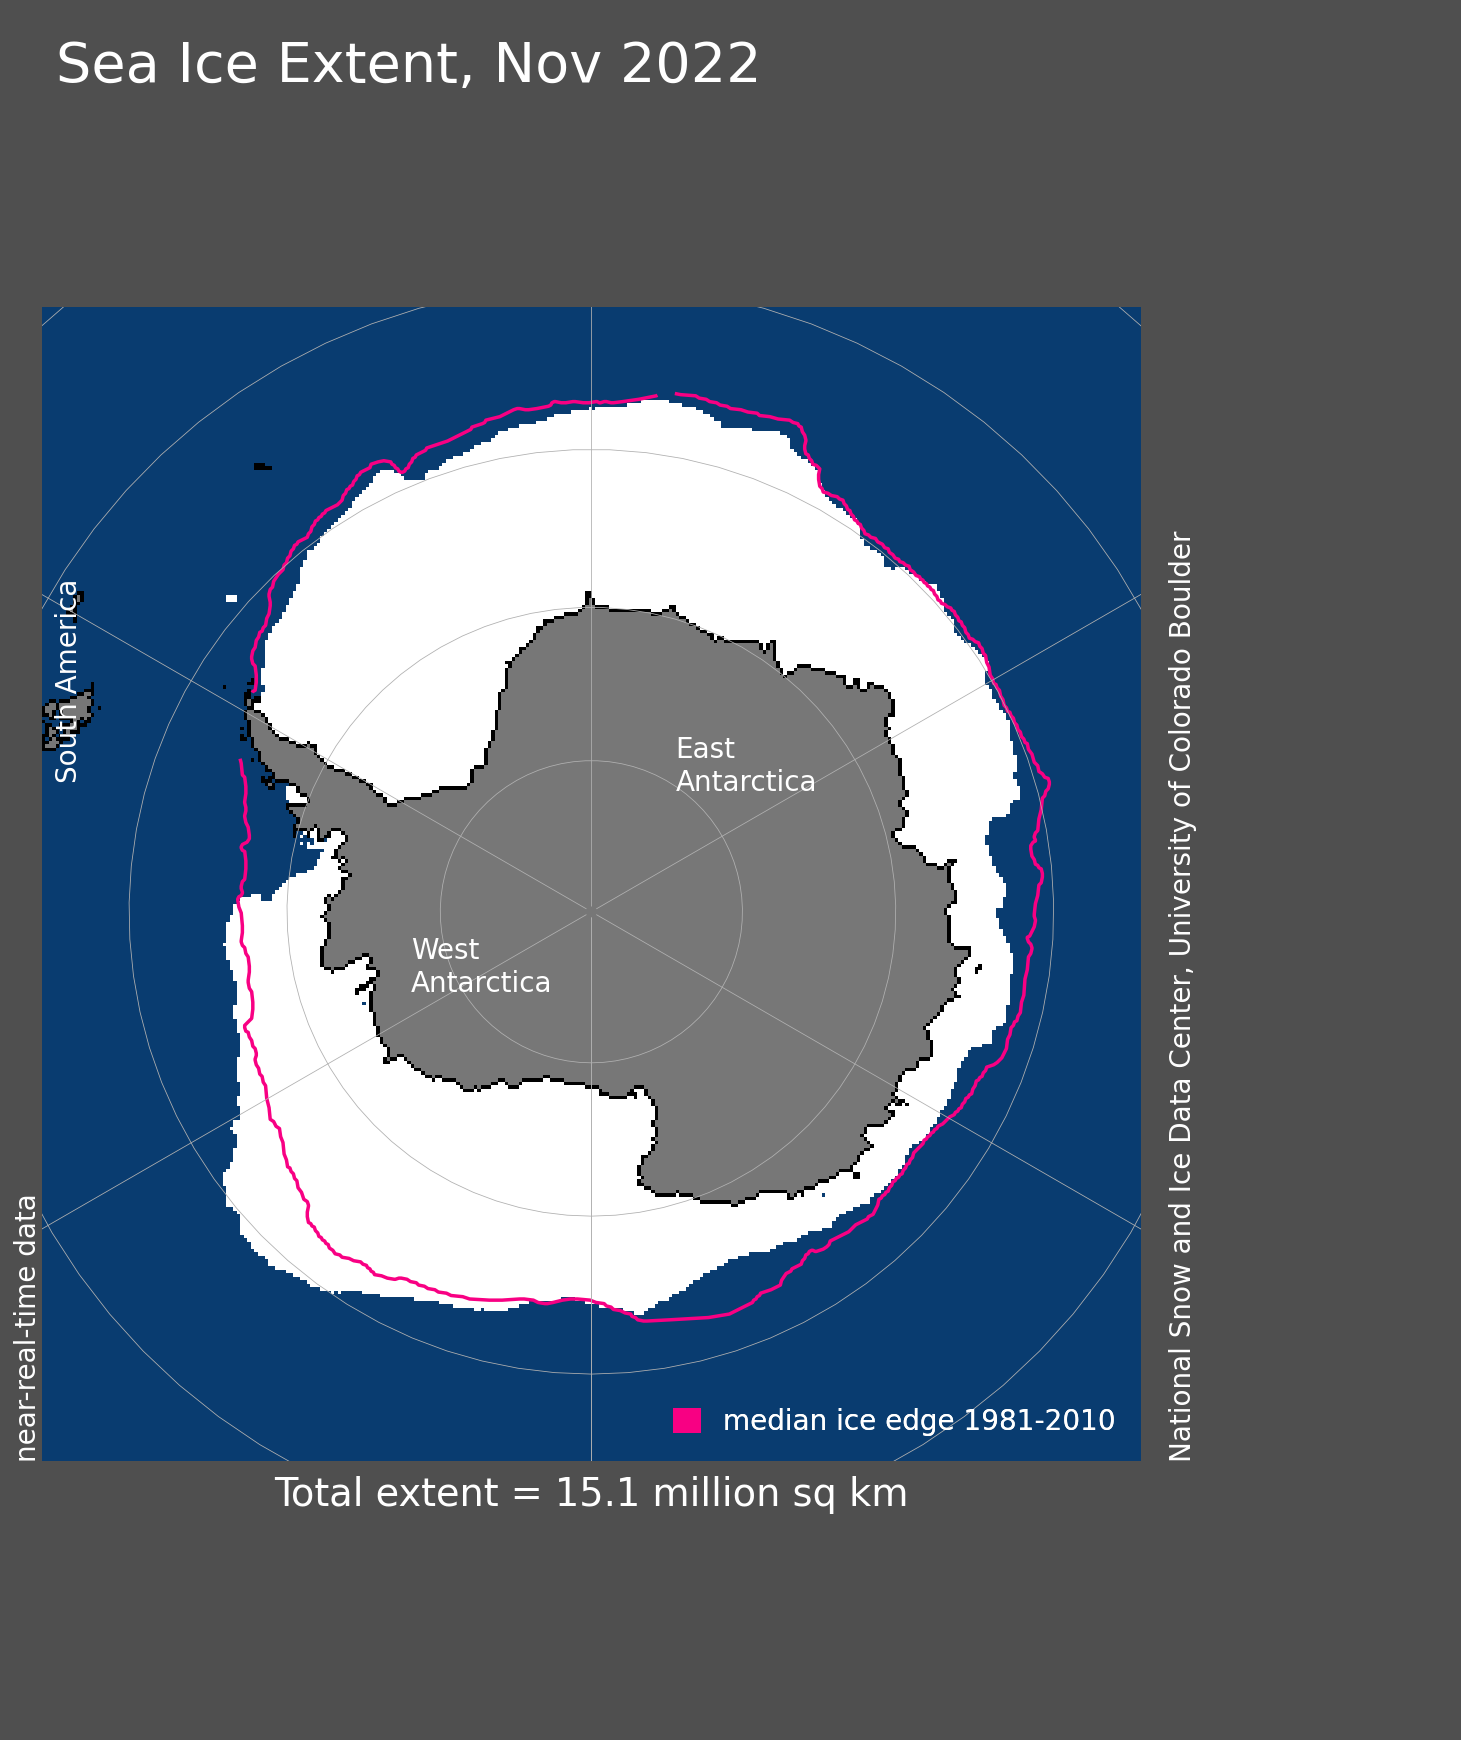
Figure 4a. Antarctic sea ice extent for July 2023 was 13.49 million square kilometers (5.21 million square miles). The magenta line shows the 1981 to 2010 average extent for that month. Sea Ice Index data. About the data
Credit: National Snow and Ice Data Center
High-resolution image
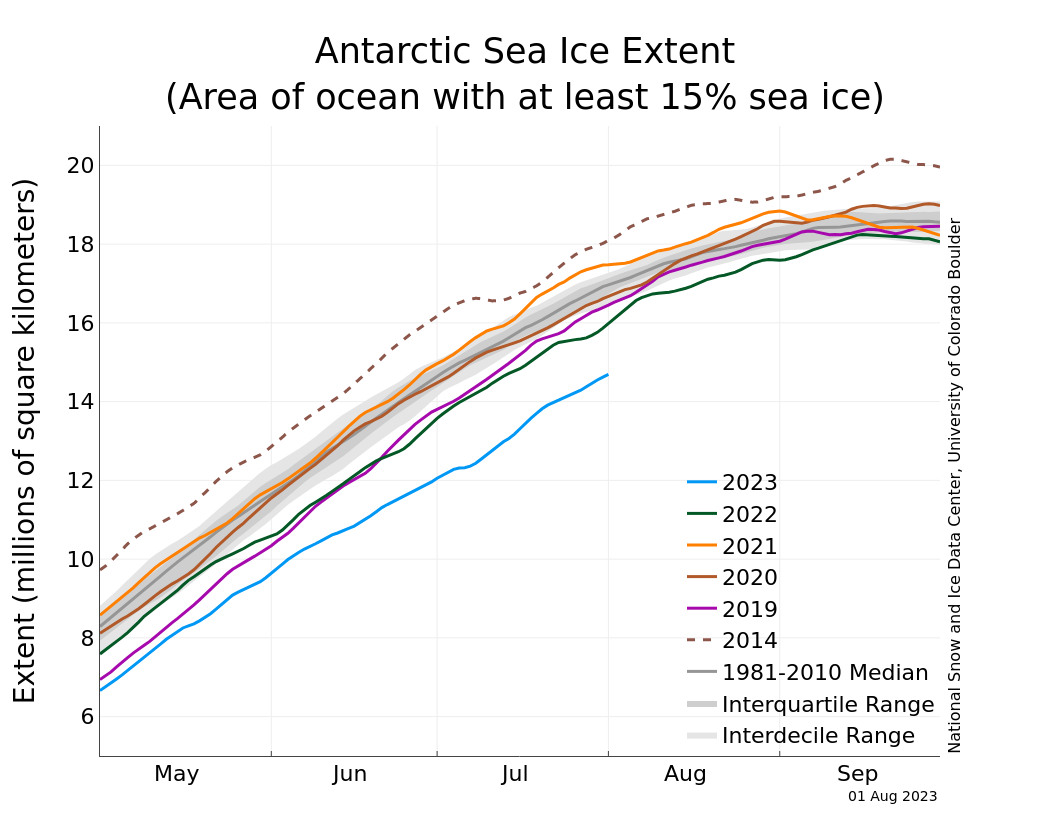
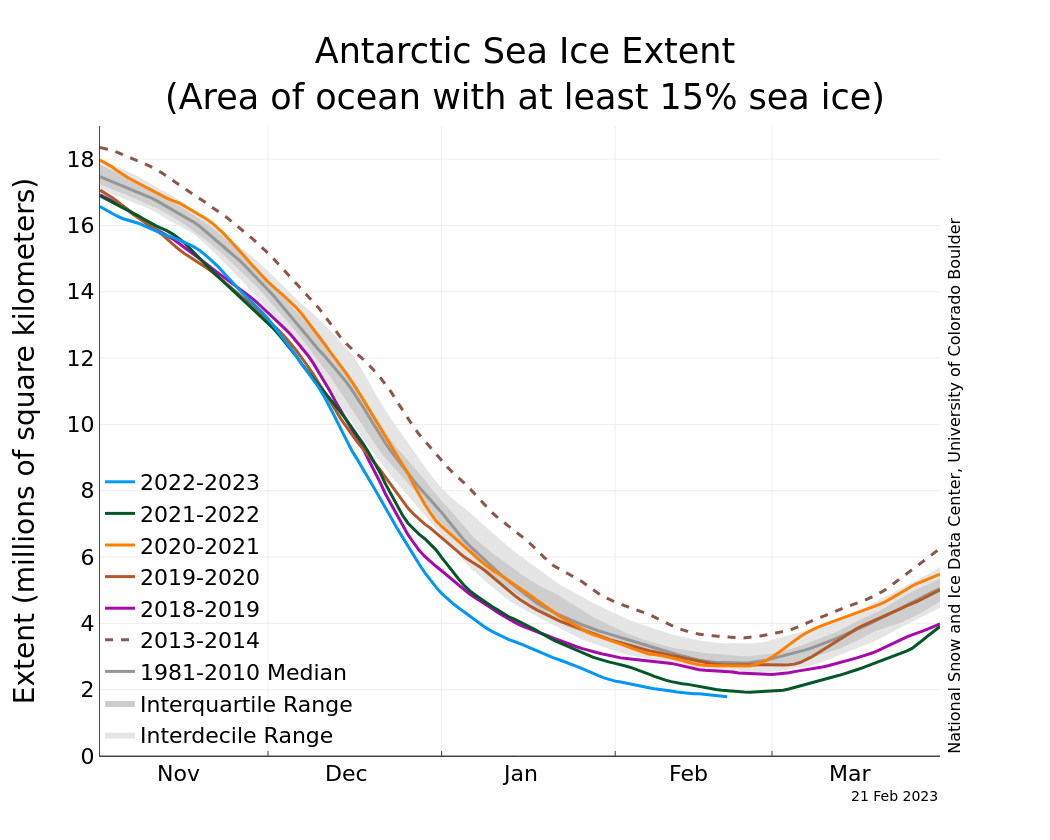
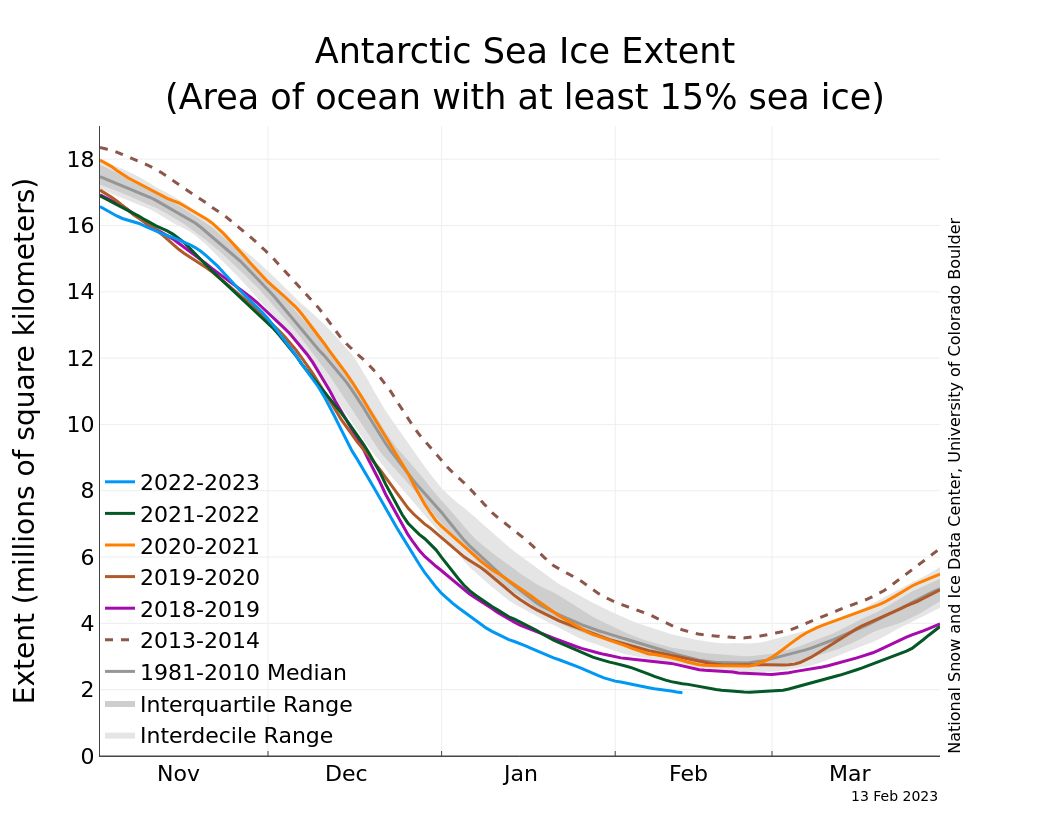
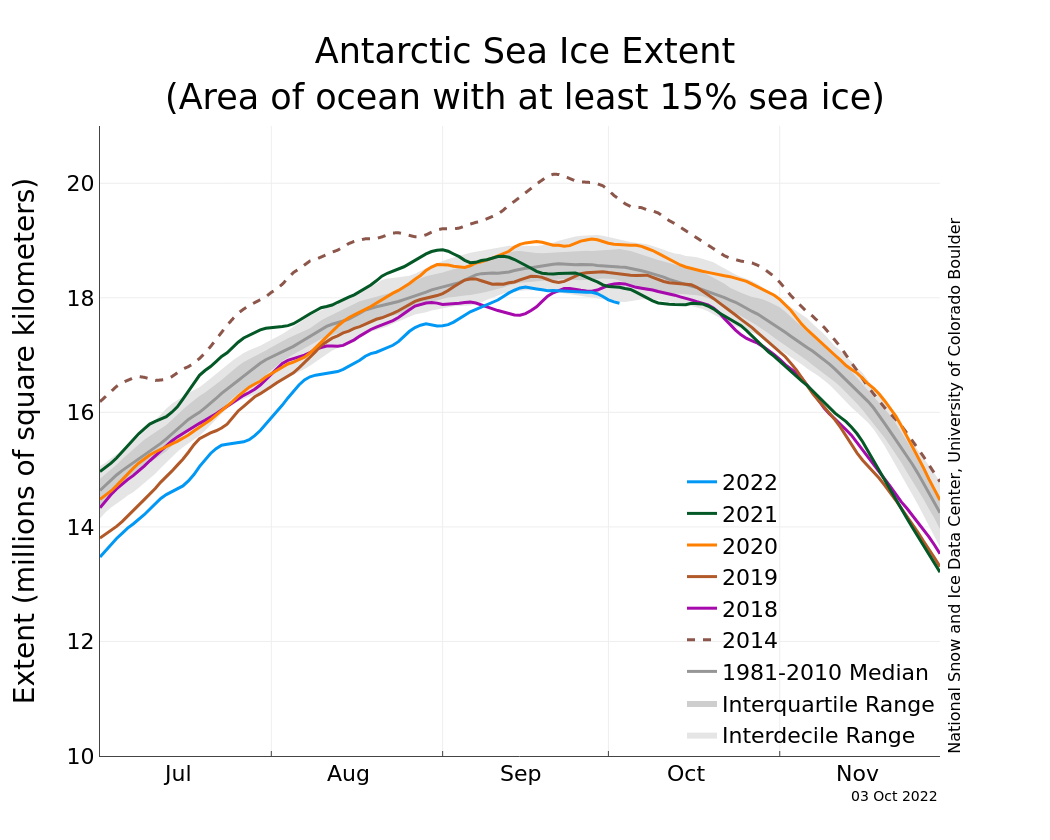
Figure 4b. The graph above shows Antarctic sea ice extent as of August 1, 2023, along with daily ice extent data for four previous years and the record high year. 2023 is shown in blue, 2022 in green, 2021 in orange, 2020 in brown, 2019 in magenta, and 2014 in dashed brown. The 1981 to 2010 median is in dark gray. The gray areas around the median line show the interquartile and interdecile ranges of the data. Sea Ice Index data.
Credit: National Snow and Ice Data Center
High-resolution image
While Arctic sea ice is in the midst of the melt season, Antarctic sea ice is growing, but only slowly for this time of year. Antarctic sea ice extent averaged for July was at a record low at 13.49 million square kilometers (5.21 million square miles), and 1.50 million square kilometers (579,000 square miles) below the previous satellite record low set in 2022 (Figure 4a and 4b). As discussed in the previous post, there is speculation that the Antarctic sea ice system has entered a new regime, in which ocean heat is now playing a stronger role in limiting autumn and winter ice growth and enhancing spring and summer melt.
While this very low extent has garnered much attention, as well as consternation, a study led by colleague Dave Gallaher several years ago provides evidence from early Nimbus satellite data that sea ice extent in the winter of 1966 may have rivaled the very low level seen today. There are caveats. First, the Nimbus data for 1966 is for August, not September, the month with the annual highest average extent in the Antarctic. Second, there is substantial uncertainty in the 1966 extent because of the limited data from the low resolution visible-band Nimbus images (notably cloud cover) and challenges in interpreting the imagery. The estimated August 1966 sea ice extent from Nimbus is 15.90 million square kilometers (6.14 million square miles). A simple projection, based on data through July 1, yields an August 2023 extent of August 15.07 million square kilometers (5.82 million square miles), still significantly lower than the 1966 data suggest. Despite these uncertainties, the Nimbus data is consistent with observations from the satellite passive microwave record that Antarctic sea ice extent is highly variable.
A second information source, from a reconstruction of Antarctic sea ice led by Ryan Fogt, a professor at Ohio University, suggests that the present level is well below anything seen since the earliest Southern Ocean weather observations, back to 1905. Fogt and colleagues first established how weather station data are correlated with observed sea ice extent from 1979 through 2020. Using this information together with weather station records that go back to the early 1900s, they deduce what sea ice extent was likely to have been between 1905 and 2020, along with what its variability was likely to have been.
Further reading
Fogt, R. L., A. M. Sleinkofer, M. N. Raphael, H. S. and Handcock. 2022a. A regime shift in seasonal total Antarctic sea ice extent in the twentieth century. Nature Climate Change 12, 54– 62. doi:10.1038/s41558-021-01254-9.
Gallaher, D. W., G. G. Campbell, W. N. and Meier. 2013. Anomalous variability in Antarctic sea ice extents during the 1960s with the use of Nimbus data. IEEE Journal of Selected Topics in Applied Earth Observations and Remote Sensing, 7(3), 881-887. doi:10.1109/JSTARS.2013.2264391.


