Following the 2024 maximum sea ice extent on March 14, Arctic ice extent has declined slowly such that 2024 March average is the fifteenth lowest in the passive microwave satellite record. The atmospheric circulation pattern for March 2024 featured a strong pressure gradient across Fram Strait, likely promoting strong winds from the north and therefore strong sea ice export out of the Arctic. An update on sea ice age reveals continued scarcity of the oldest age classes. A new study highlights the uncertainty as to when a seasonally ice-free Arctic Ocean can be expected.
Overview of conditions
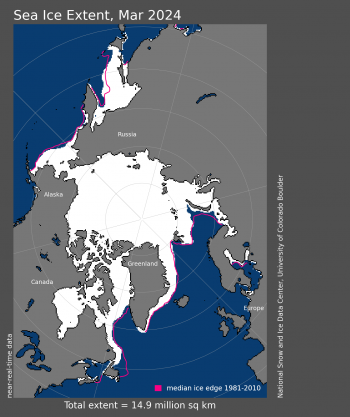
Figure 1a. Arctic sea ice extent for March 2024 was 14.87 million square kilometers (5.74 million square miles). The magenta line shows the 1981 to 2010 average extent for that month. Sea Ice Index data. About the data
Credit: National Snow and Ice Data Center
High-resolution image
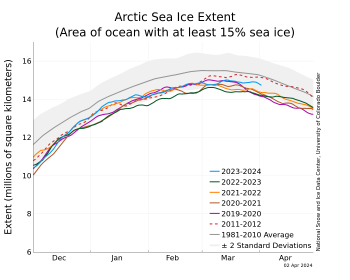
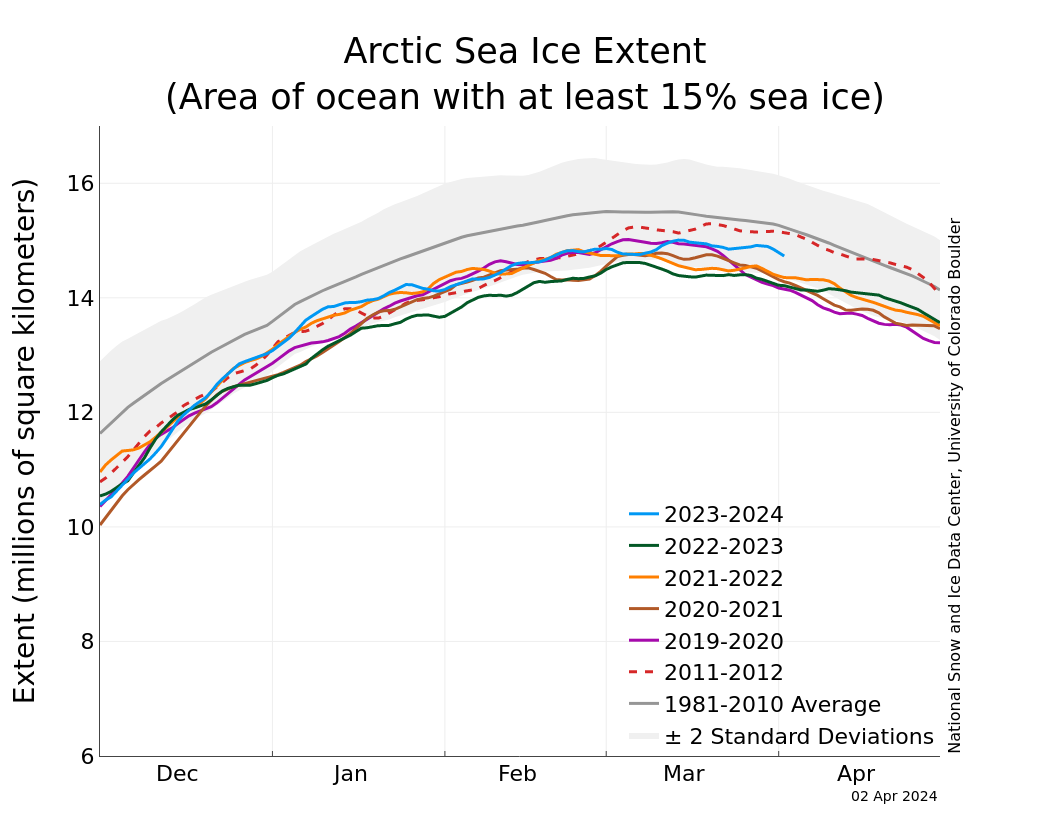
Figure 1b. The graph above shows Arctic sea ice extent as of April 2, 2024, along with daily ice extent data for four previous years and the record low year. 2023 to 2024 is shown in blue, 2022 to 2023 in green, 2021 to 2022 in orange, 2020 to 2021 in brown, 2019 to 2020 in magenta, and 2011 to 2012 in dashed brown. The 1981 to 2010 median is in dark gray. The gray areas around the median line show the interquartile and interdecile ranges of the data. Sea Ice Index data.
Credit: National Snow and Ice Data Center
High-resolution image
The average ice extent for March 2024 is 14.87 million square kilometers (5.74 million square miles), fifteenth lowest in the passive microwave satellite record (Figure 1a). As of the beginning of April 2024, Arctic sea ice extent had dropped by about 278,000 square kilometers (107,000 square miles) below the March 14 maximum (Figure 1b). Extent is notably low only in the Sea of Okhotsk, Barents Sea, Labrador Sea, and Davis Strait. Extent is near average in the Bering Sea, counter to the pattern of below average extent in this region characterizing many recent years.
Conditions in context

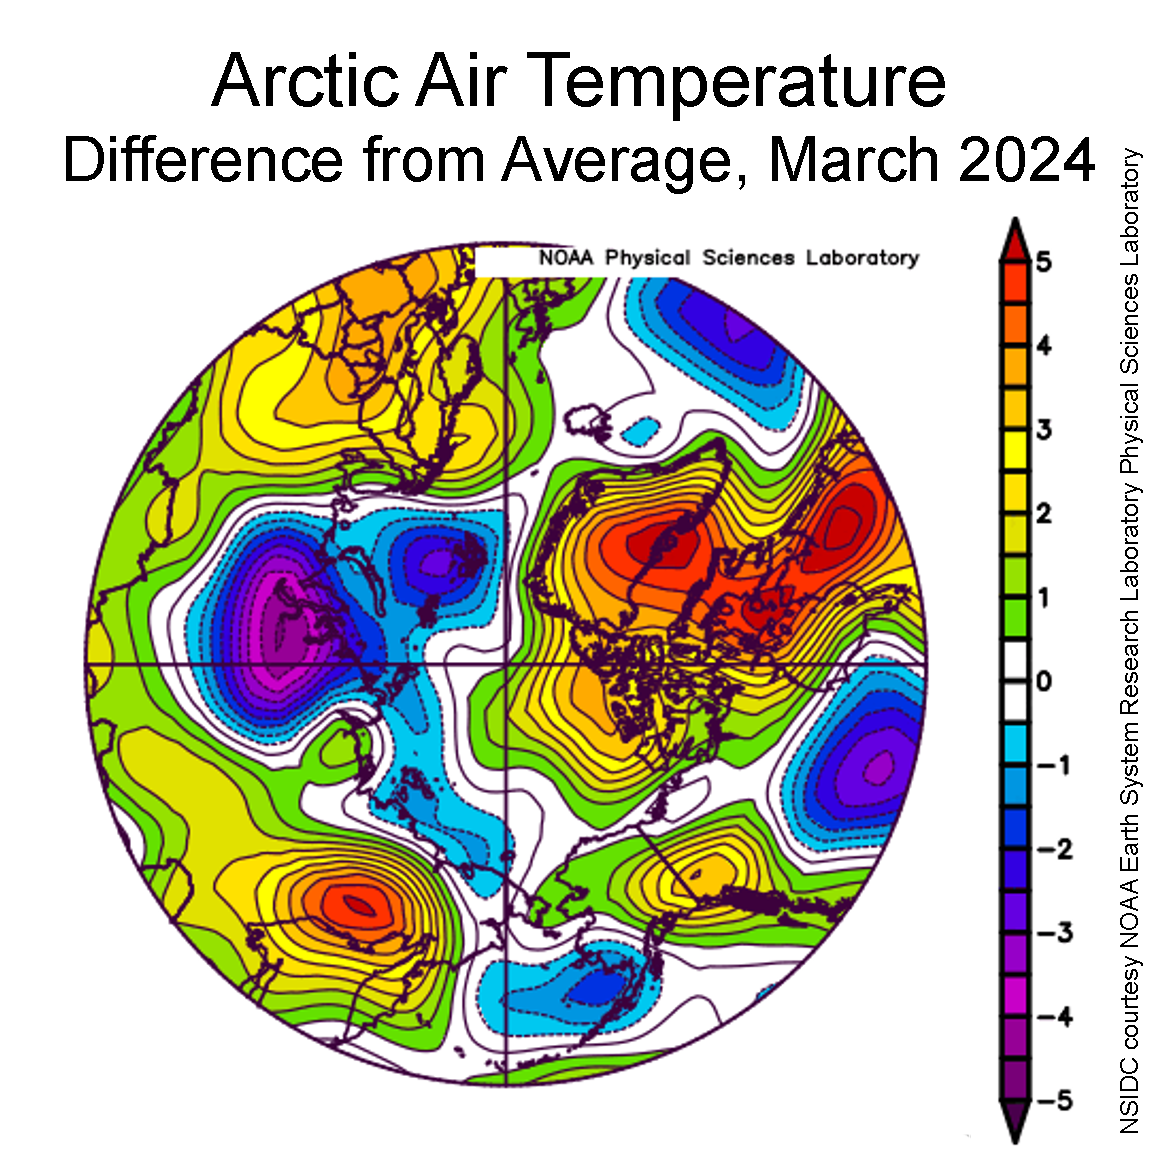
Figure 2a. This plot shows the departure from average air temperature in the Arctic at the 925 hPa level, in degrees Celsius, for March 2024. Yellows and reds indicate above average temperatures; blues and purples indicate below average temperatures.
Credit: NSIDC courtesy NOAA Earth System Research Laboratory Physical Sciences Laboratory
High-resolution image
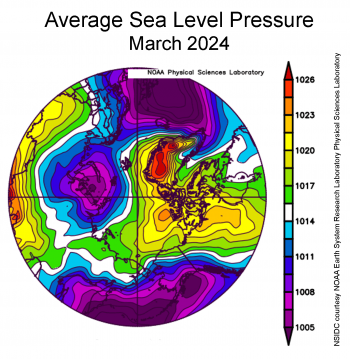
Figure 2b. This plot shows average sea level pressure in the Arctic in millibars for March 2024. Yellows and reds indicate high air pressure; blues and purples indicate low pressure.
Credit: NSIDC courtesy NOAA Earth System Research Laboratory Physical Sciences Laboratory
High-resolution image
Air temperatures for March 2024 at the 925 hPa level (about 2,500 feet above the surface) were below average in the Barents Sea and along the Eurasian coast at 1 to 3 degrees Celsius (2 to 5 degrees Fahrenheit) contrasting with above average values of 2 to 5 degrees Celsius (4 to 9 degrees Fahrenheit) over the Canadian Arctic Archipelago, Greenland, and Baffin Bay (Figure 2a). This was attended by an unusual atmospheric circulation pattern at sea level (Figure 2b), with high pressure over the North American side of the Arctic and low pressure centered over the Kara Sea, leading to a strong intervening pressure gradient across the Fram Strait. This implies strong winds from the north directed down the strait, which likely favored a strong export of sea ice out of the Arctic Ocean. Whether this pattern continues to persist bears watching.
March 2024 compared to previous years
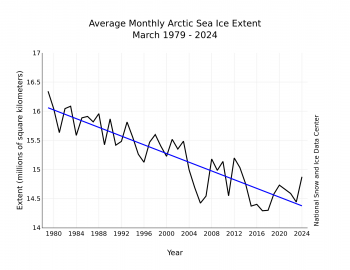
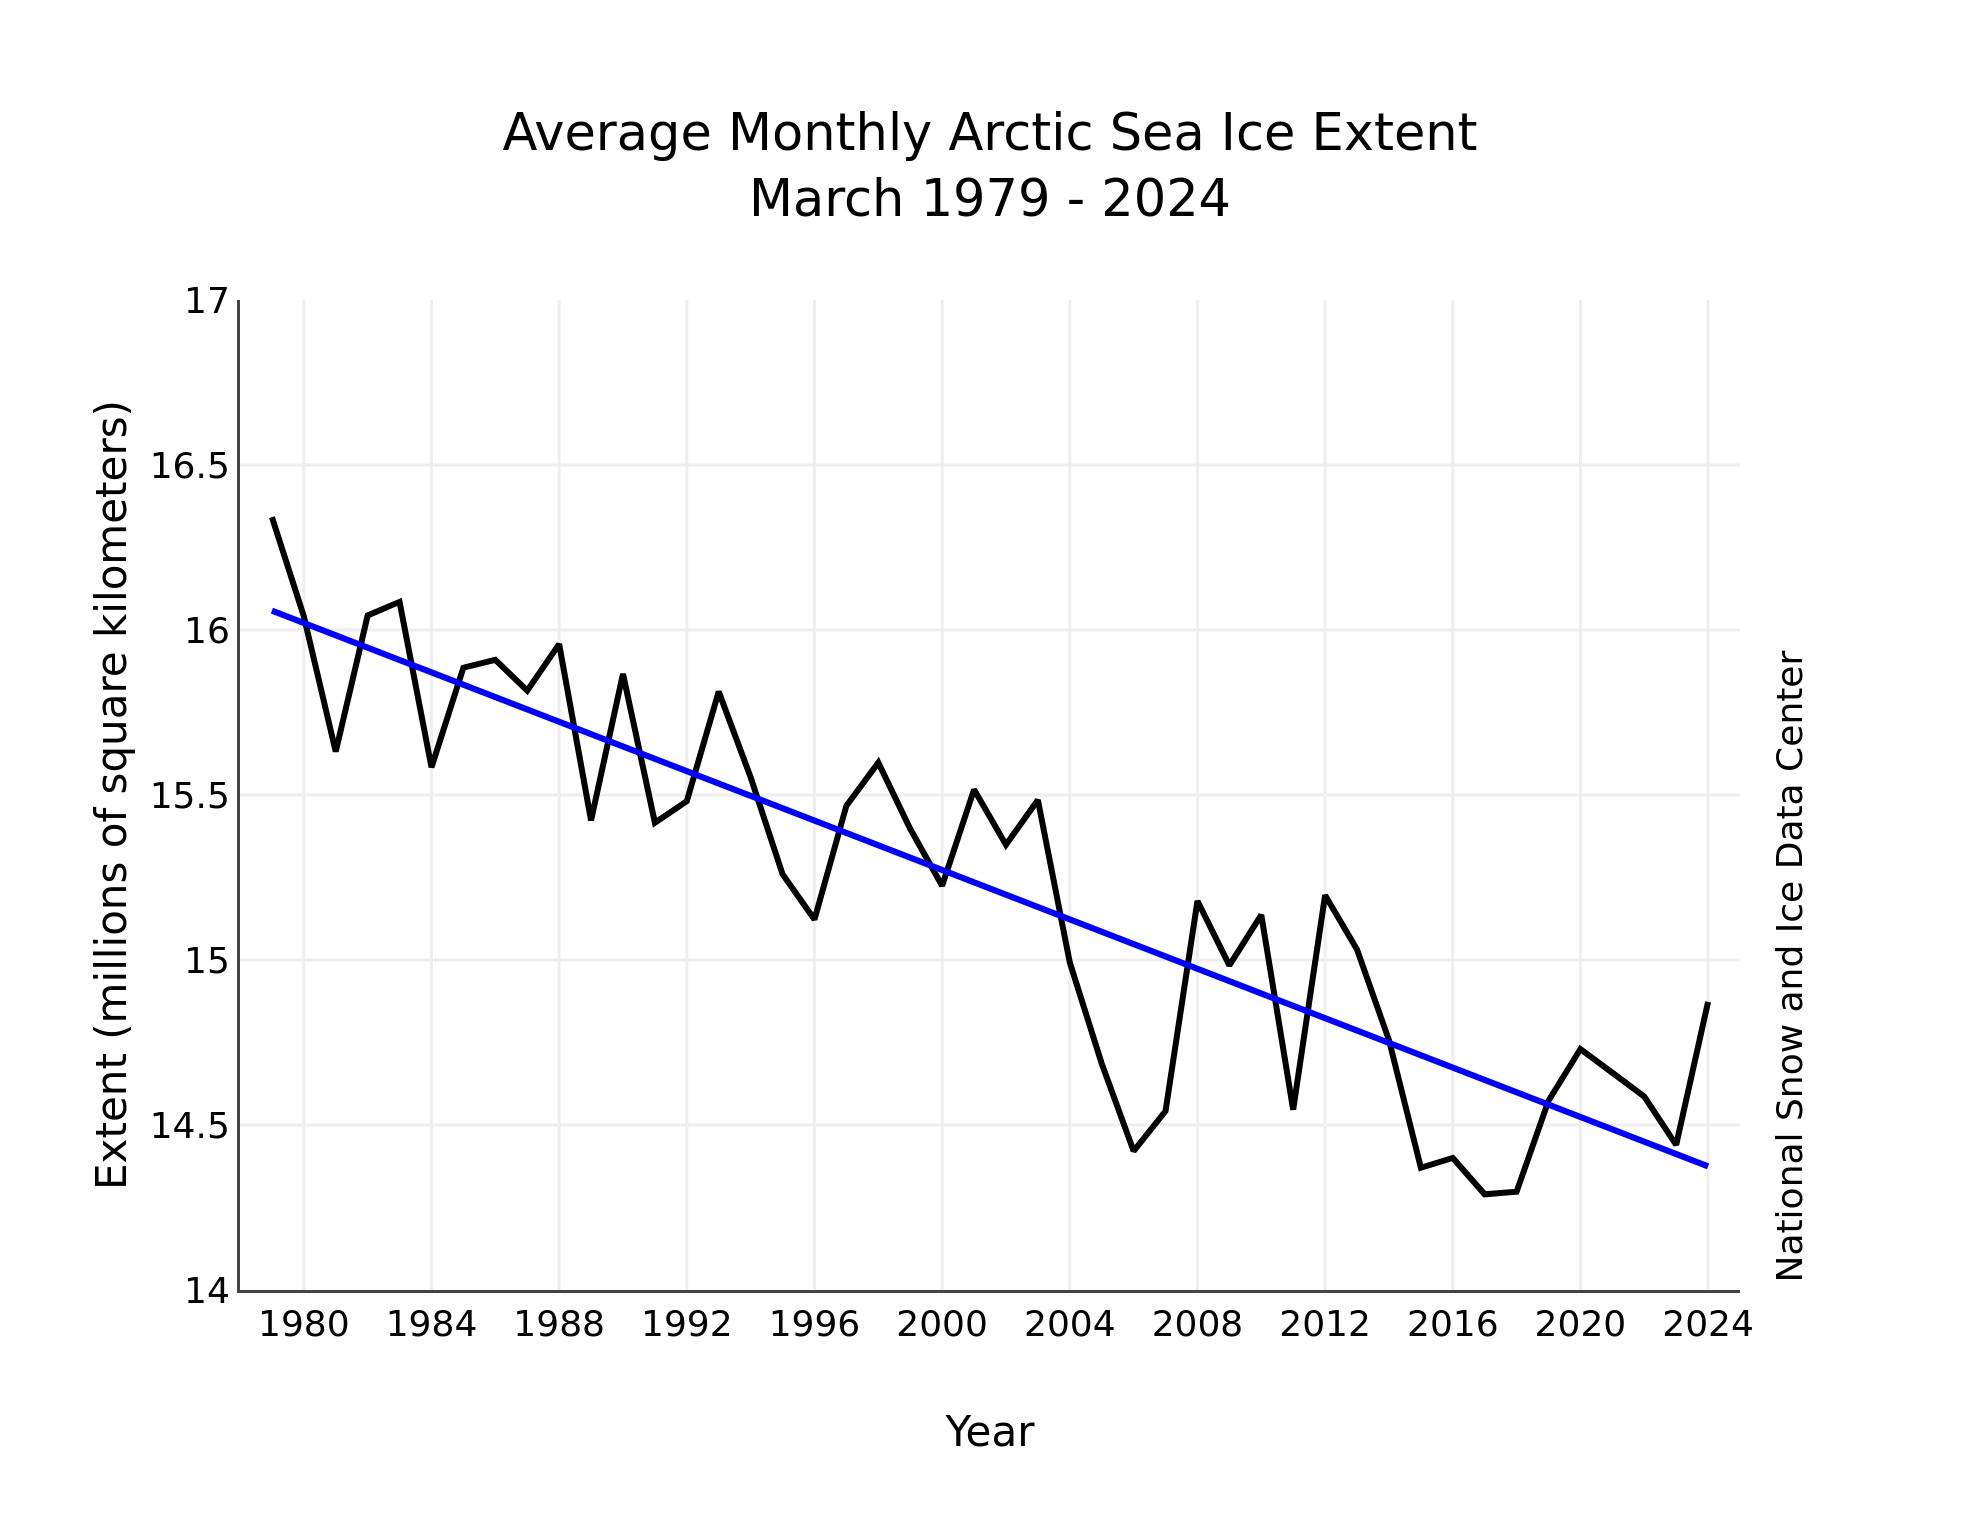
Figure 3. Monthly March ice extent for 1979 to 2024 shows a decline of 2.4 percent per decade.
Credit: National Snow and Ice Data Center
High-resolution image
Including 2024, the downward linear trend in March sea ice extent is 37,000 square kilometers (14,000 square miles) per year, or 2.4 percent per decade relative to the 1981 to 2010 average. Since 1979, Arctic sea ice loss in March is 1.68 million square kilometers (649,000 square miles), which is roughly equivalent to the size of the state of Alaska or the country of Iran.
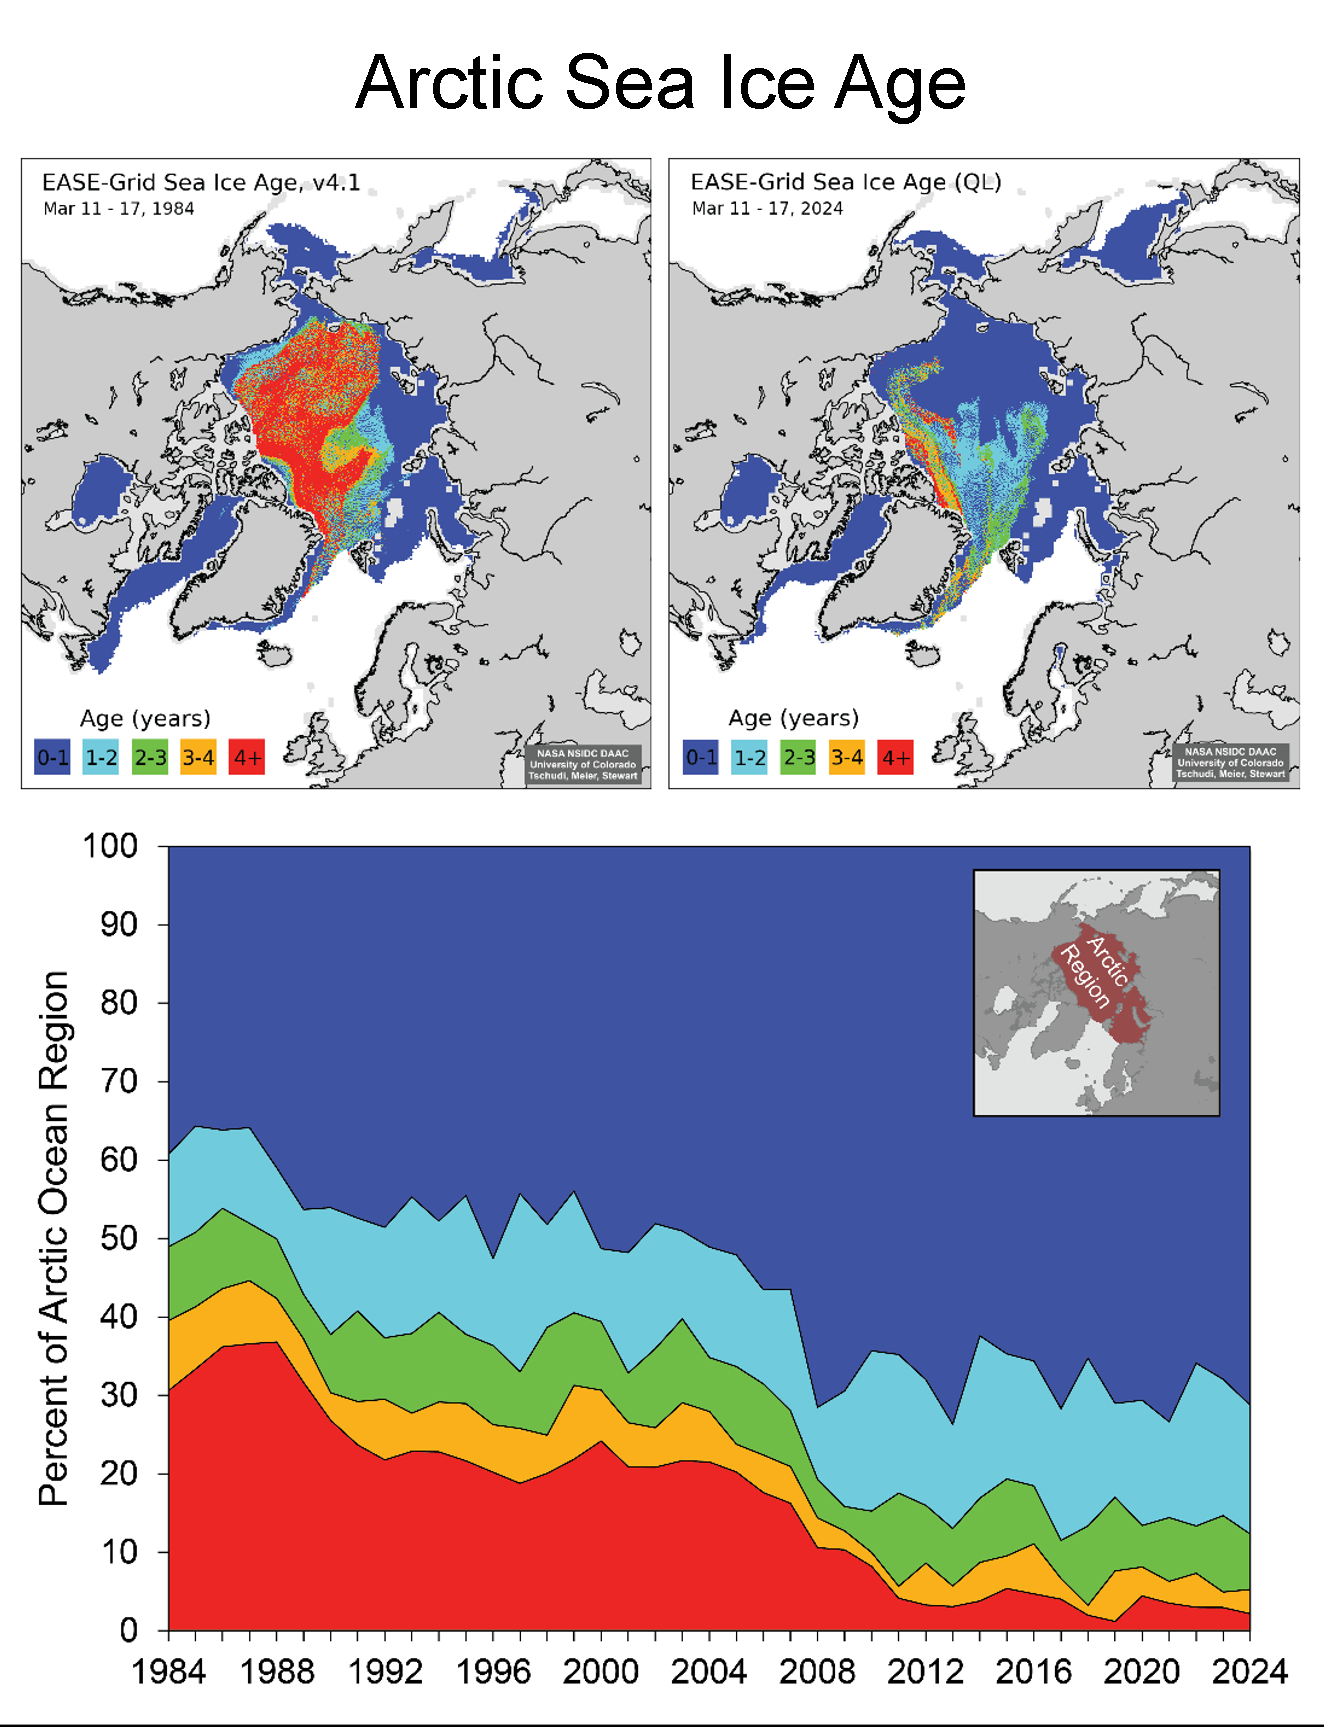
Update on sea ice age
With the passage of the seasonal maximum sea ice extent, it is appropriate to provide an updated assessment of sea ice age. Older, multiyear ice (ice that has survived at least one melt season) is generally thicker and more resistant to melting completely during the upcoming melt season than first-year ice, which represents ice growth of the previous autumn and winter. As seen in the figure, first-year ice dominates, as it has for the past several years. The extent of multiyear ice is lower than last year, mostly because of less second-year ice (one- to two-year-old ice that has survived two melt seasons), but it is within the ranges that have been seen since 2008. The oldest ice (greater than four-years old) has been at very low levels since 2012 and is slightly lower than last year.
Projections of an ice-free Arctic Ocean
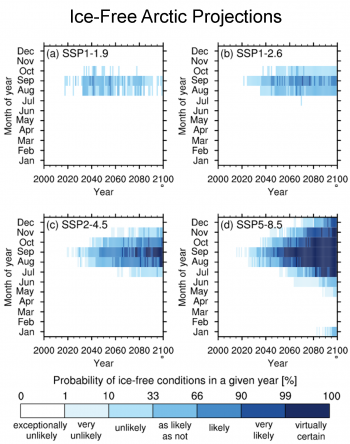
Figure 5. These charts show different probabilities of ice-free conditions in a given year and month for selected climate models and emission scenarios. The earliest ice-free conditions can be inferred when any probability of ice-free conditions exists, whereas consistently ice-free conditions start to exist when the probability in a given year reaches the likely category. Probabilities are provided for different greenhouse gas emission scenarios with SSP5-8.5 representing the most aggressive emission scenario and SSP1-2.6 the most modest. There are large differences in how likely an ice-free Arctic is to occur in the months of a given year depending on the degree of emissions and climate warming.
Credit: Jahn et al. 2024
High-resolution image
Colleagues Alexandra Jahn and Jen Kay, from the University of Colorado Boulder, and Marika Holland from the National Center for Atmospheric Research recently synthesized our current understanding of the timing and regional variability of an ice-free Arctic. In reviewing the literature, they find that a variety of different definitions of “ice-free” conditions have been used in the past, with impacts on their projected timing. For example, ice-free conditions based on sea ice area occur usually 10 years prior to ice-free conditions based on sea ice extent. Furthermore, they identify a need to clearly distinguish between projections of the first occurrence of ice-free conditions, based on the monthly average data, and consistently ice-free conditions, based on smoothed monthly averages, which occur about 10 years later than the first ice-free conditions. Using sea ice area, the earliest ice-free conditions in the September monthly average are likely to occur by 2050, but could occur as early as the late 2020s and 2030s under all greenhouse gas emission trajectories. Ice-free conditions for at least a day in September are expected approximately four years earlier on average, with the possibility of preceding the monthly average metric by over 10 years. Consistently ice-free September conditions are anticipated by mid-century (2035 to 2067) under all emission trajectories. However, future emission trajectories will determine how often and for how long the Arctic Ocean could be ice free in the future, with a possibility of ice-free conditions for nine months of the year by 2100 in some years under the high emission scenario. Future research is needed on the impact of different model selection and refinement methods on sea ice projections, as well as on the impacts of different lengths of ice-free conditions on the climate system and the ecosystem.
Antarctic note
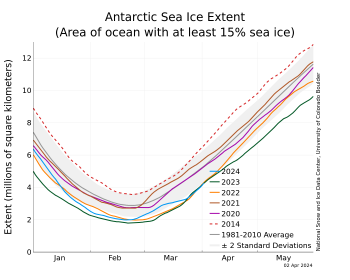
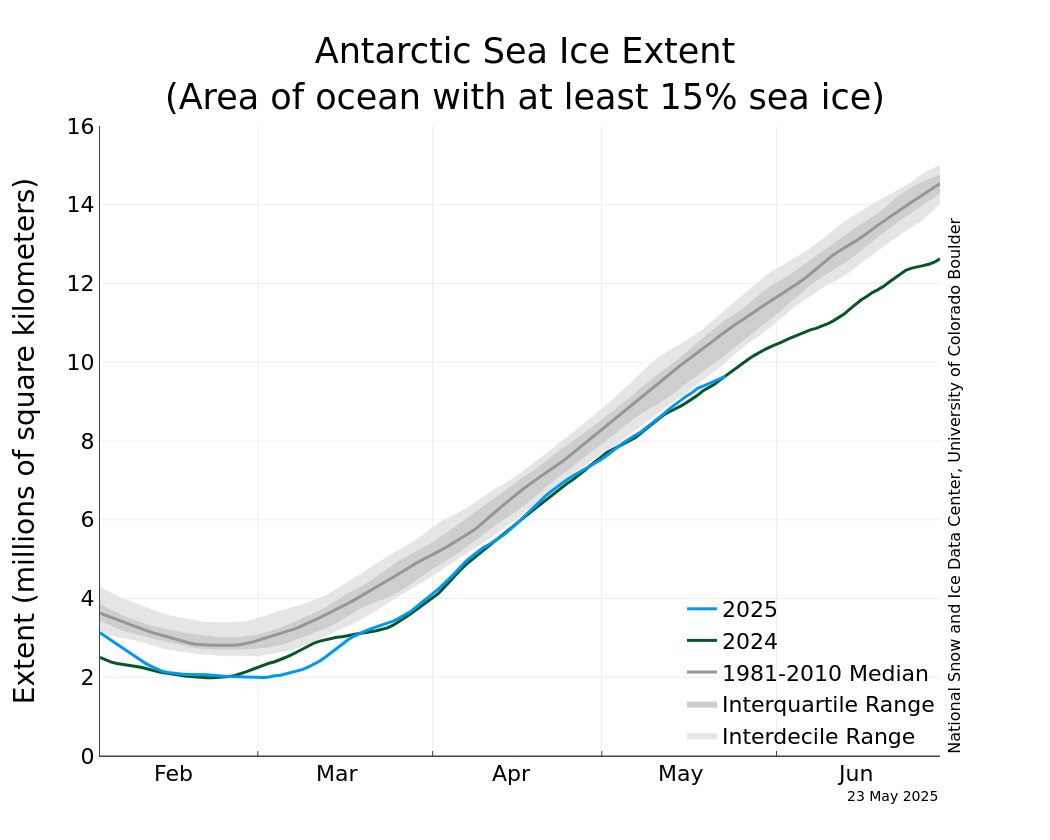
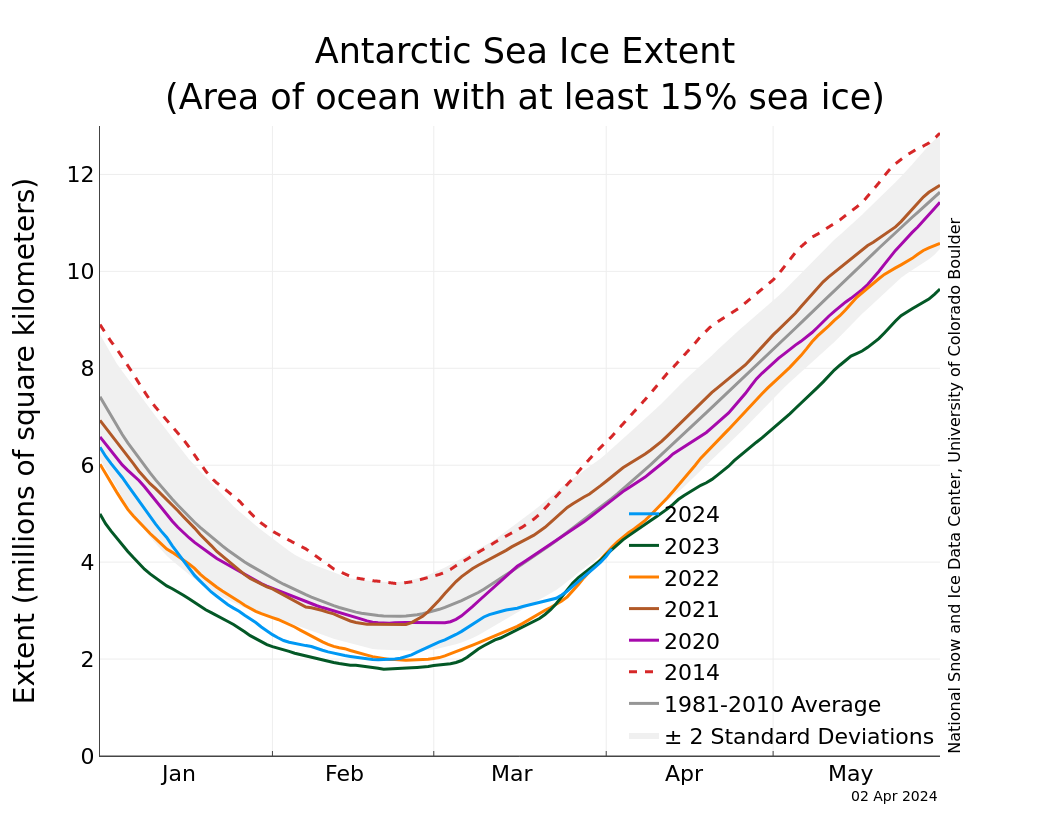
Figure 6. The graph above shows Antarctic sea ice extent as of April 2, 2024, along with daily ice extent data for four previous years and 2014, the record maximum year. 2024 is shown in blue, 2023 in green, 2022 in orange, 2021 in brown, 2020 in magenta, and 2014 in dashed brown. The 1981 to 2010 median is in dark gray. The gray areas around the median line show the interquartile and interdecile ranges of the data. Sea Ice Index data.
Credit: National Snow and Ice Data Center
High-resolution image
Antarctic sea ice extent expanded slowly in mid-March after reaching its summer minimum extent on February 21, lagging behind many of the years in the satellite record and ending the month tied with several other years for third lowest. Ice extent is particularly low in the eastern Ross Sea and western Amundsen Sea region, and in the eastern Bellingshausen Sea. Air temperatures have been near-average over much of the sea ice areas, but up to 3 degrees Celsius (5 degrees Fahrenheit) above average in the eastern Ross Sea and western Amundsen Sea region, and below average off the coast of Adelie Land by about the same amount.
Further reading
Jahn, A., M. M. Holland, and J. E. Kay. 2024. Projections of and ice-free Arctic Ocean. Nature Reviews Earth and Environment. doi:10.1038/s43017-023-00515-9.