May saw above average temperatures over nearly all of the Arctic Ocean, Baffin Bay, and Greenland. Early sea ice retreat in the Bering Sea extended into the southern Chukchi Sea. Northern Baffin Bay and the Nares Strait have low ice cover. By month’s end, open water extended along the northeastern Alaskan and northwestern Canadian coasts, all well ahead of schedule. However, this was partly balanced by slower-than-average ice loss in the Barents Sea. At the end of May, Arctic sea ice daily extent stood at second lowest in the 40-year satellite record.
Overview of conditions
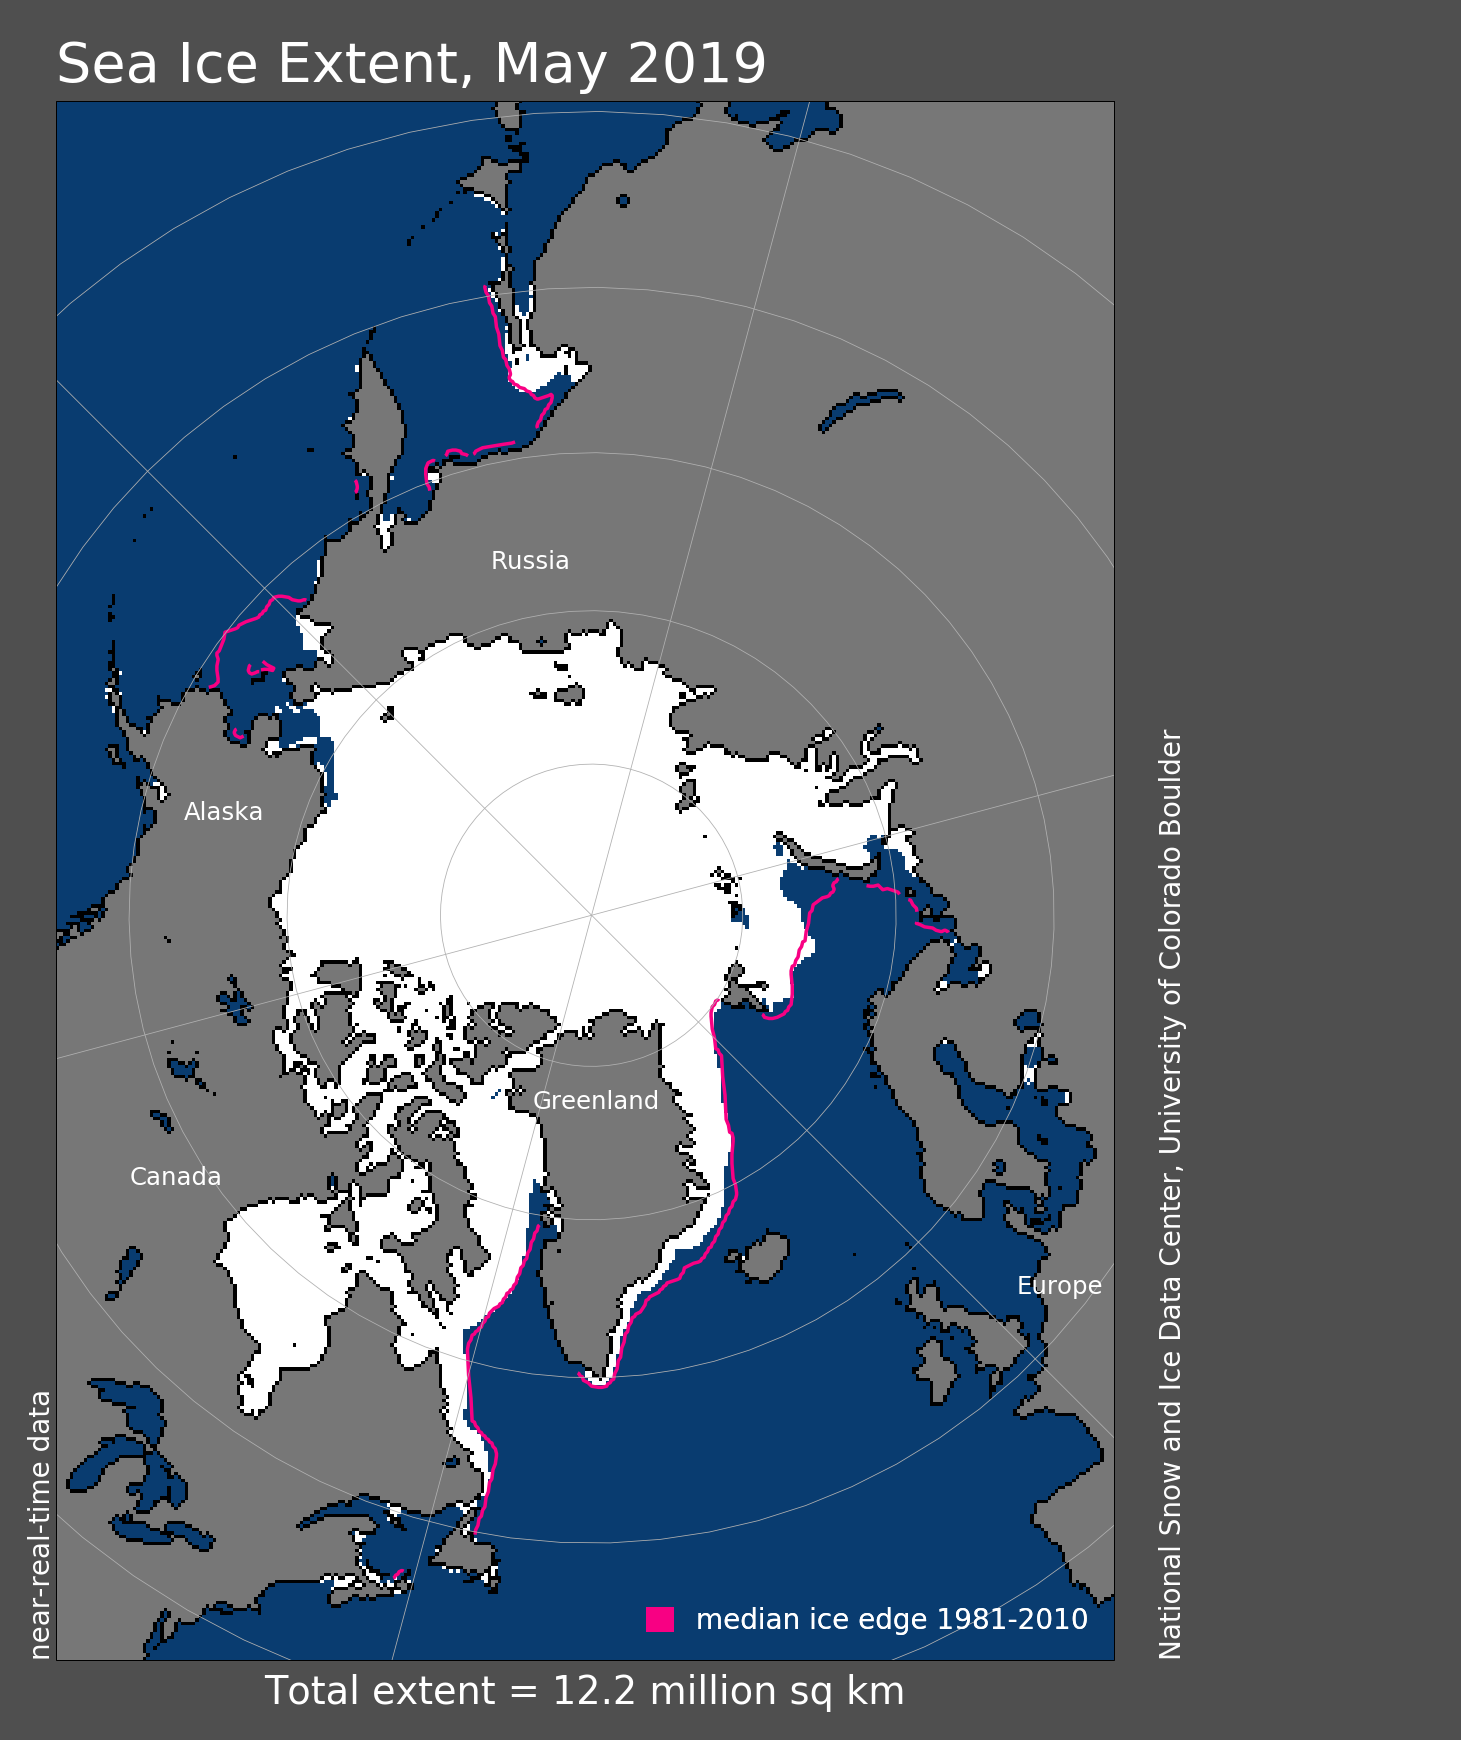
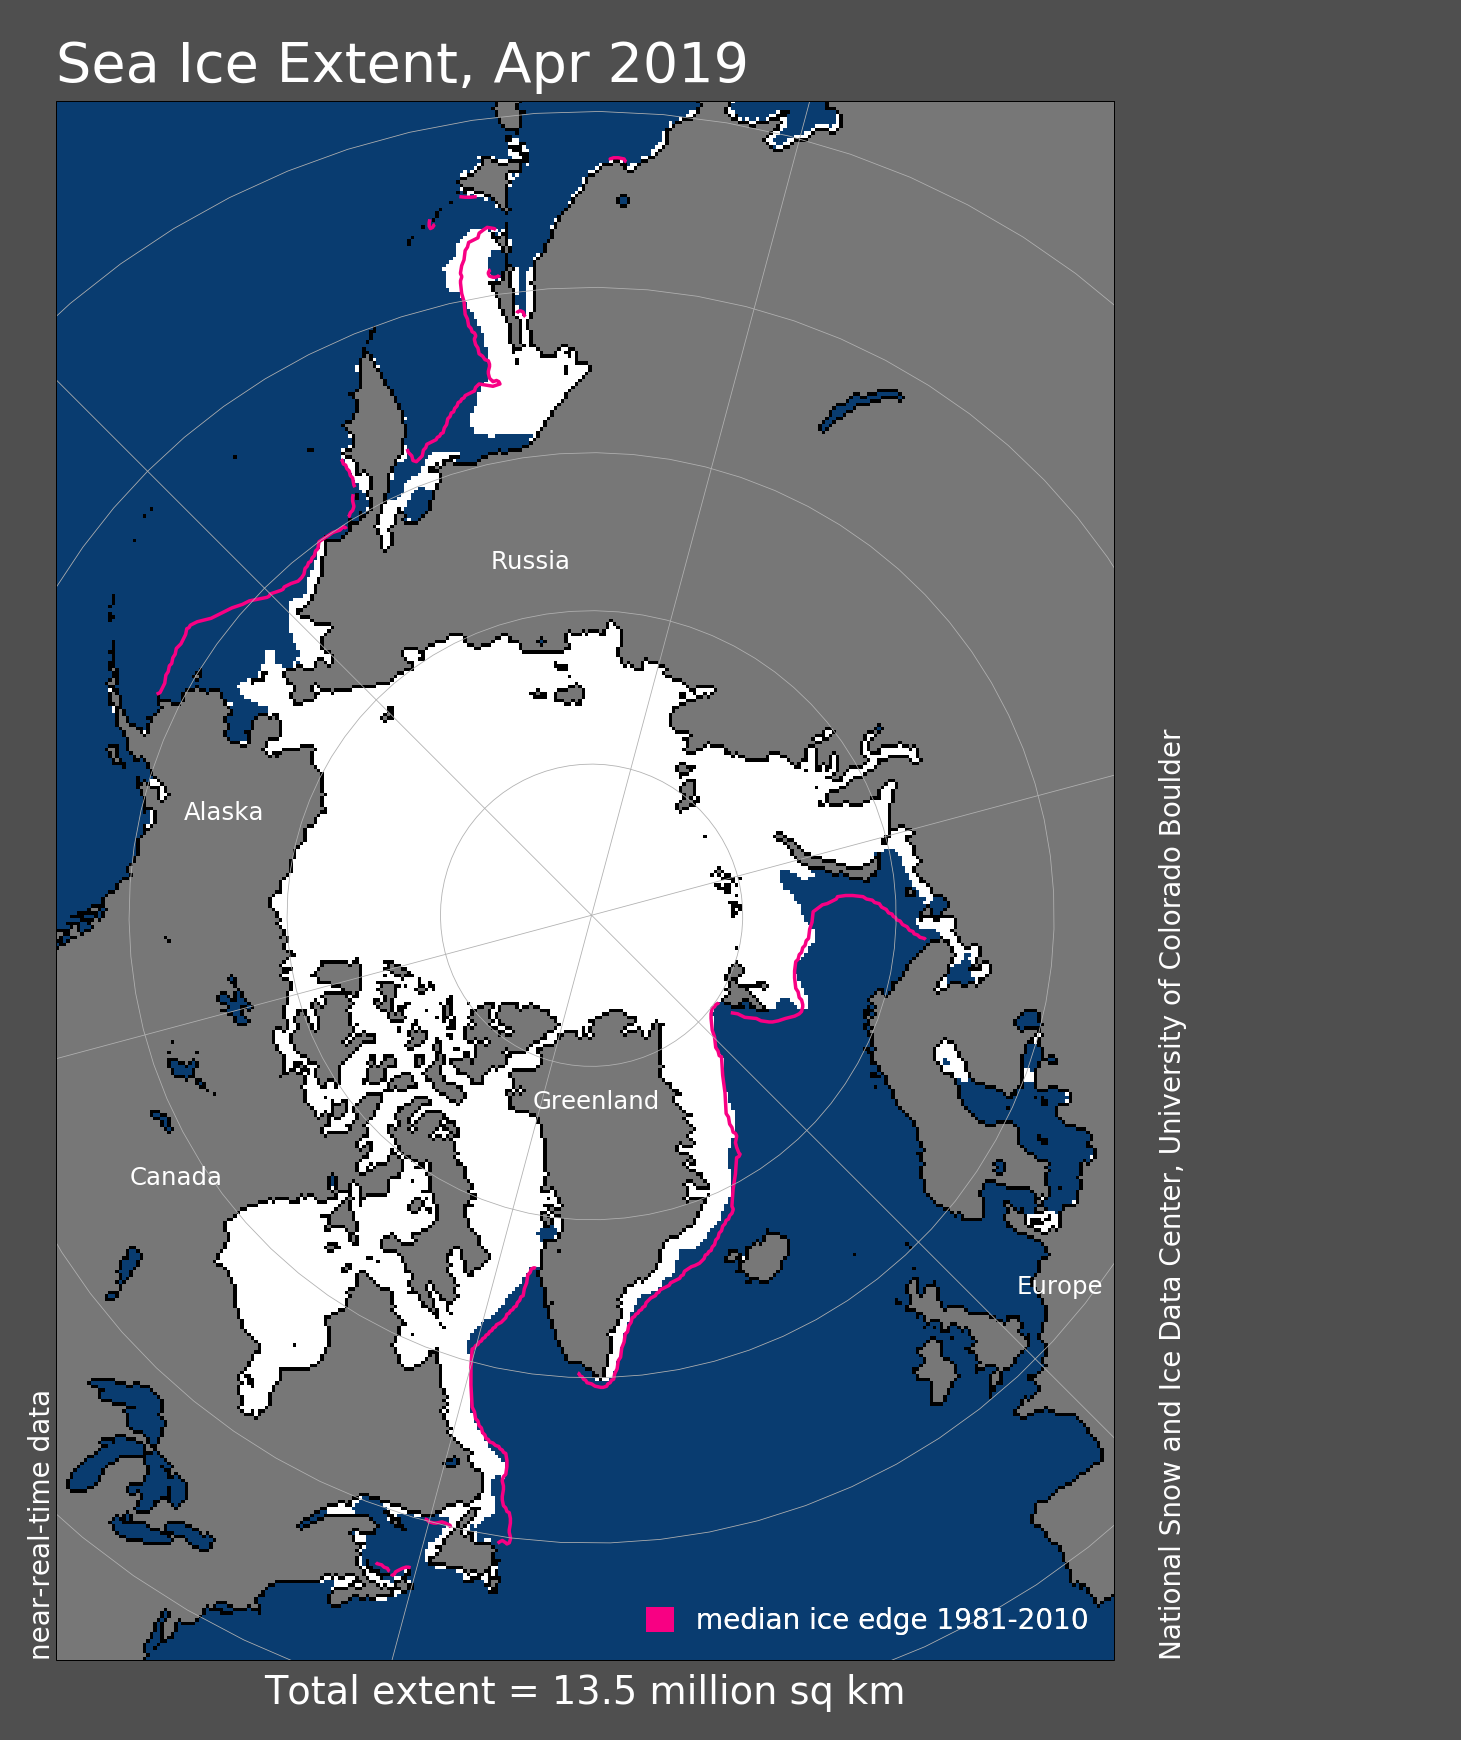
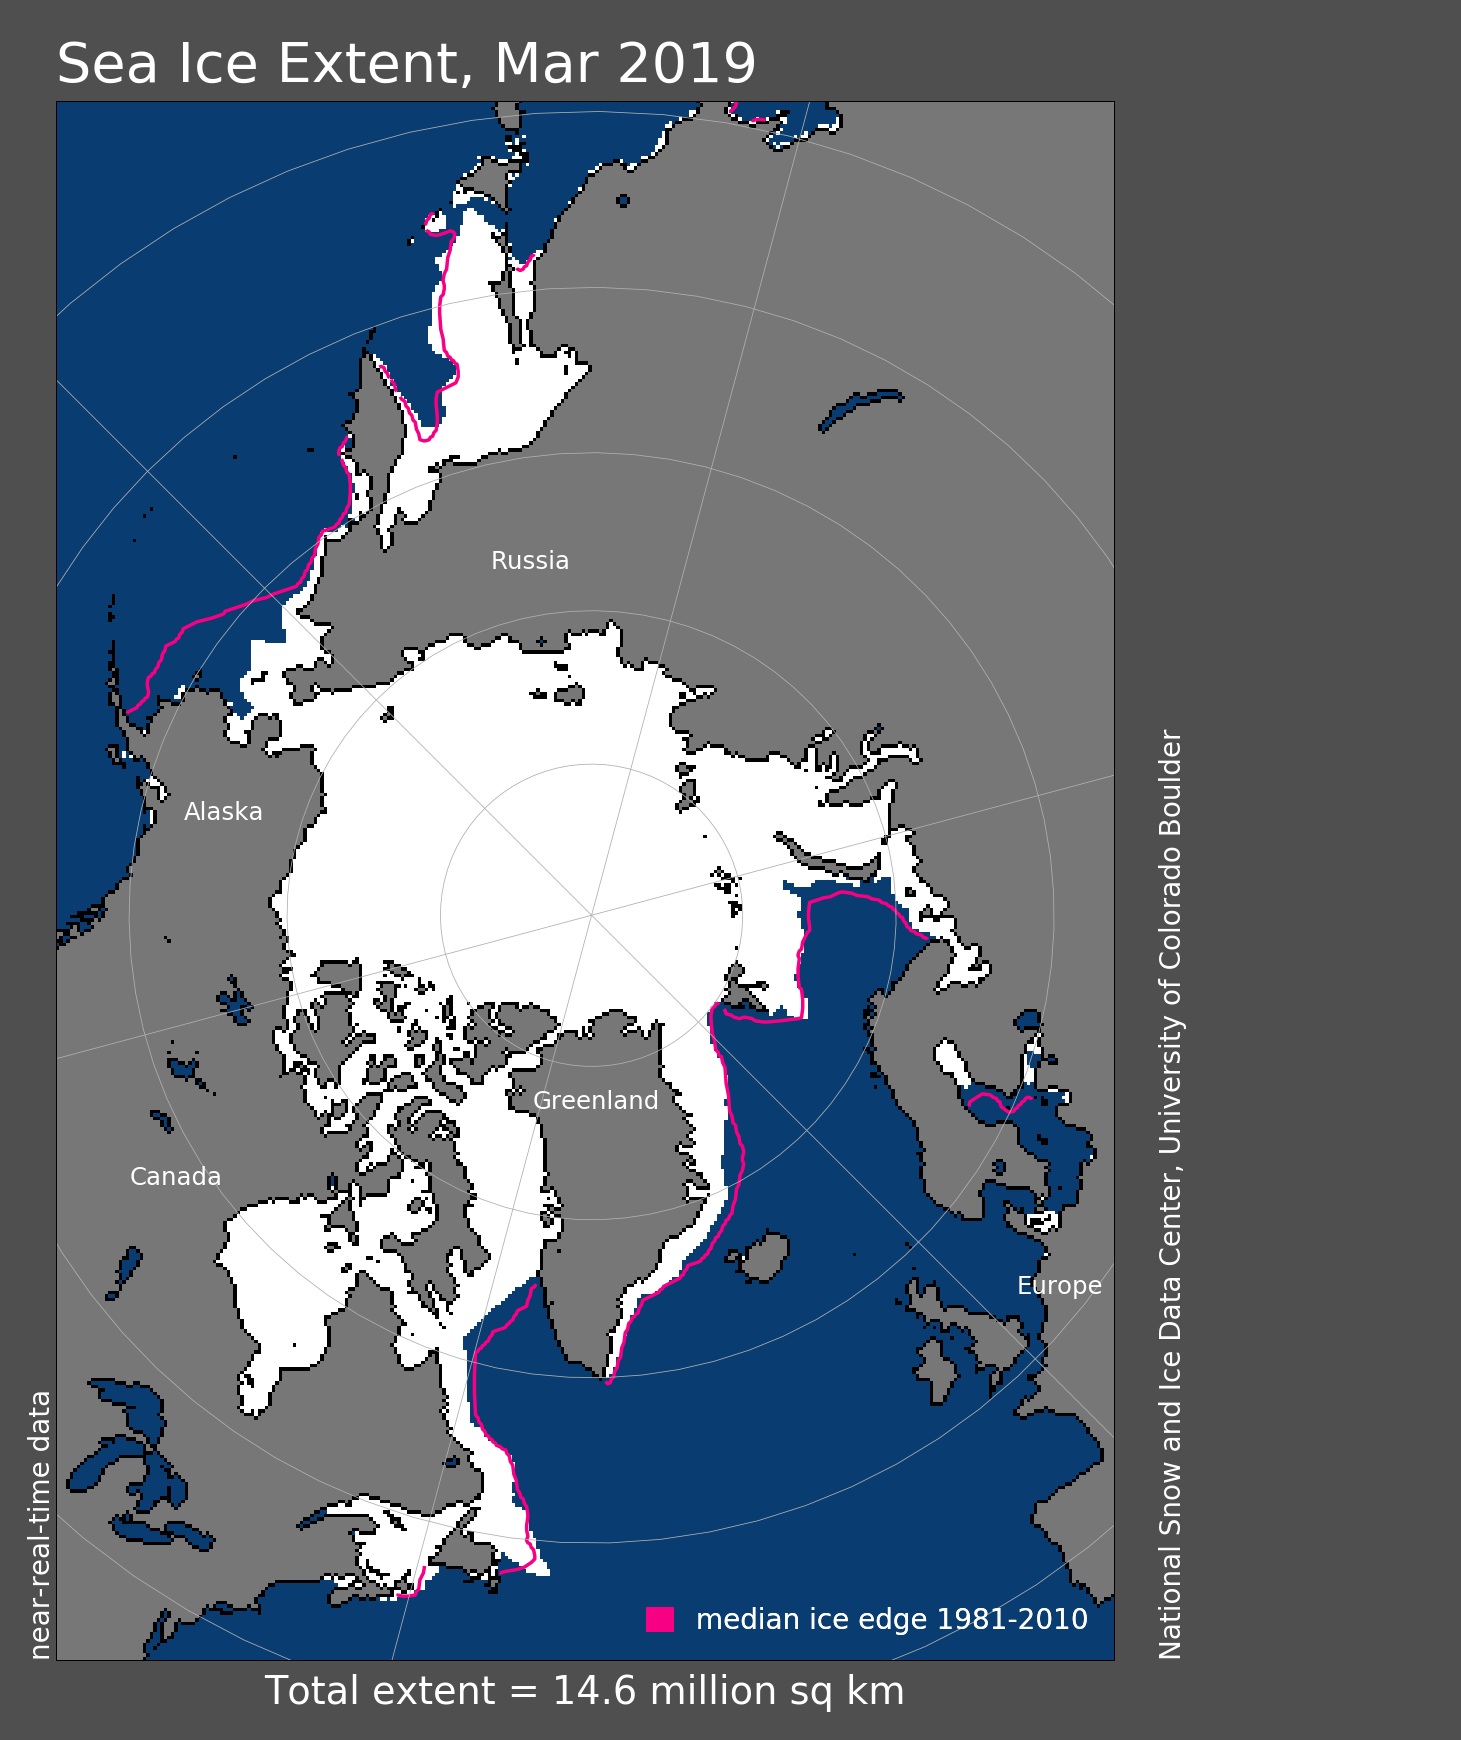
Figure 1. Arctic sea ice extent for May 2019 was 12.16 million square kilometers (4.70 million square miles). The magenta line shows the 1981 to 2010 average extent for that month. Sea Ice Index data. About the data
Credit: National Snow and Ice Data Center
High-resolution image
Arctic sea ice extent averaged for May was 12.16 million square kilometers (4.70 million square miles). This is 1.13 million square kilometers (436,000 square miles) below the 1981 to 2010 average and 240,000 square kilometers (93,000 square miles) above the previous record low for the month set in May 2016. The month saw rapid ice loss in the Bering Sea and southern Chukchi Sea. During the second half of the month, an extended coastal polynya opened along the northwestern coast of the Beaufort Sea extending into the Mackenzie River Delta area. Visible MODIS imagery shows many large ice floes interspersed with open water along the ice edge and fracturing of ice further within the pack.
Although ice loss in the Barents Sea was rapid in early May, it subsequently slowed and extent slightly increased late in the month. There was nevertheless an overall ice retreat for May as a whole. Around mid-month, a polynya began to open at the north end of Baffin Bay, near the Nares Strait. At about this time, an ice arch that restrains southward ice drift in the Lincoln Sea began to fail, allowing transport of ice through the strait and creating a small polynya northwest of Greenland (discussed below). By the end of May, other polynyas started to form around the New Siberian Islands as well as Severnaya Zemlya, and open water began to develop along coastal regions in the Kara Sea and in northern Hudson Bay.
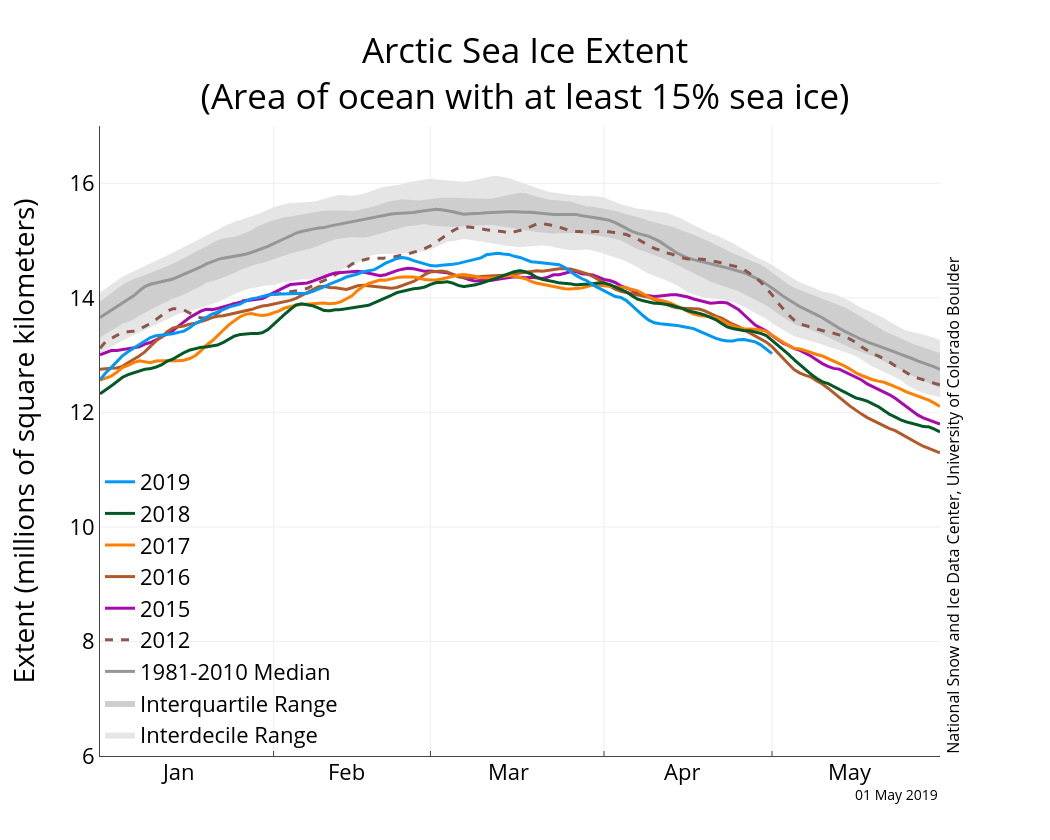
Conditions in context
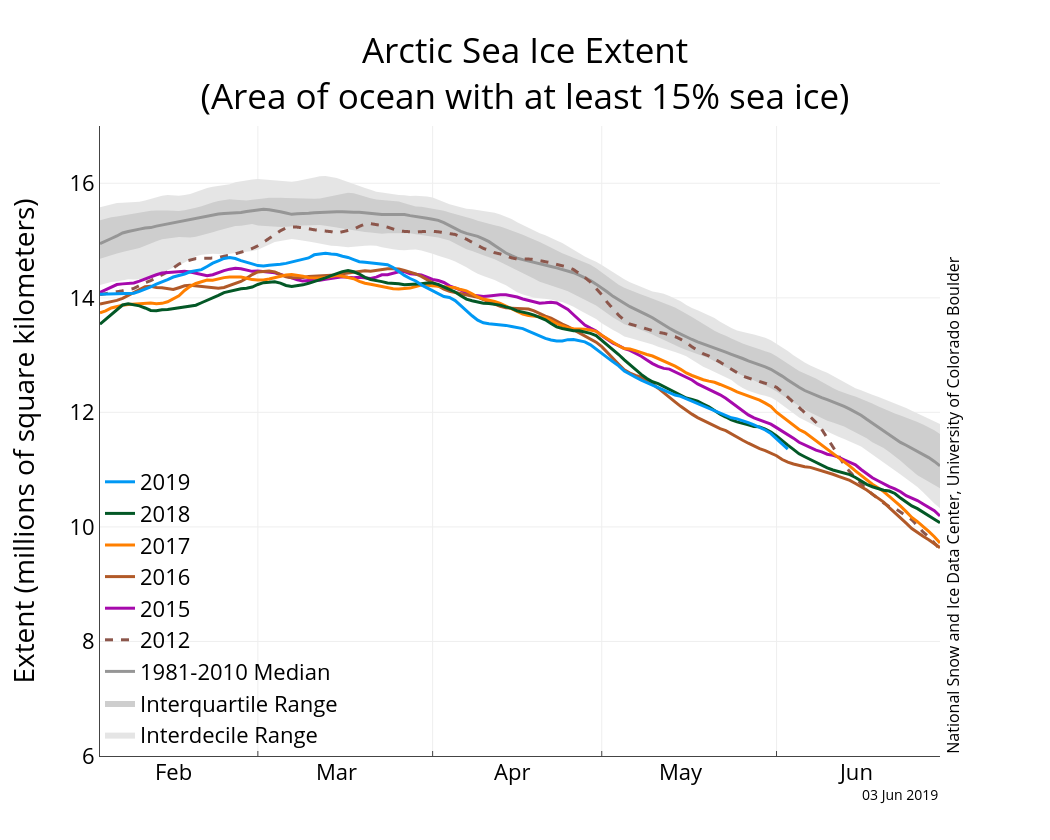
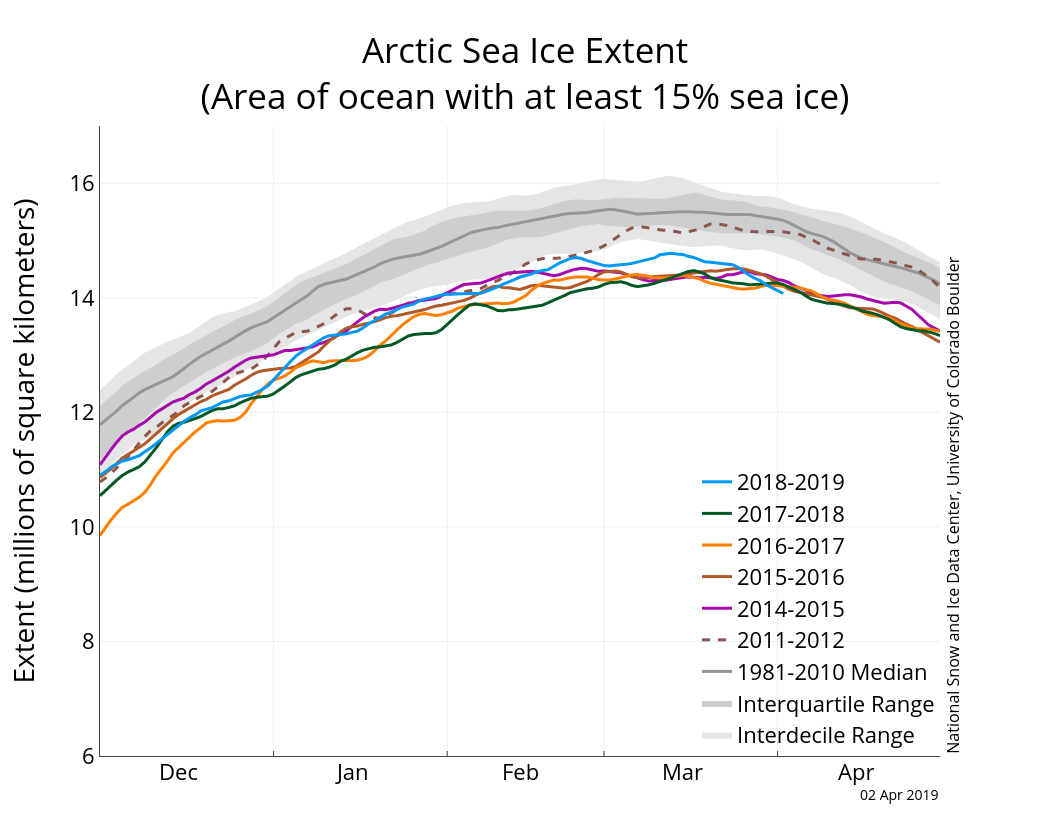
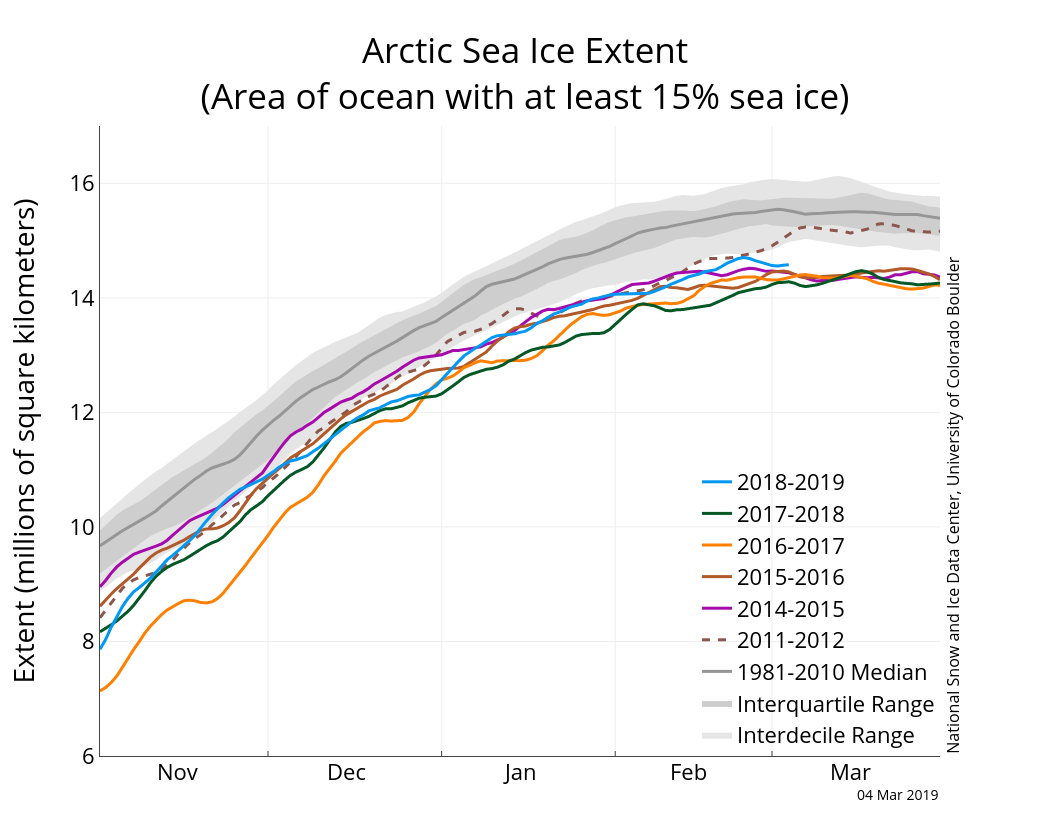
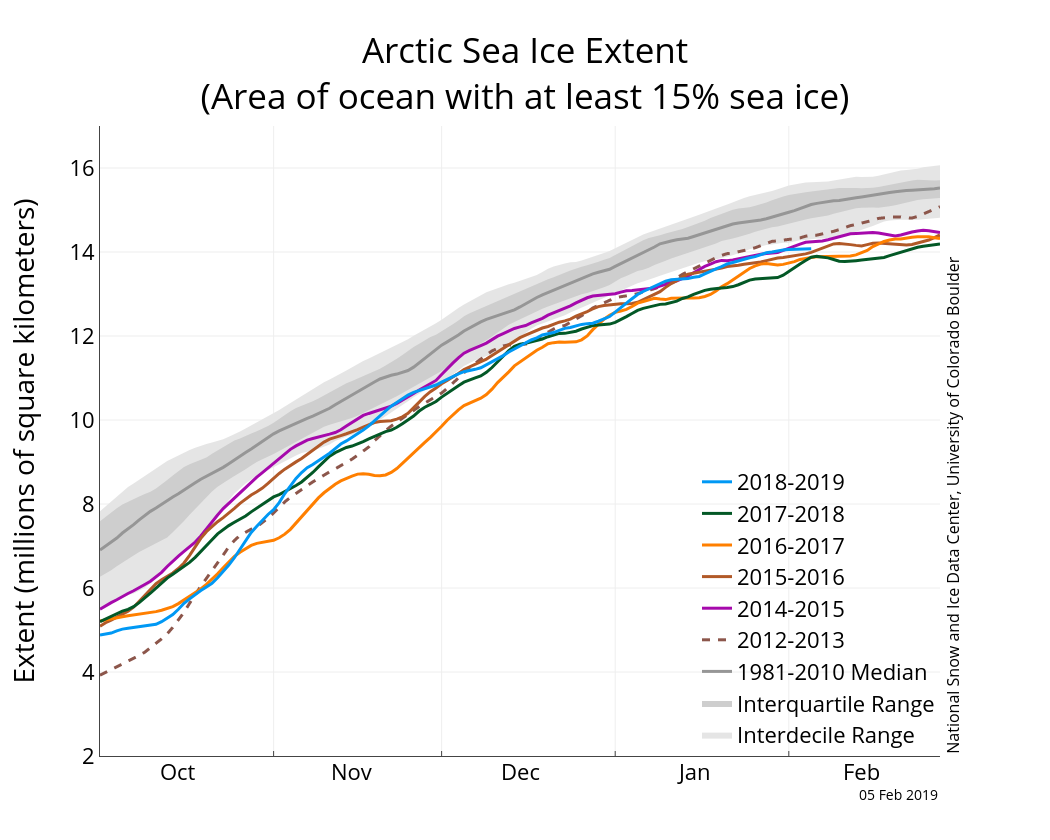
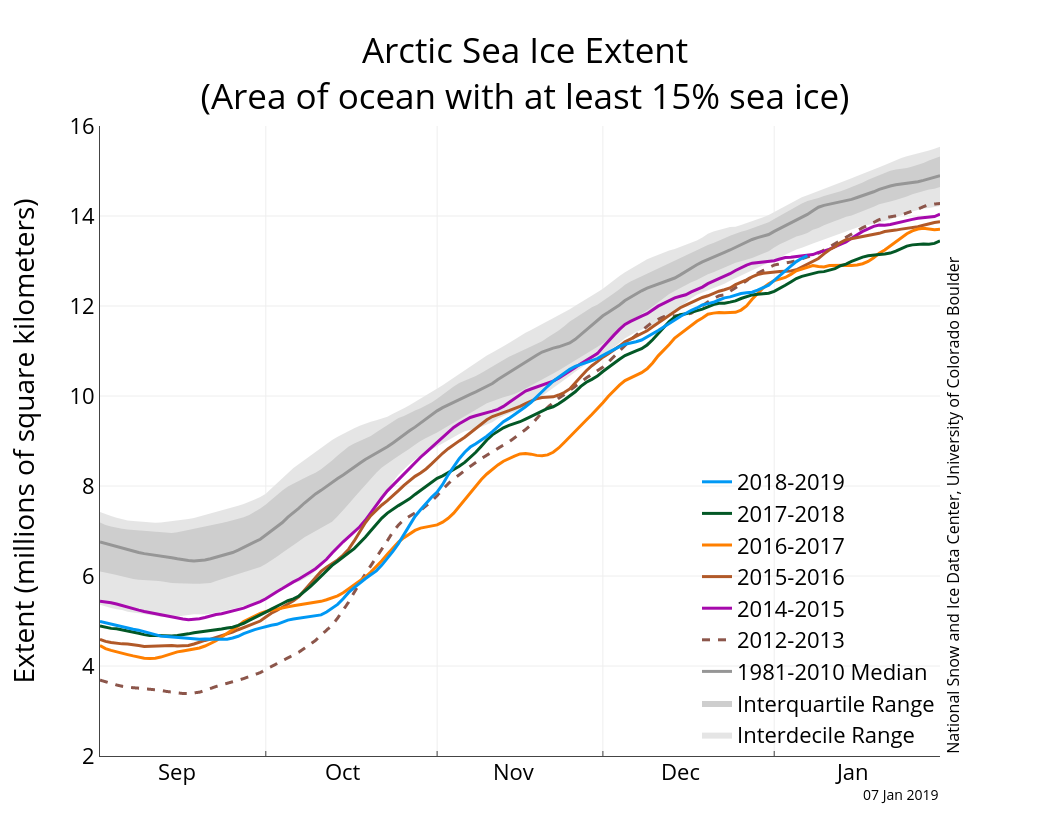
Figure 2a. The graph above shows Arctic sea ice extent as of June 3, 2019, along with daily ice extent data for four previous years and the record low year. 2019 is shown in blue, 2018 in green, 2017 in orange, 2016 in brown, 2015 in purple, and 2012 in dotted brown. The 1981 to 2010 median is in dark gray. The gray areas around the median line show the interquartile and interdecile ranges of the data. Sea Ice Index data.
Credit: National Snow and Ice Data Center
High-resolution image
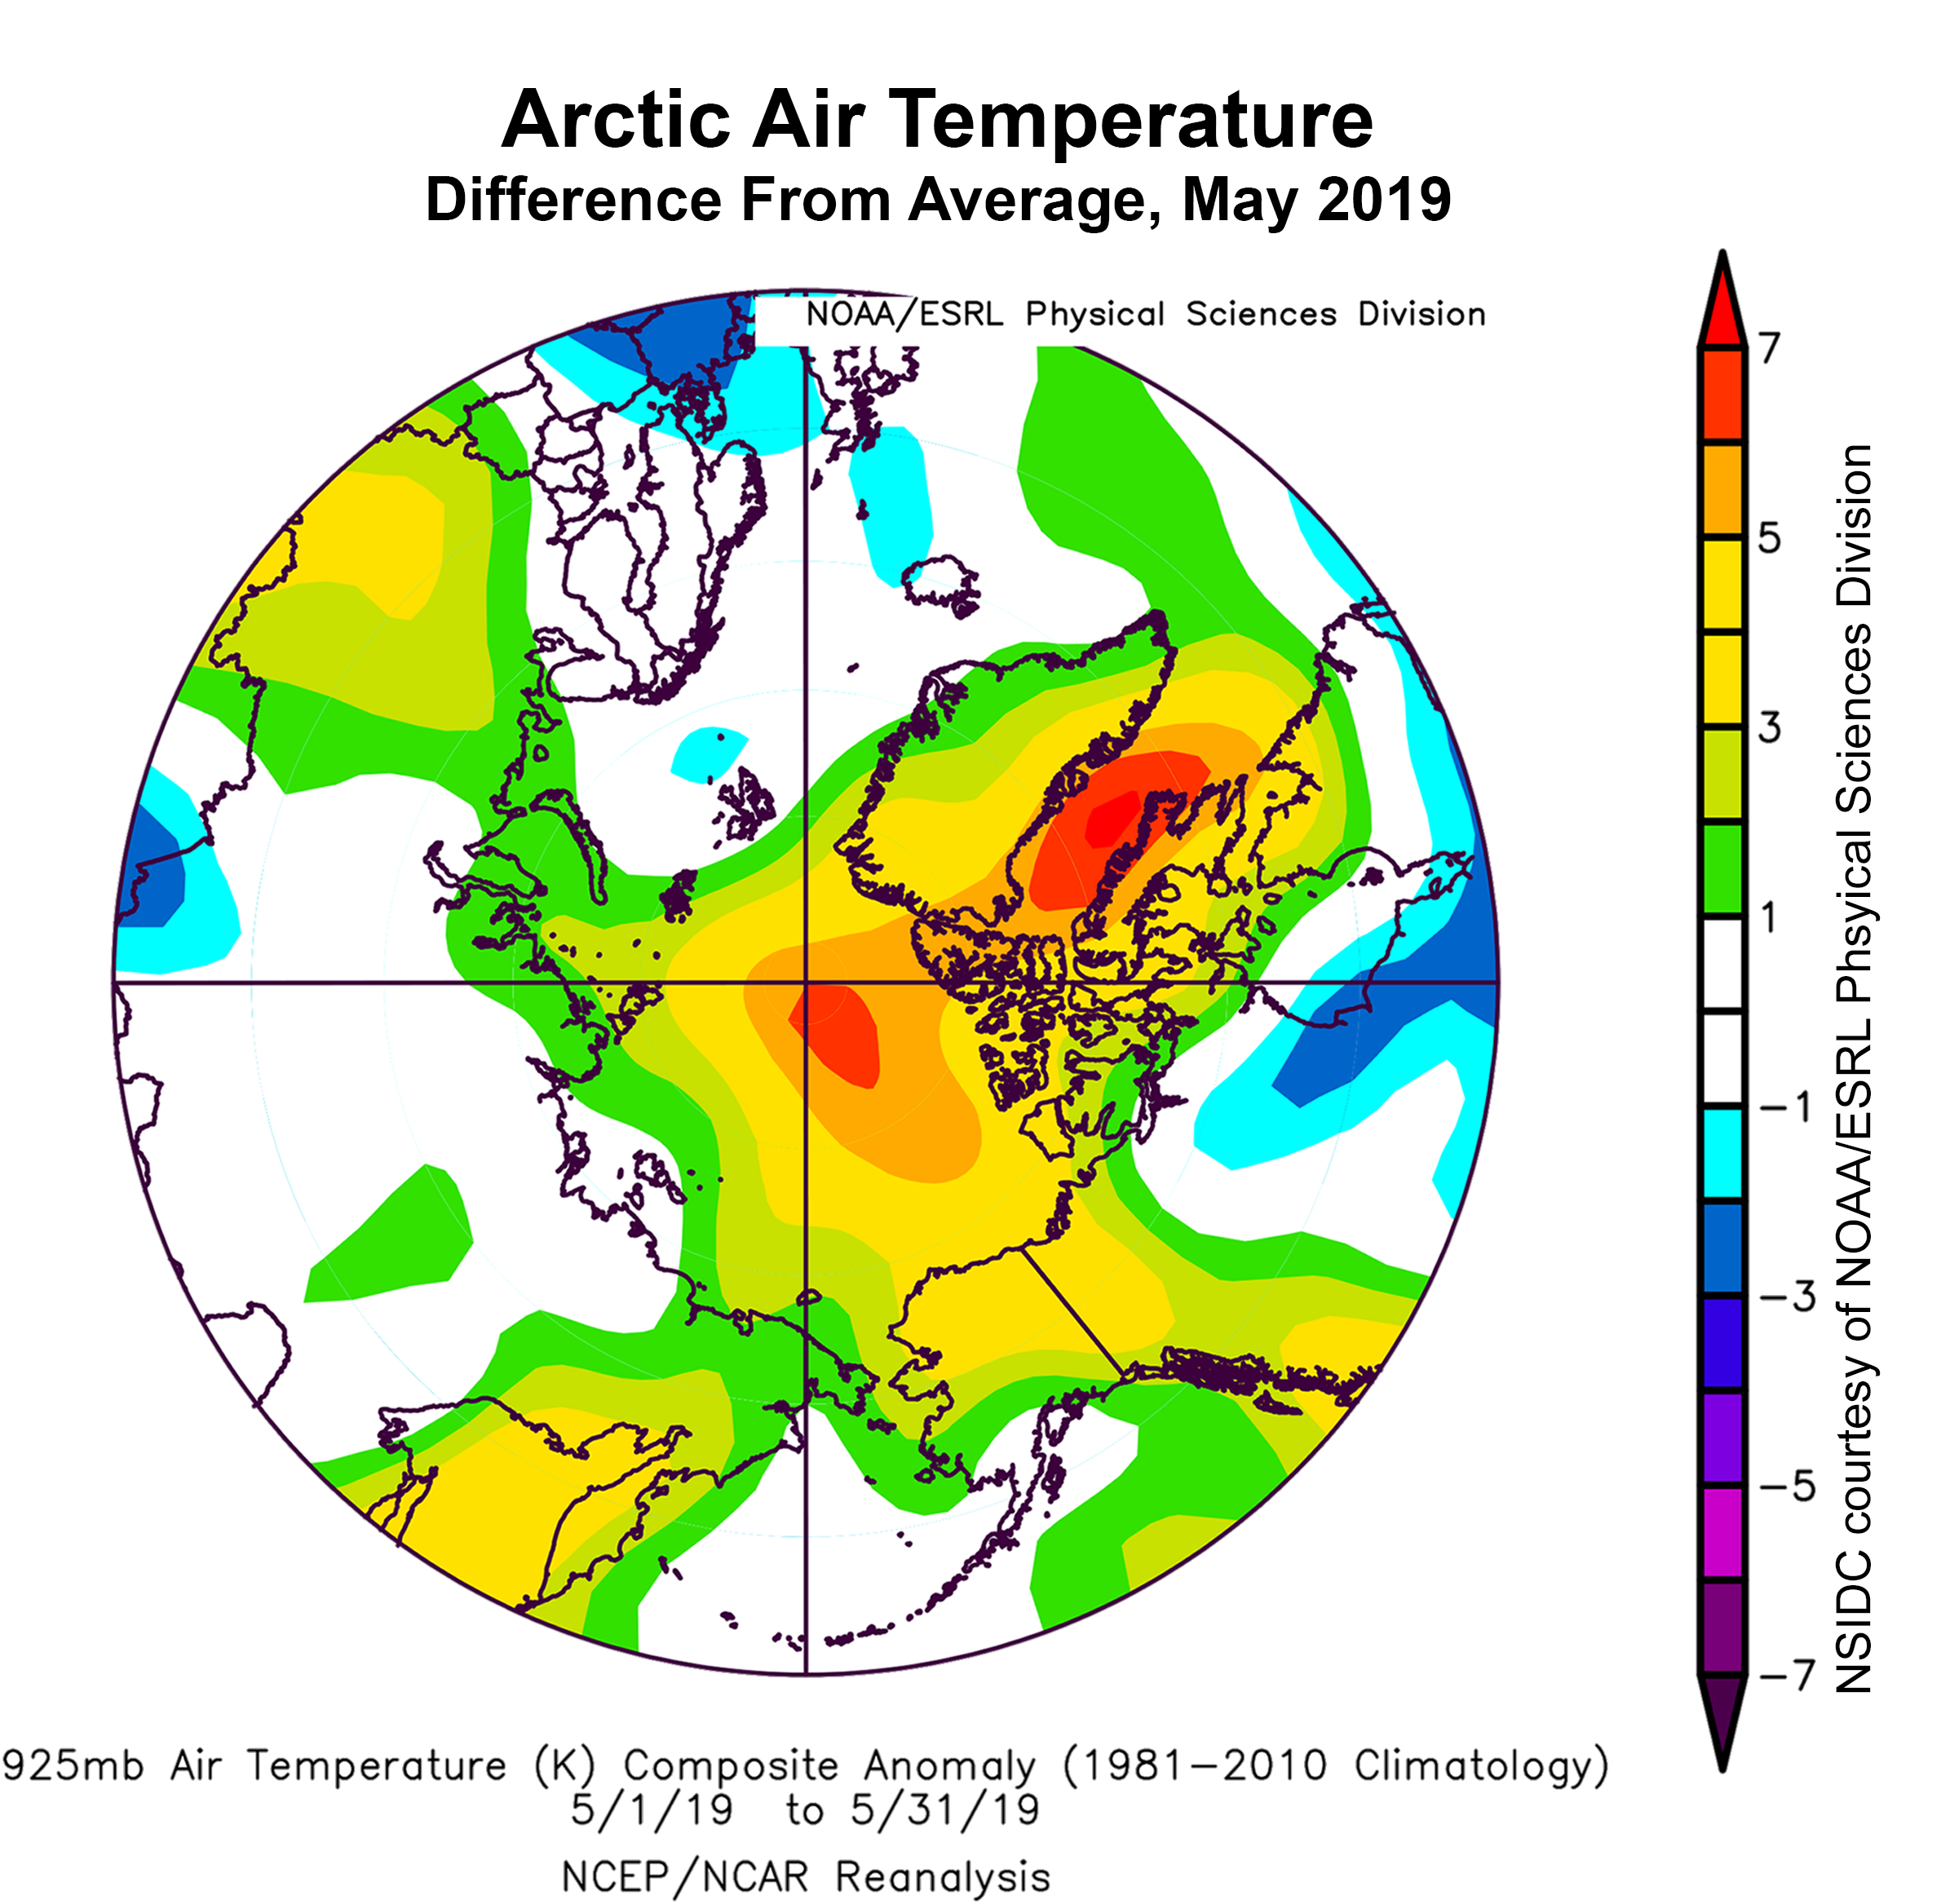
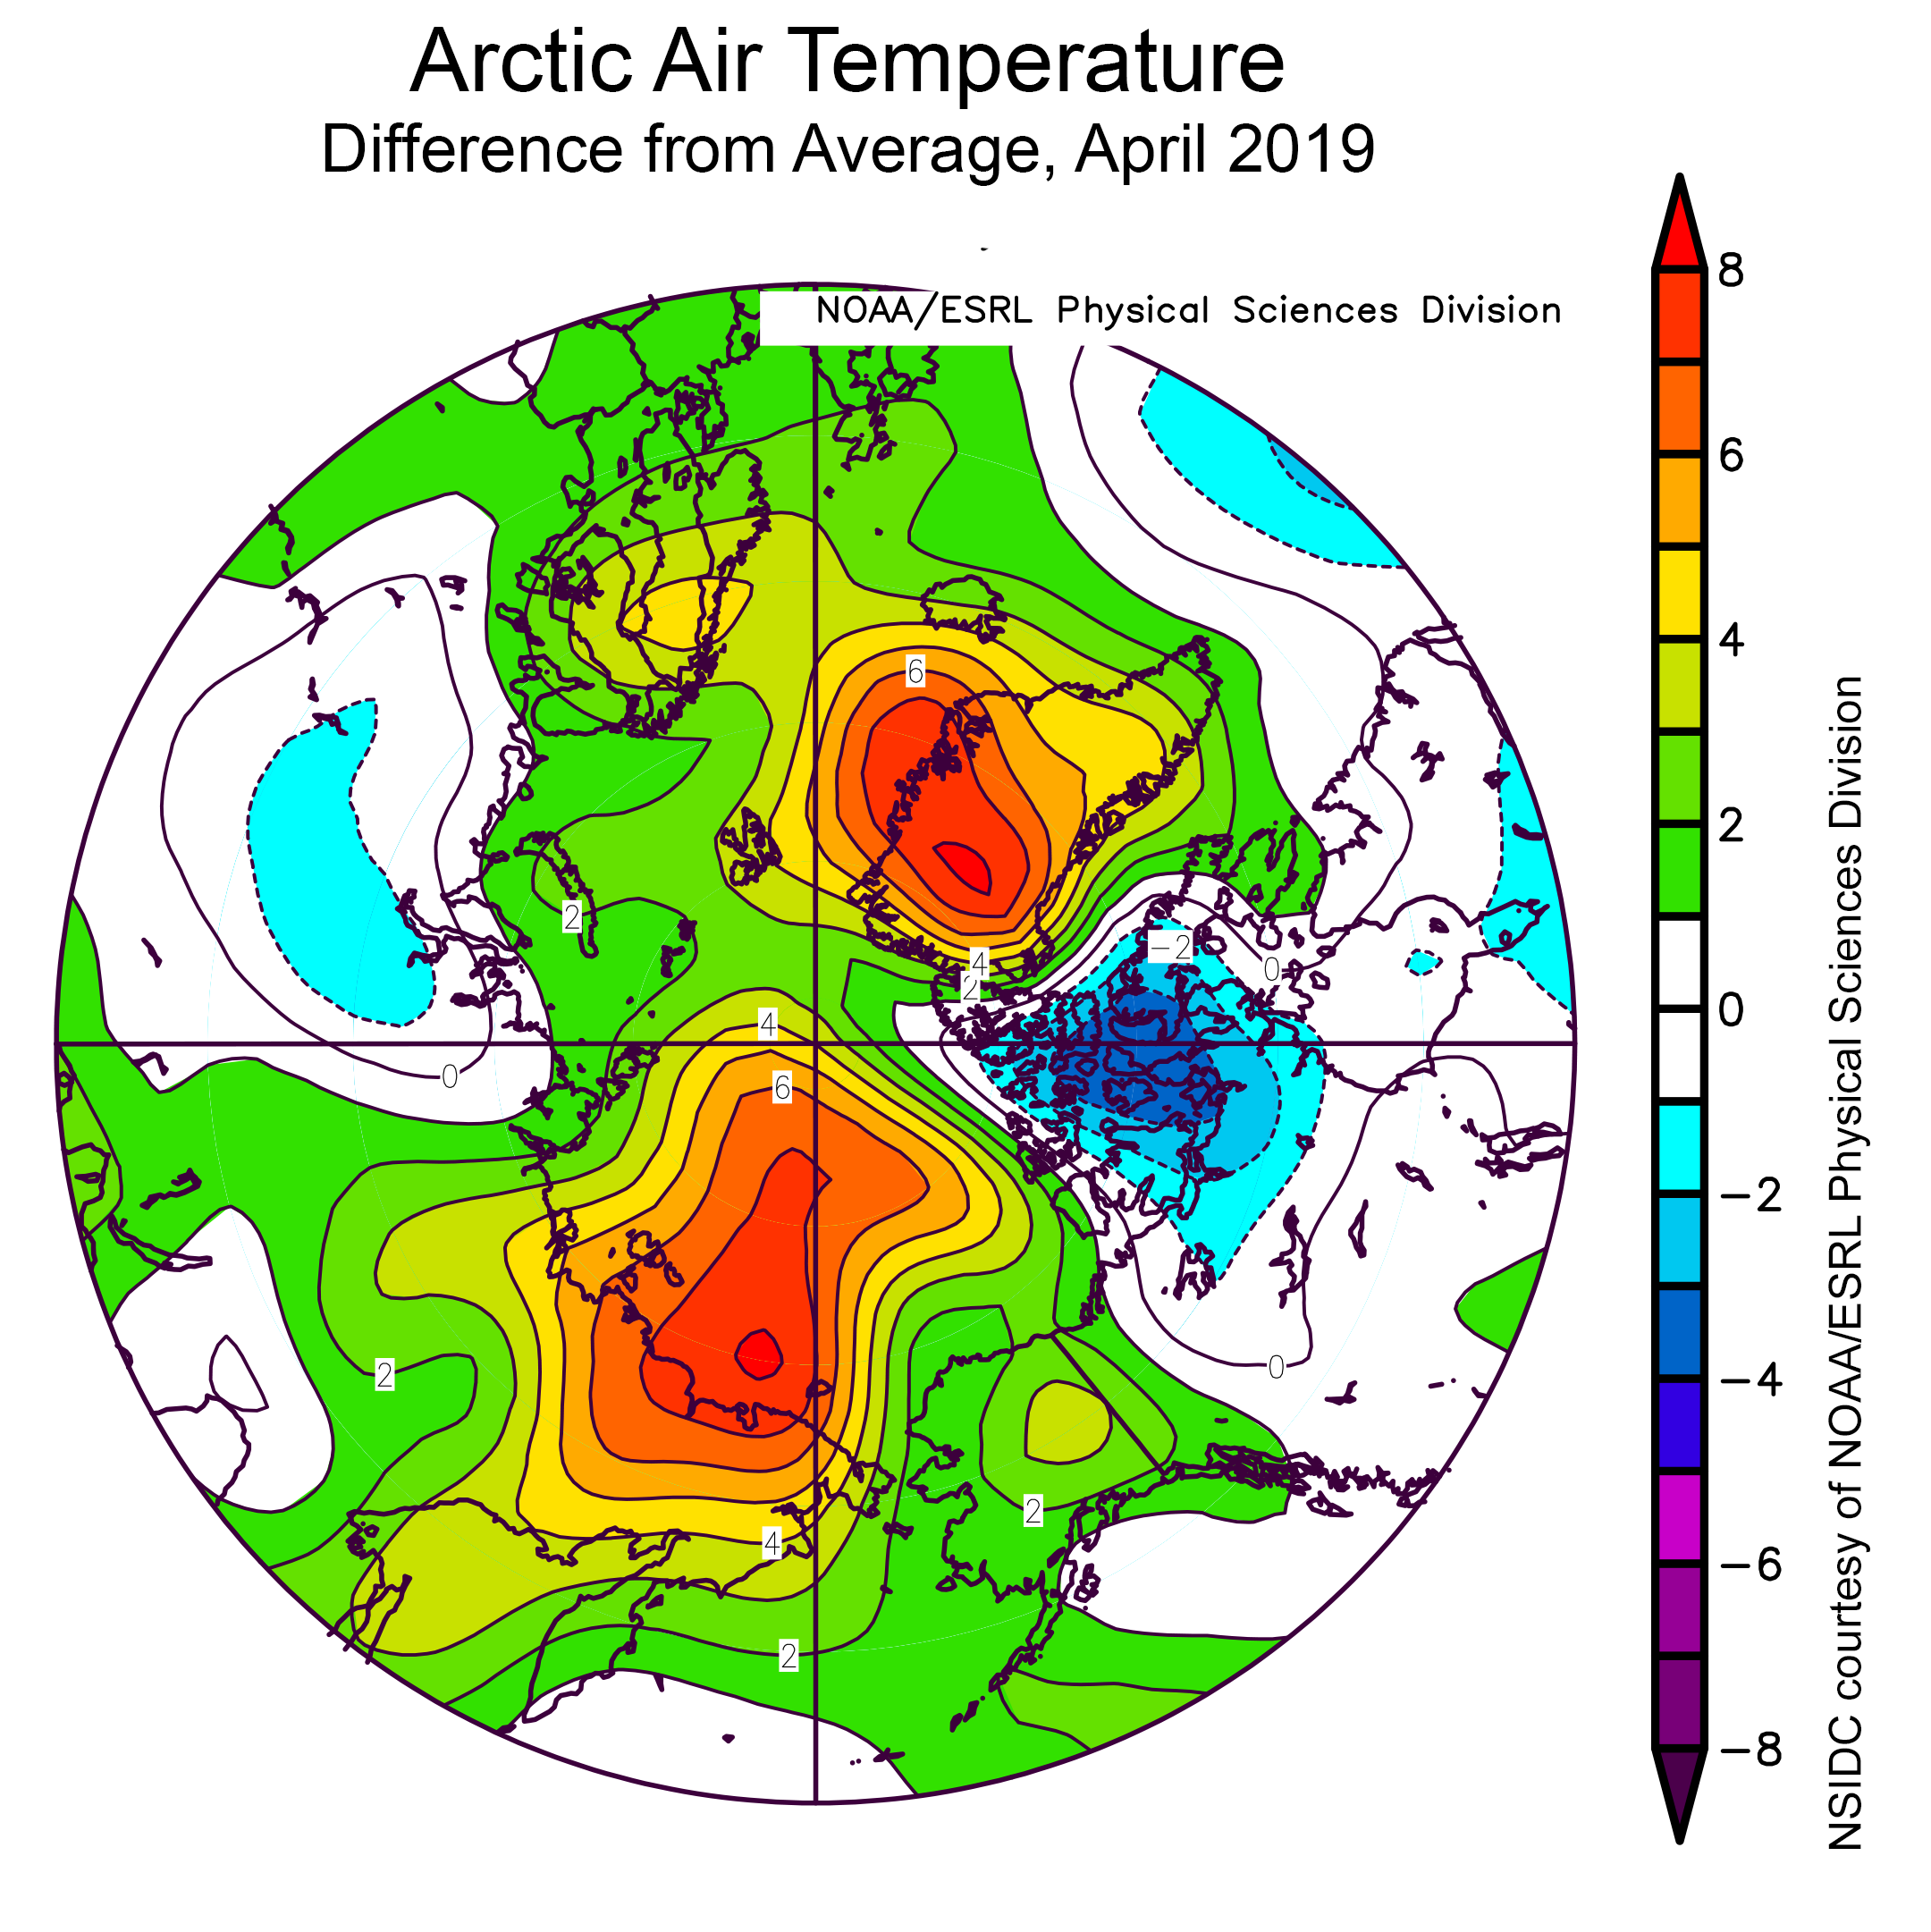
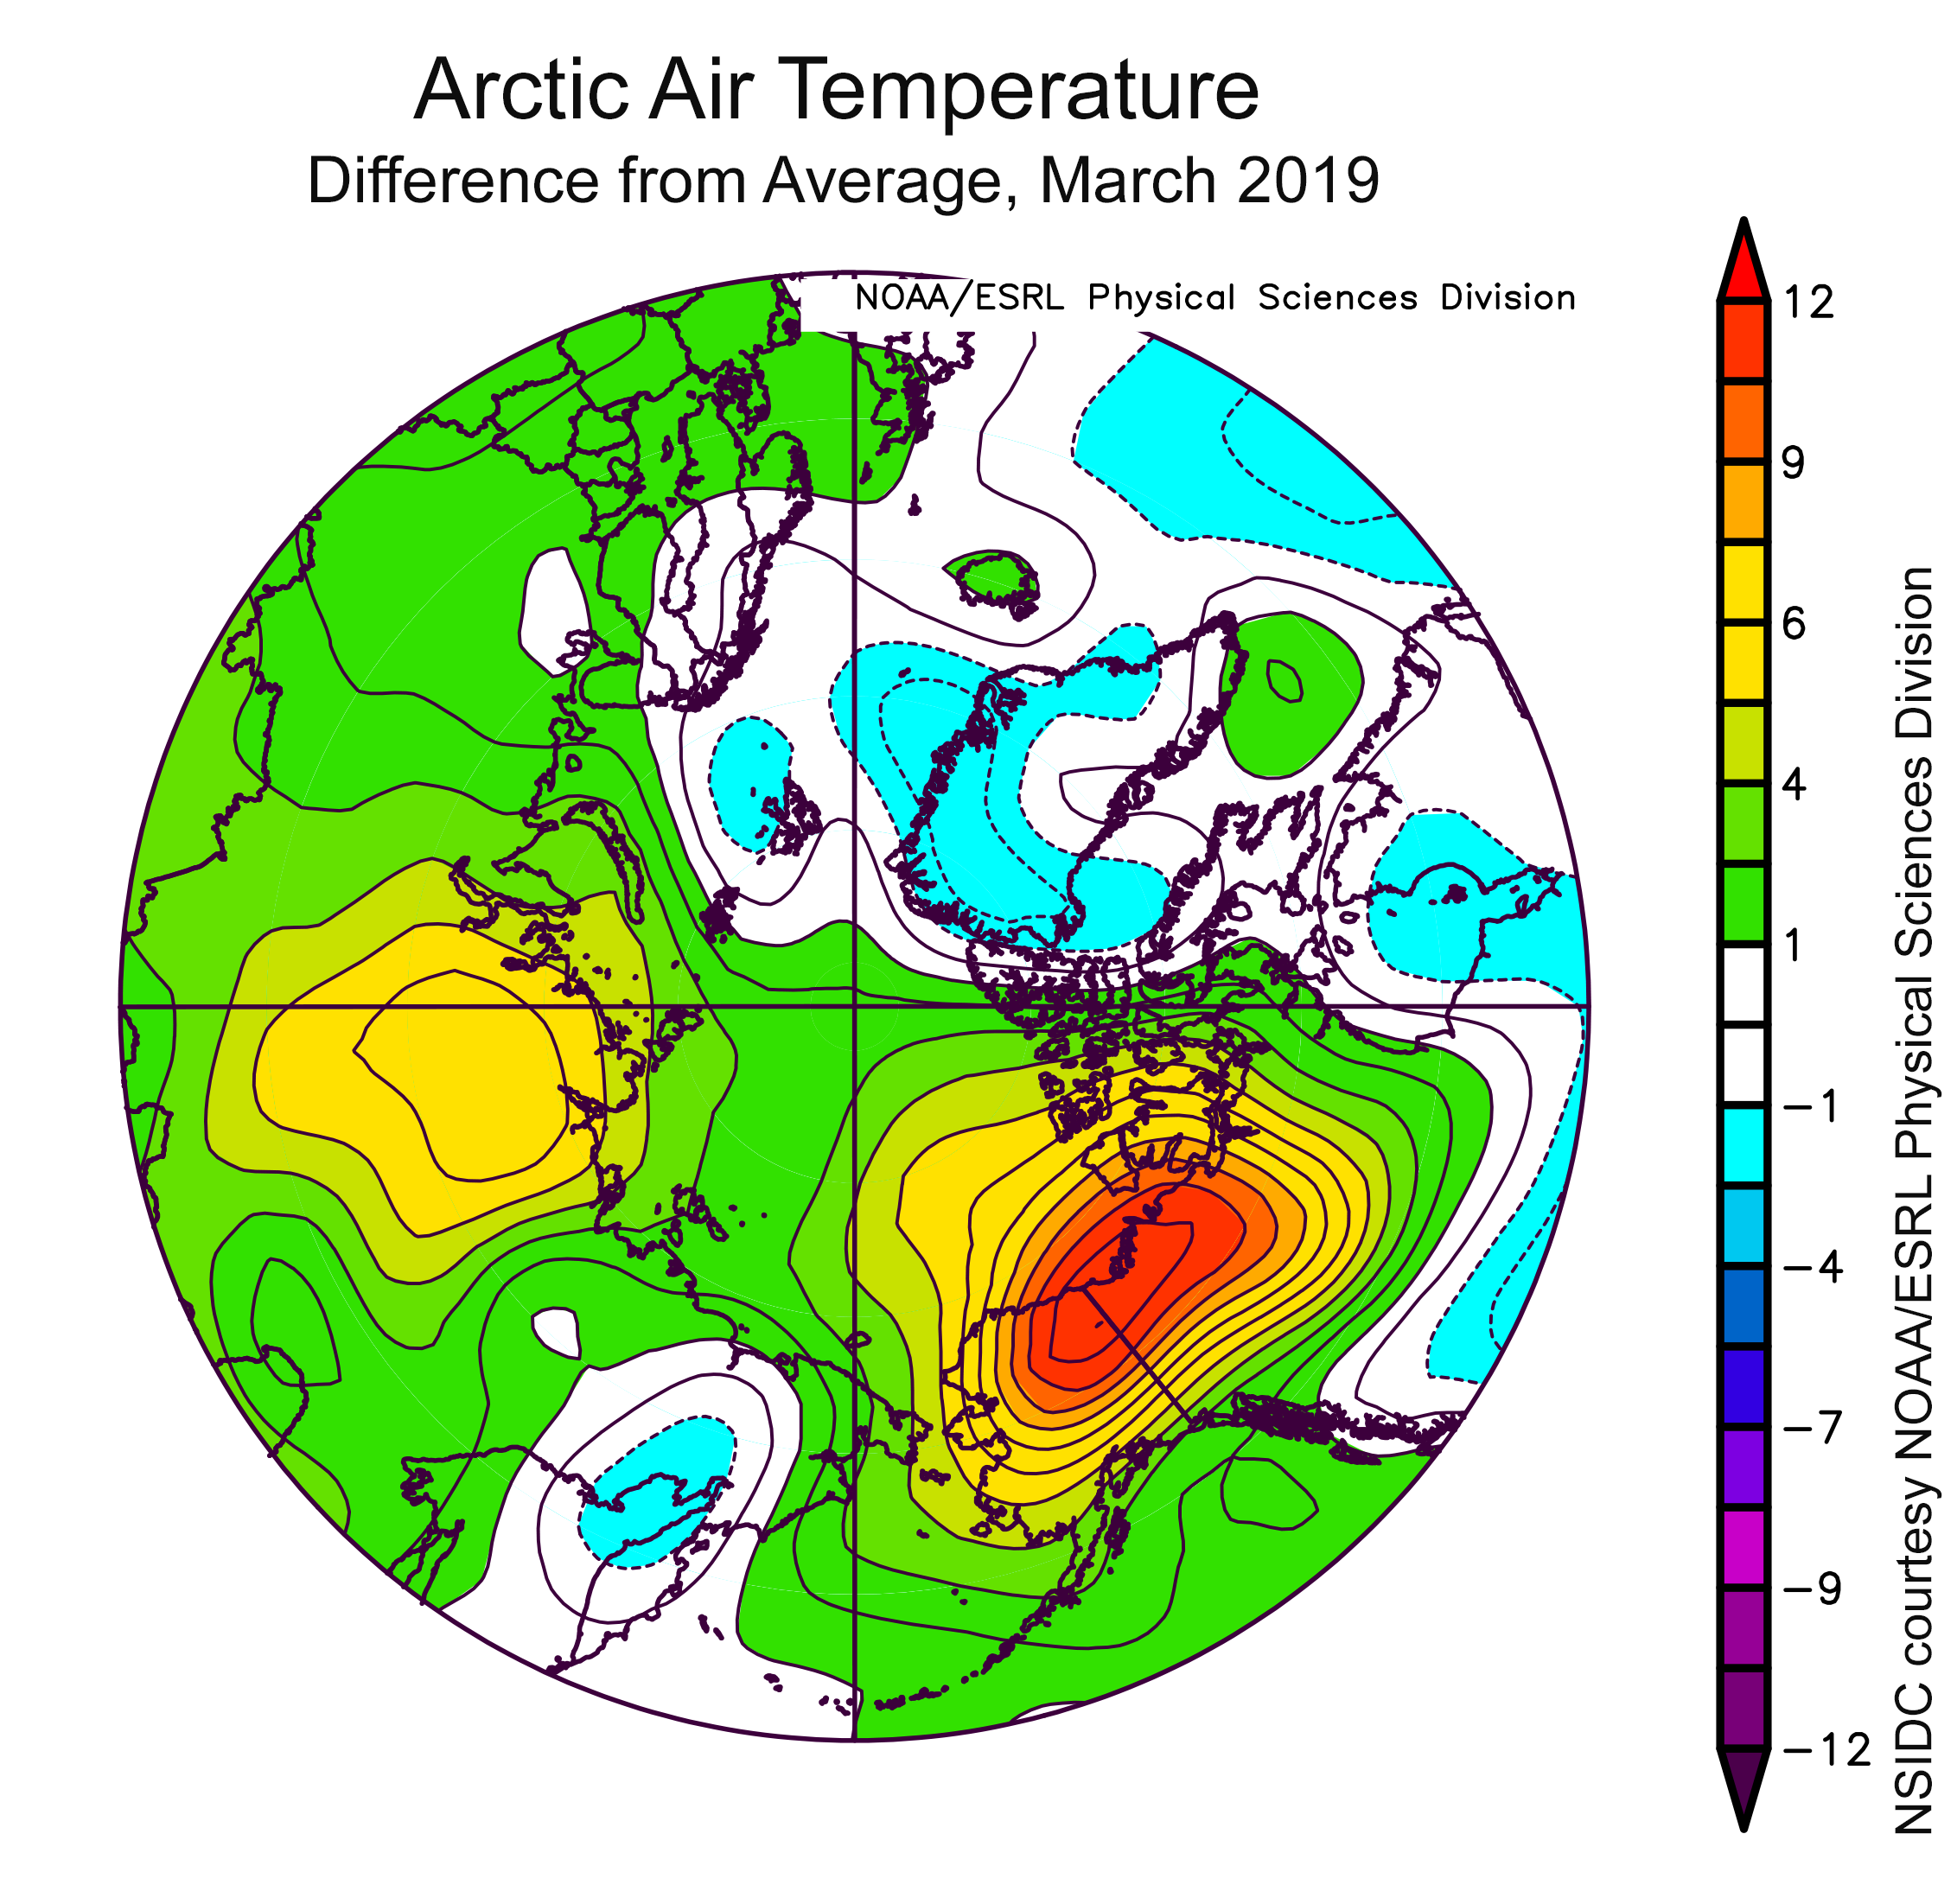
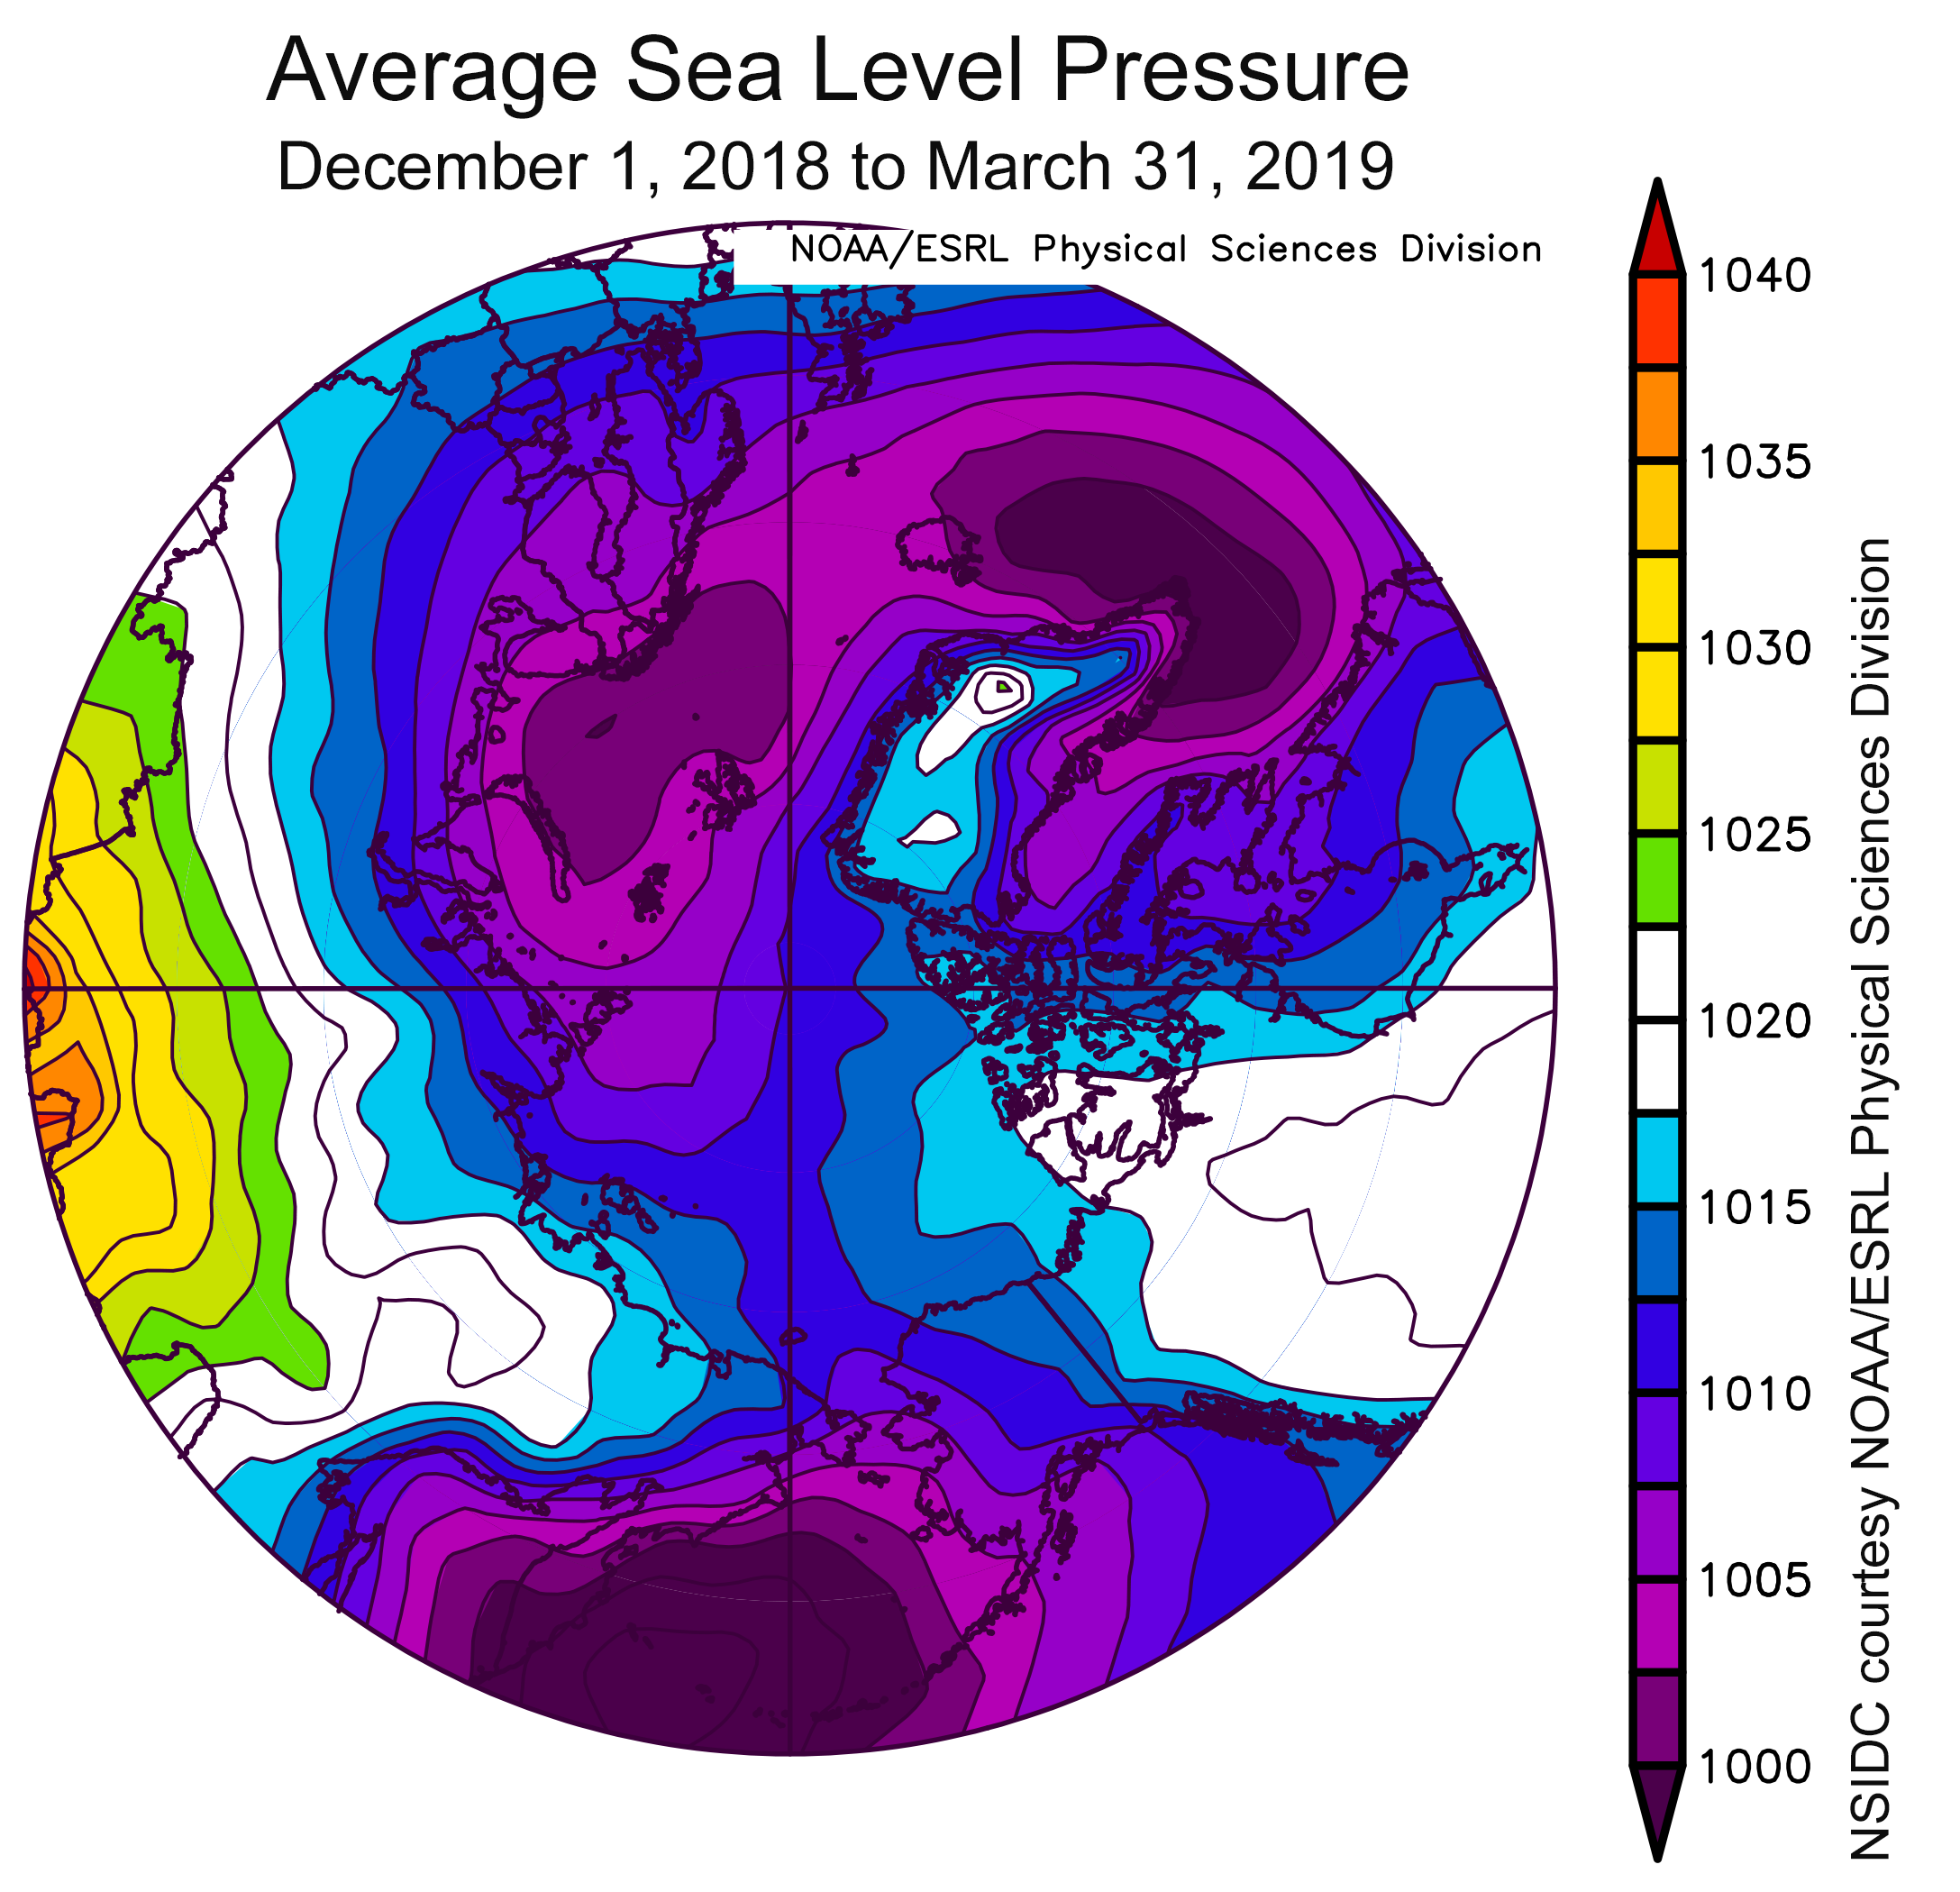
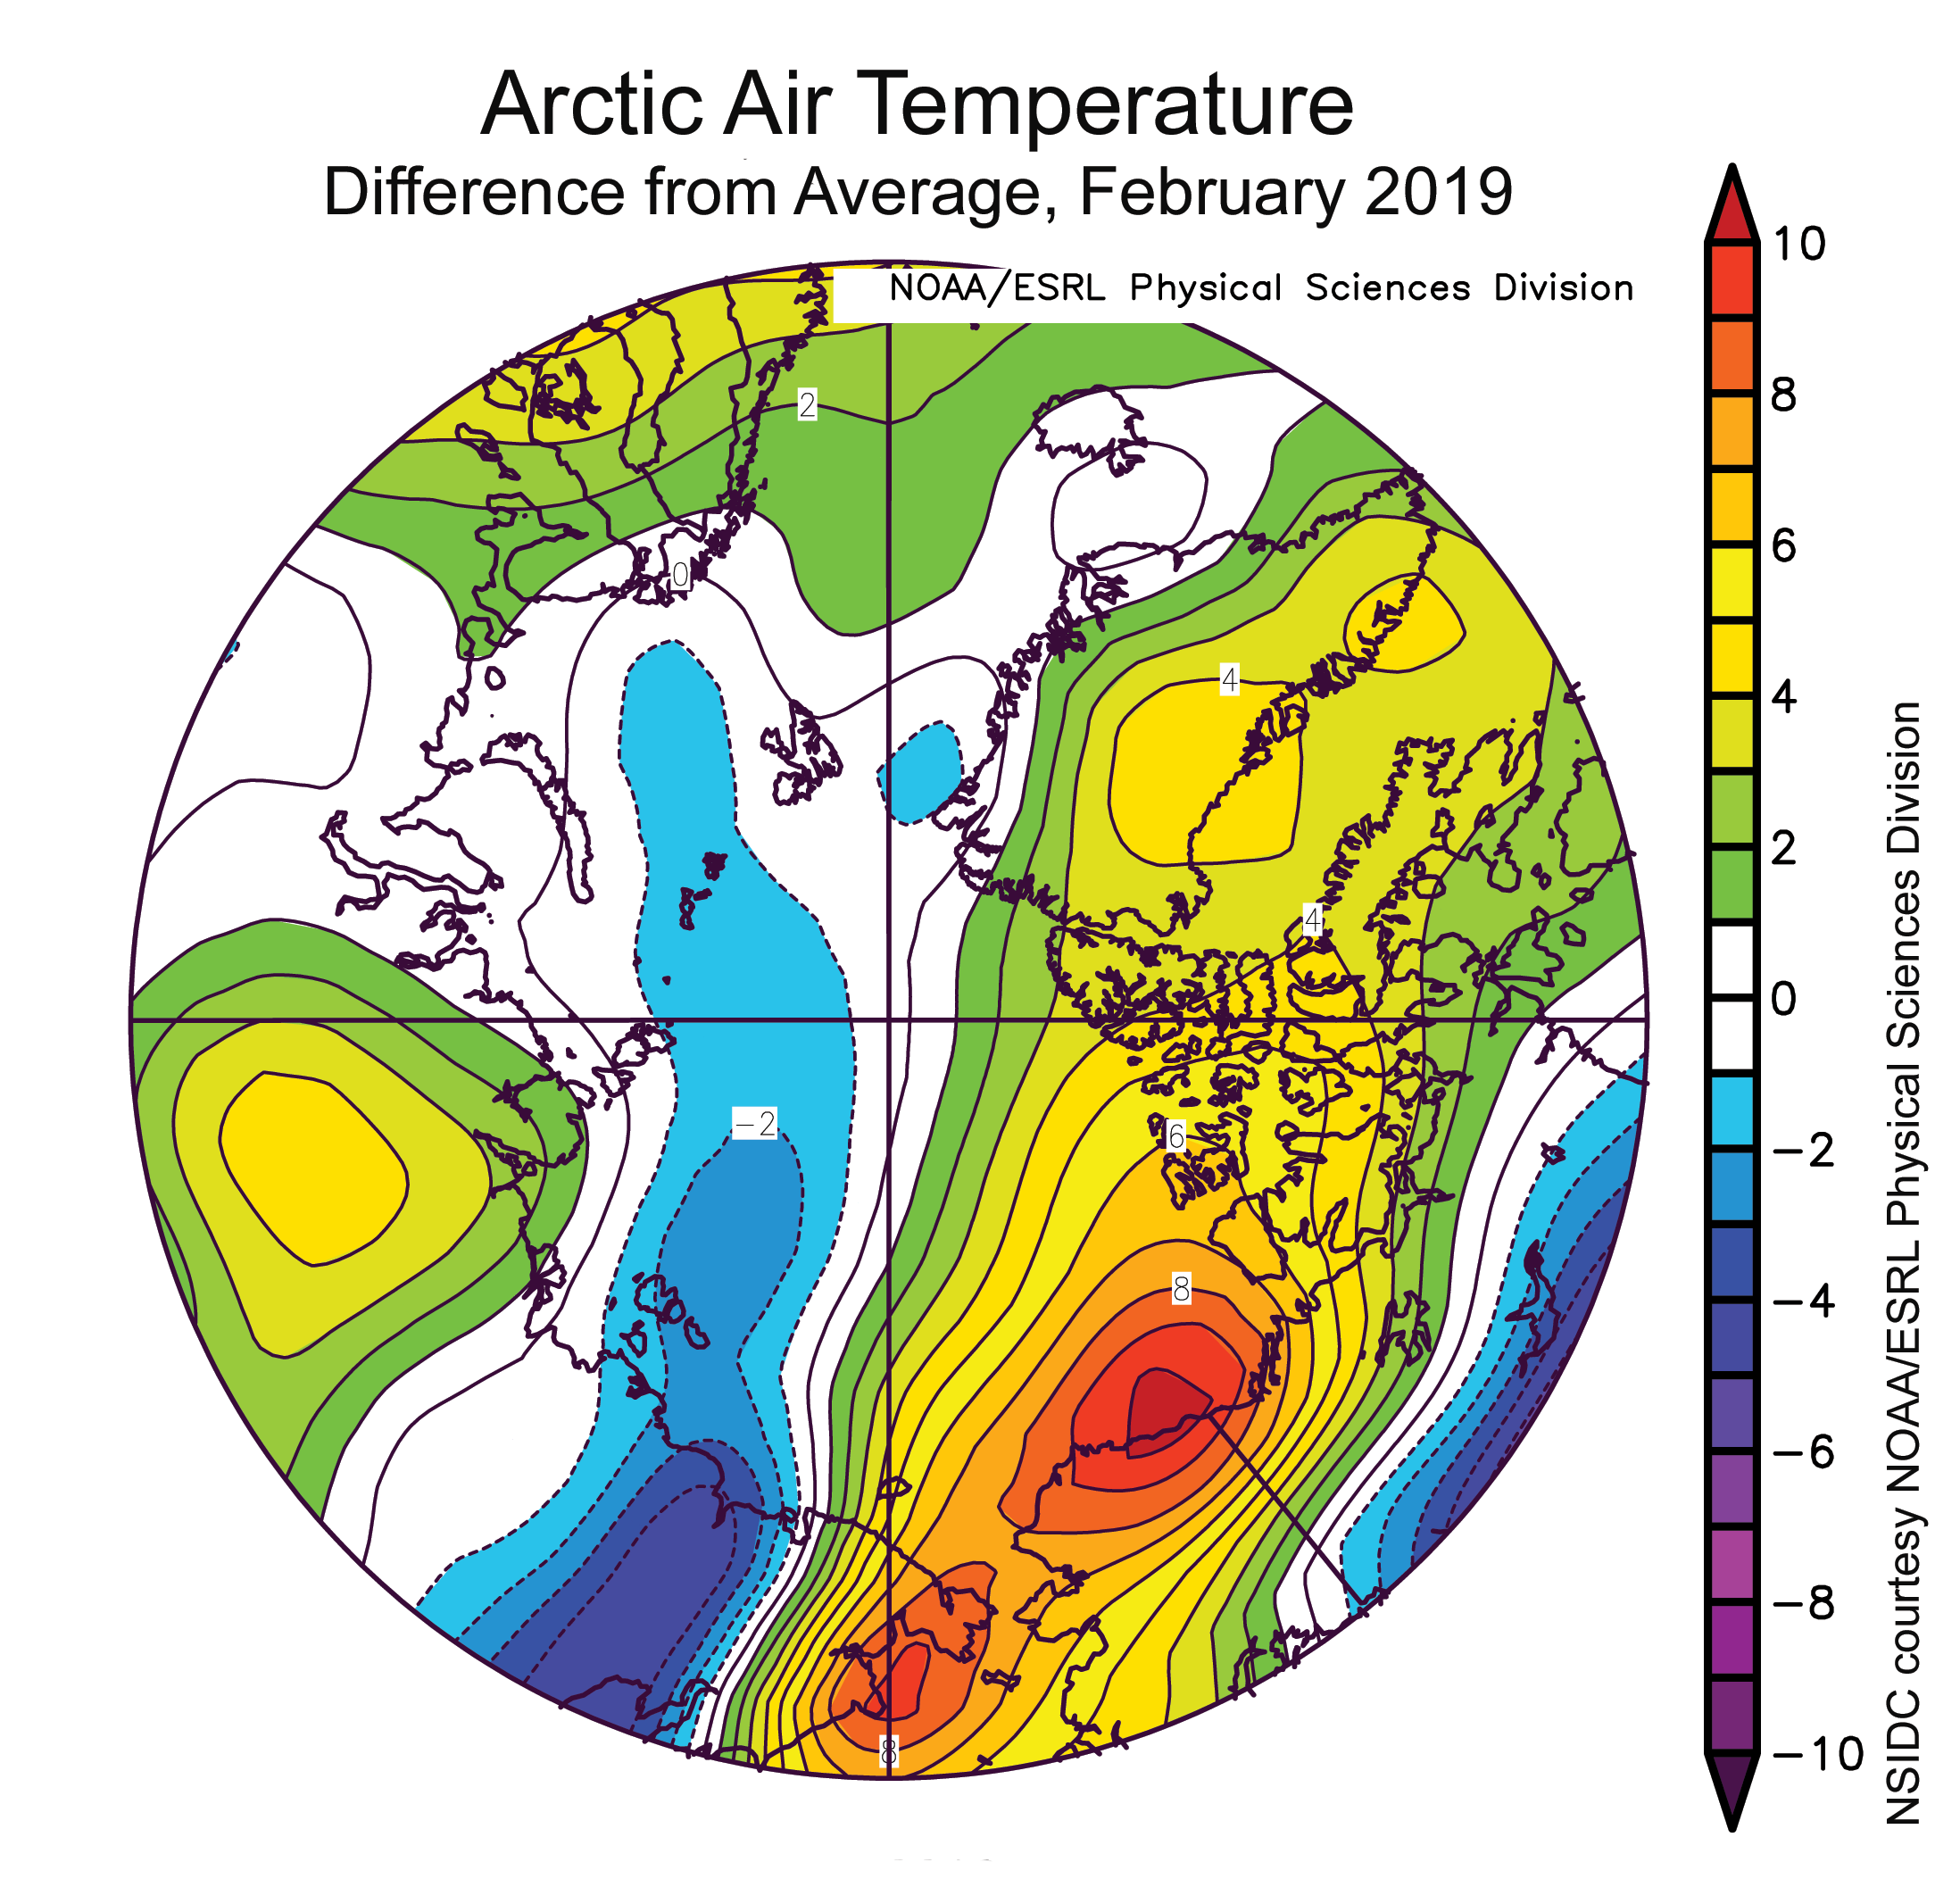
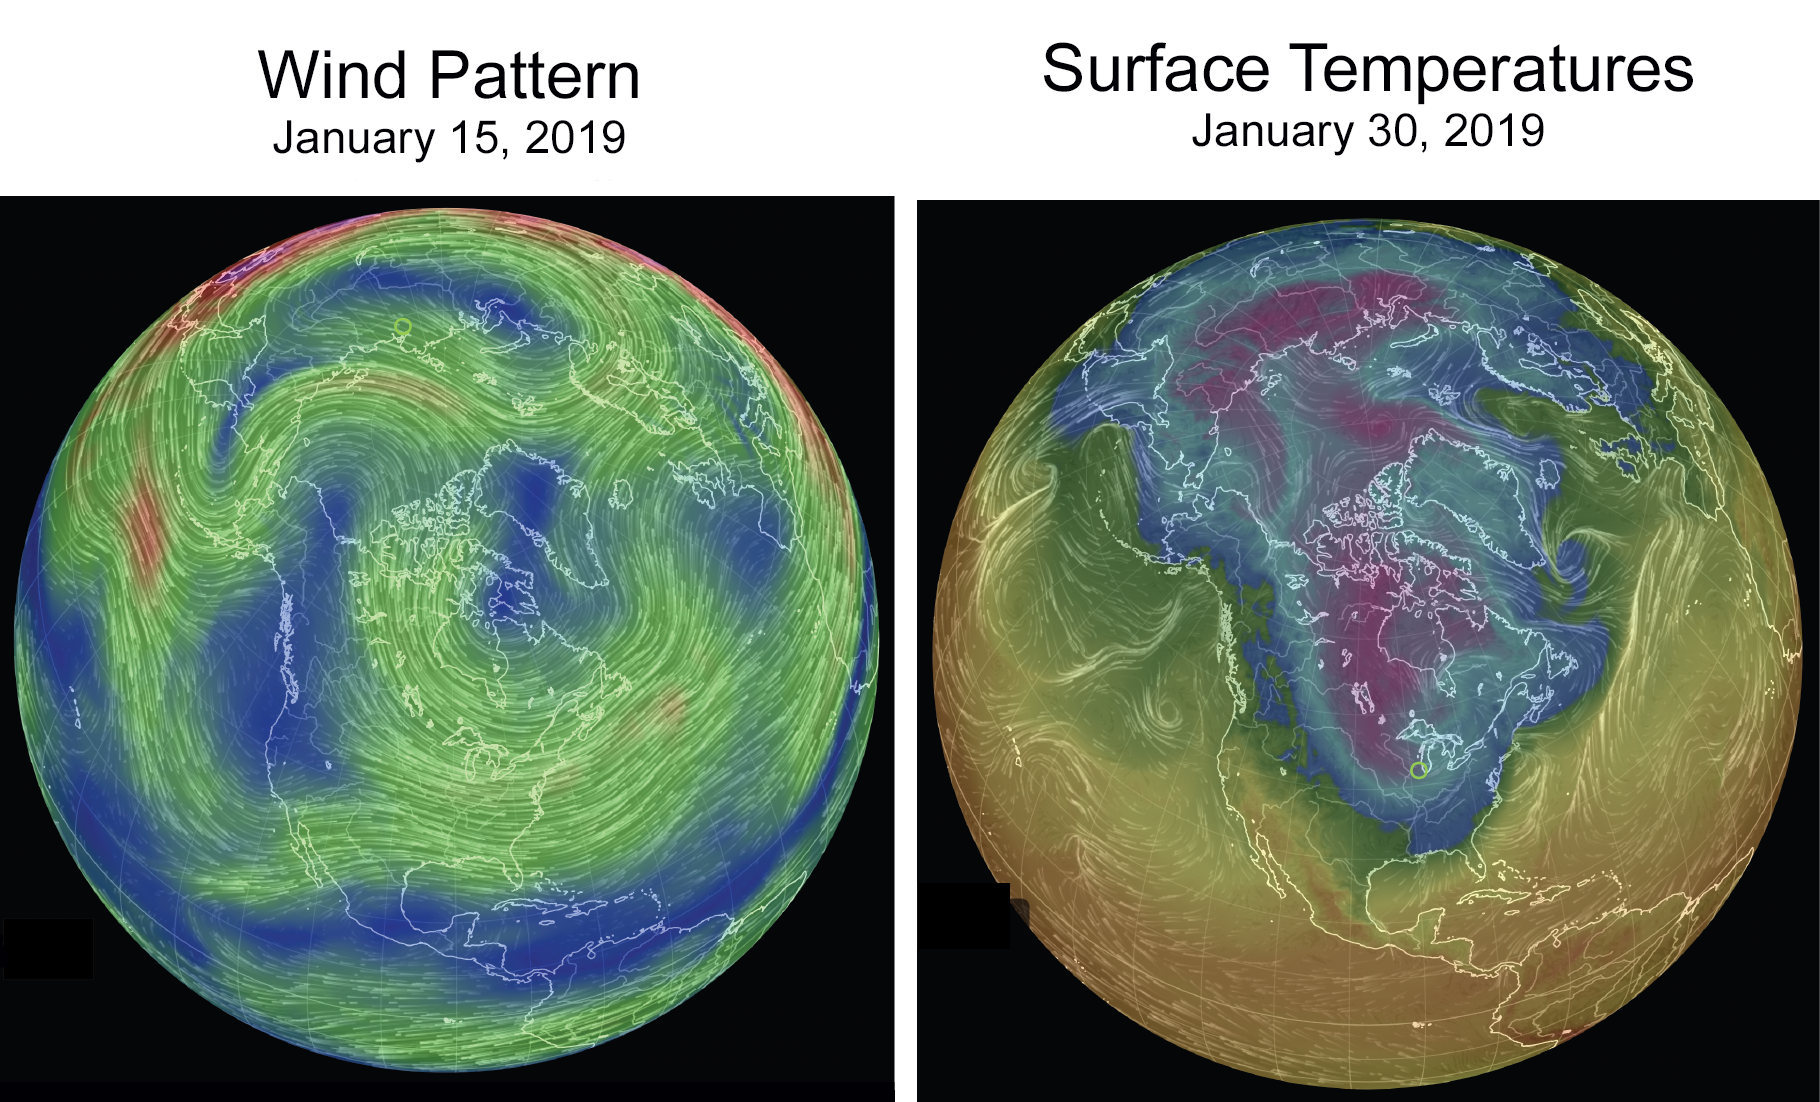
Figure 2b. This plot shows the departure from average air temperature in the Arctic at the 925 hPa level, in degrees Celsius, for May 2019. Yellows and reds indicate higher than average temperatures; blues and purples indicate lower than average temperatures.
Credit: NSIDC courtesy NOAA Earth System Research Laboratory Physical Sciences Division
High-resolution image
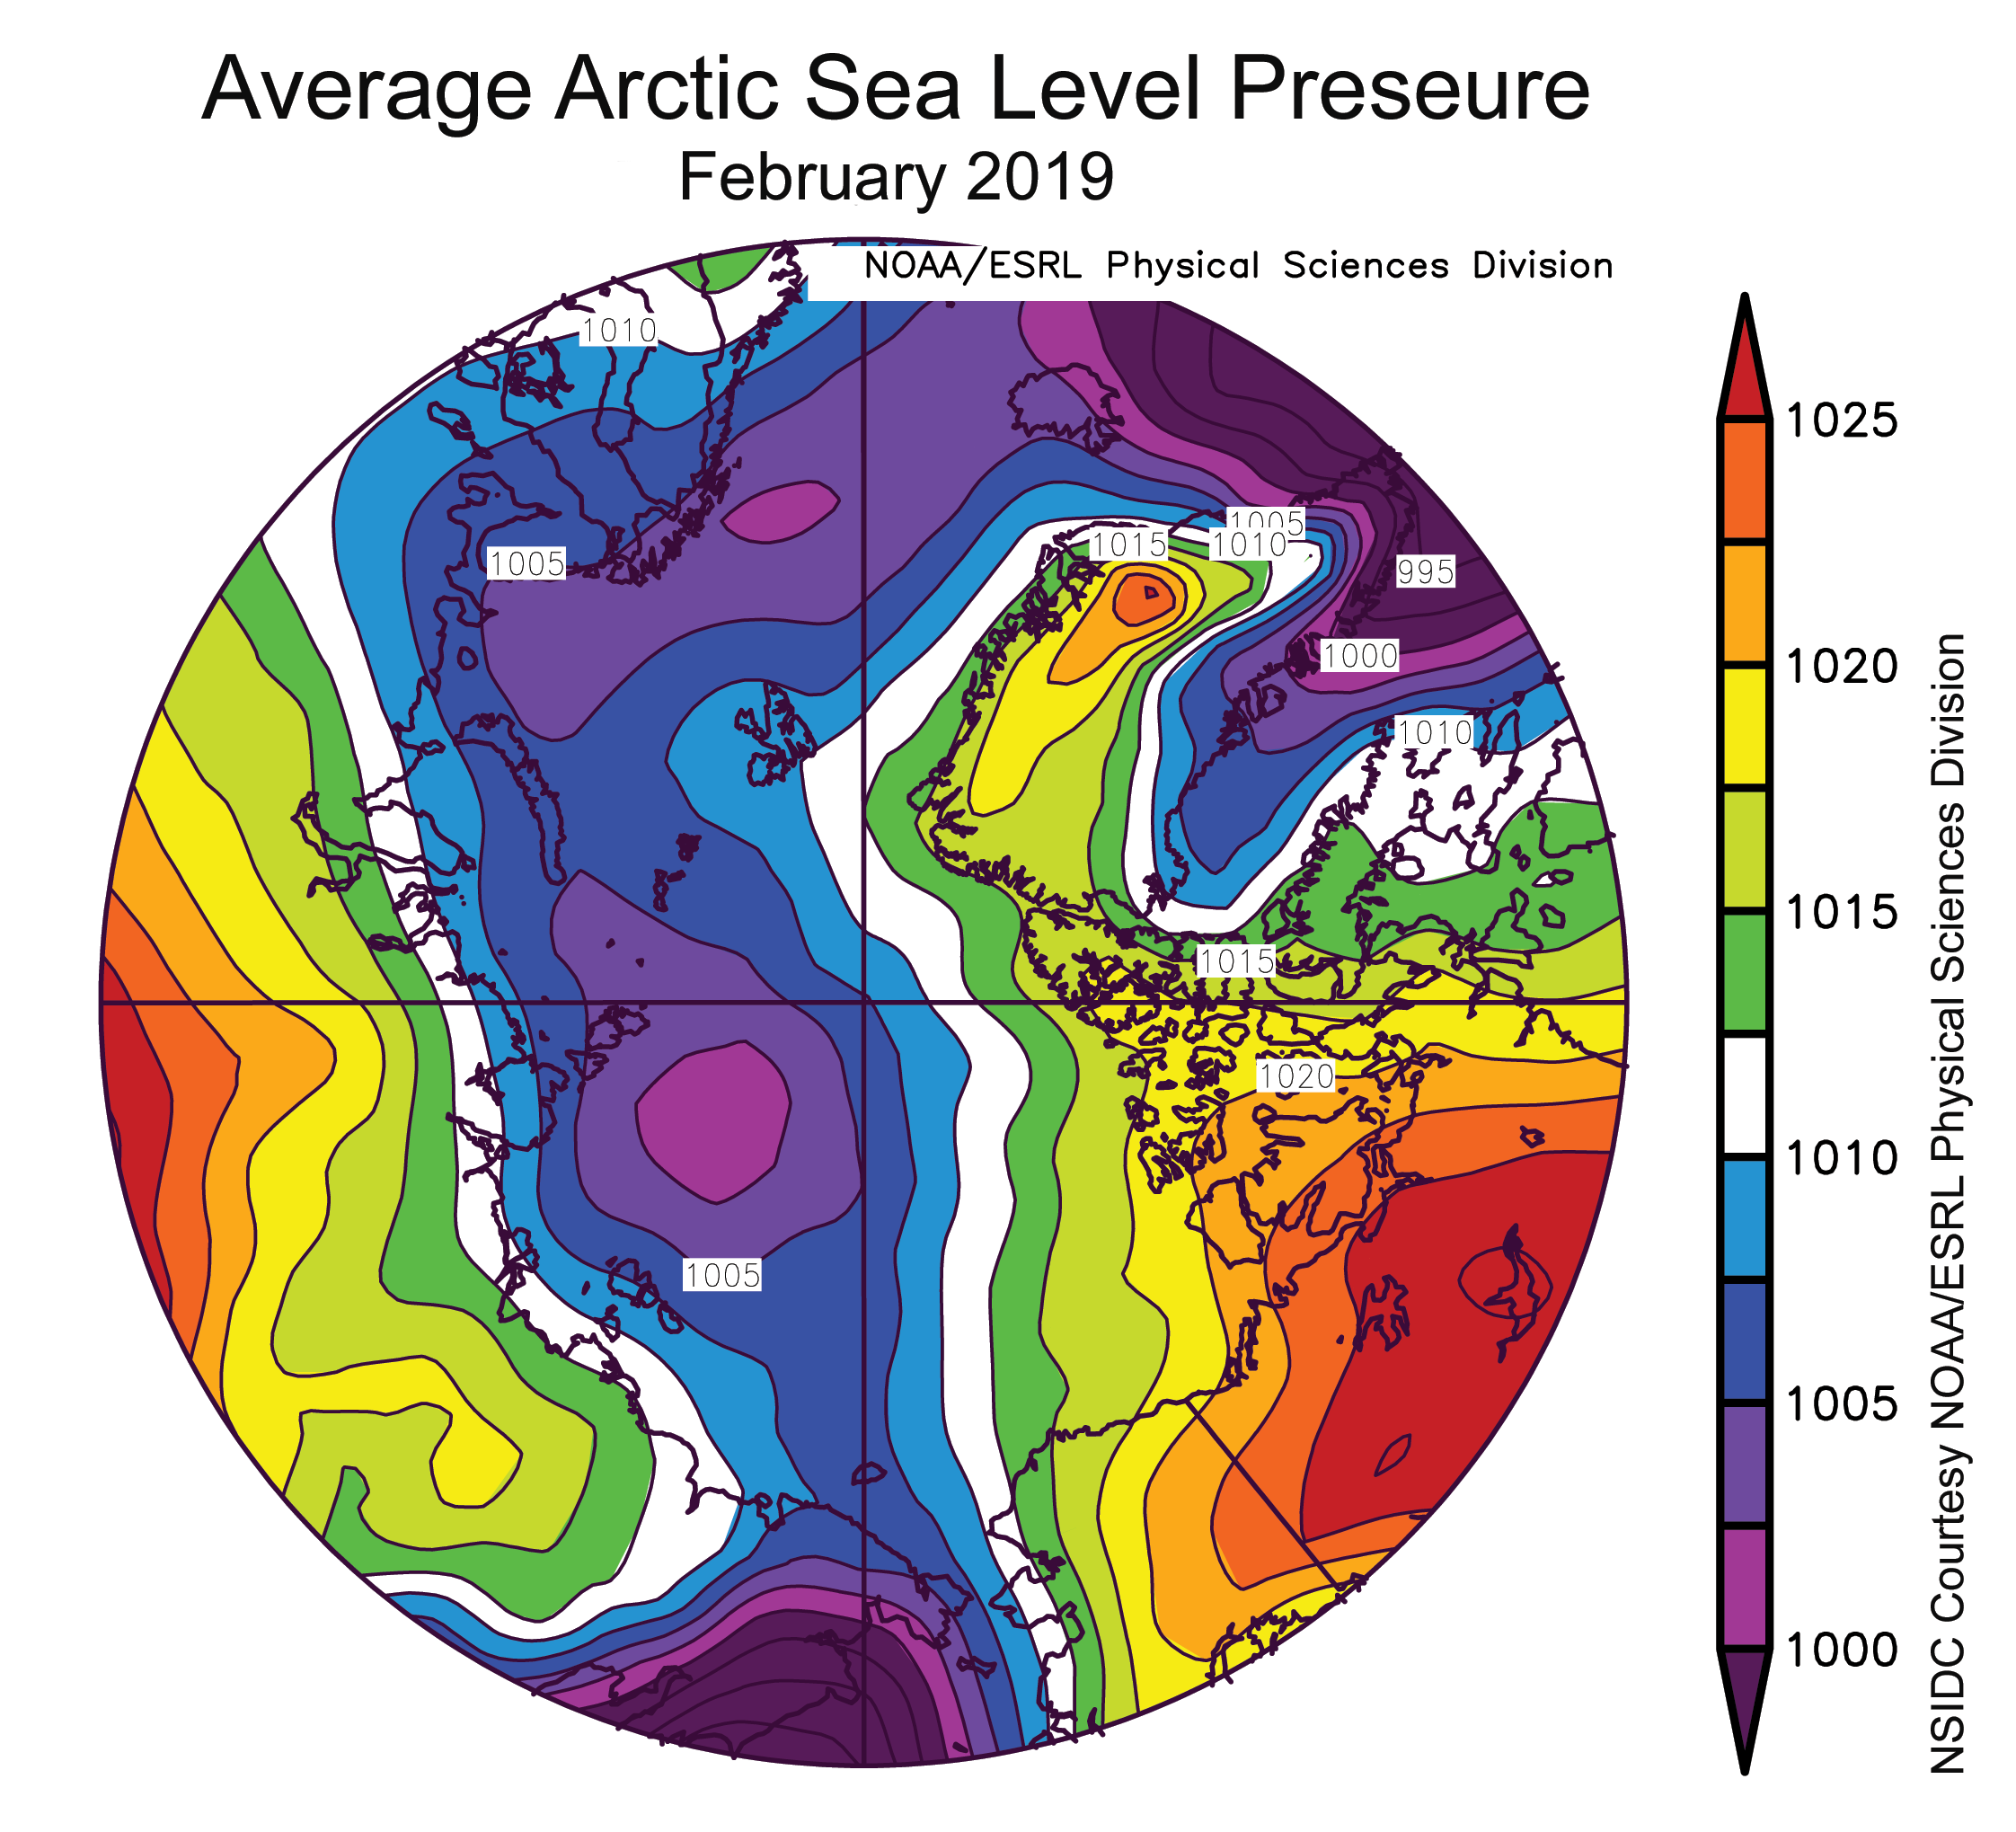
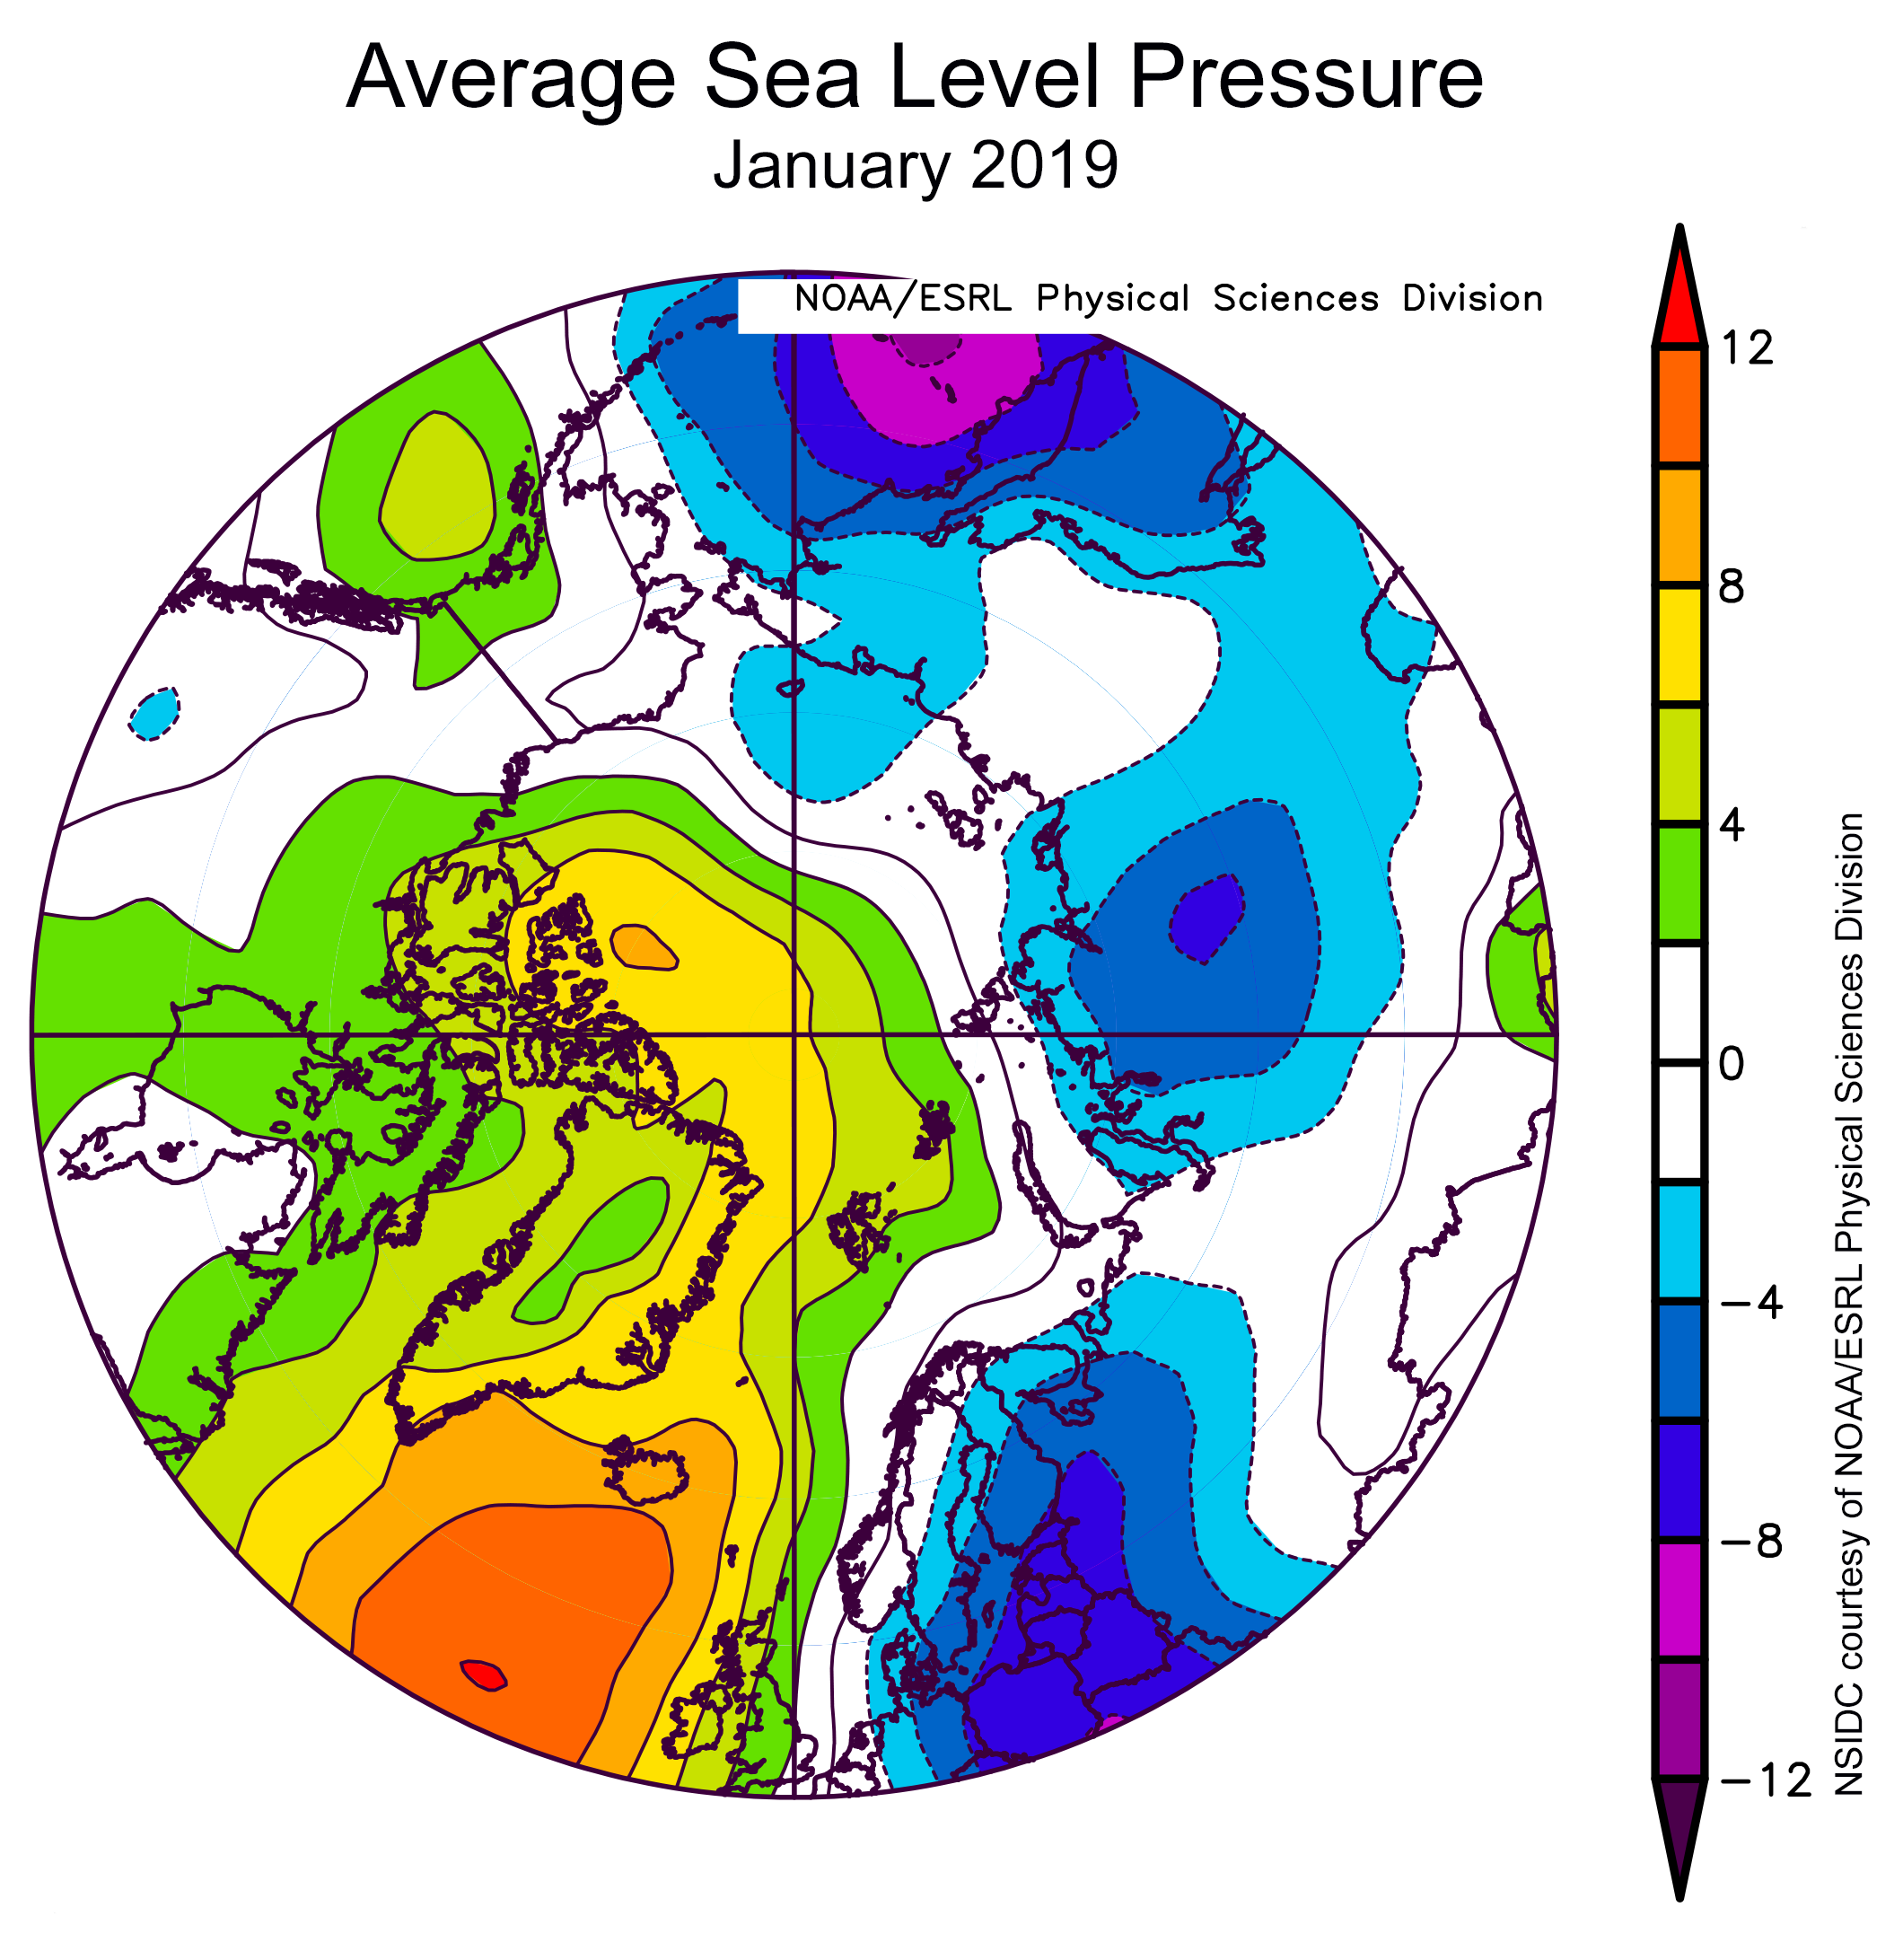
Broadly following the pattern for April, air temperatures at the 925 hPa level (approximately 2,500 feet above the surface) for May were again well above average over nearly all of the Arctic Ocean. Along the western Greenland coast, a broad area north of Greenland, and westward north of the Canadian Archipelago, temperatures were as much as 7 degrees Celsius (13 degrees Fahrenheit) above the 1981 to 2010 reference average for the month. Over much of the remainder of the Arctic Ocean, temperatures were 2 to 4 degrees Celsius (4 to 7 degrees Fahrenheit) above average. By contrast, over the Barents Sea as well as along the Laptev Sea coast, temperatures were near average or up to 2 degrees (4 degrees Fahrenheit) below average. As averaged for May, there was an area of high sea level pressure, an anticyclone, centered near the pole. This pattern drew warm air from the south into Baffin Bay and into the Arctic Ocean. Also, air under an anticyclone descends and warms. Both factors help to explain the unusually high temperatures over much of the Arctic Ocean.
May 2019 compared to previous years
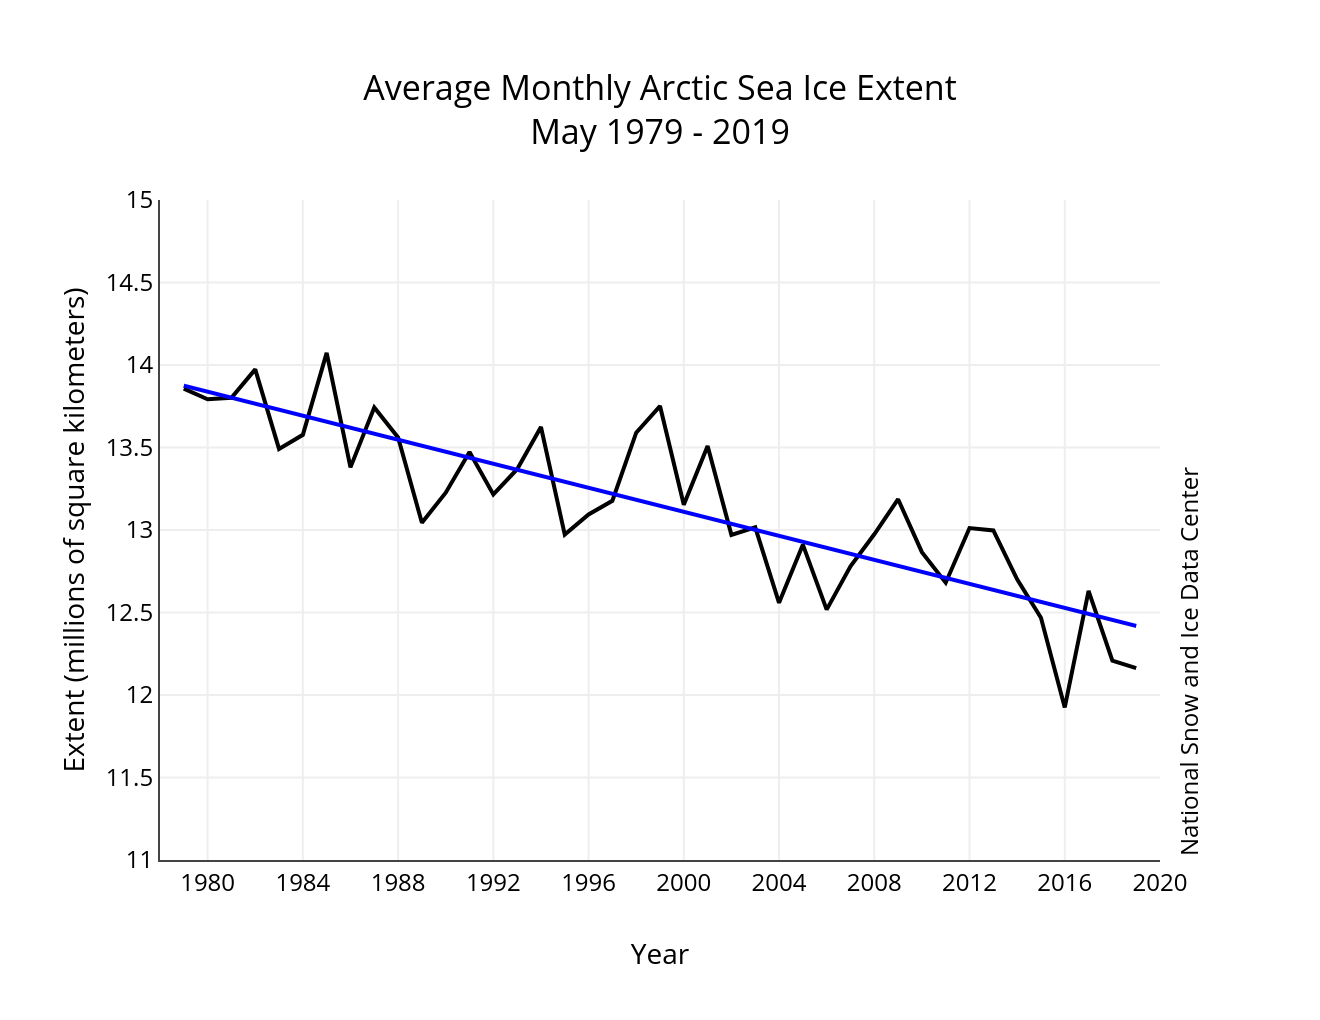
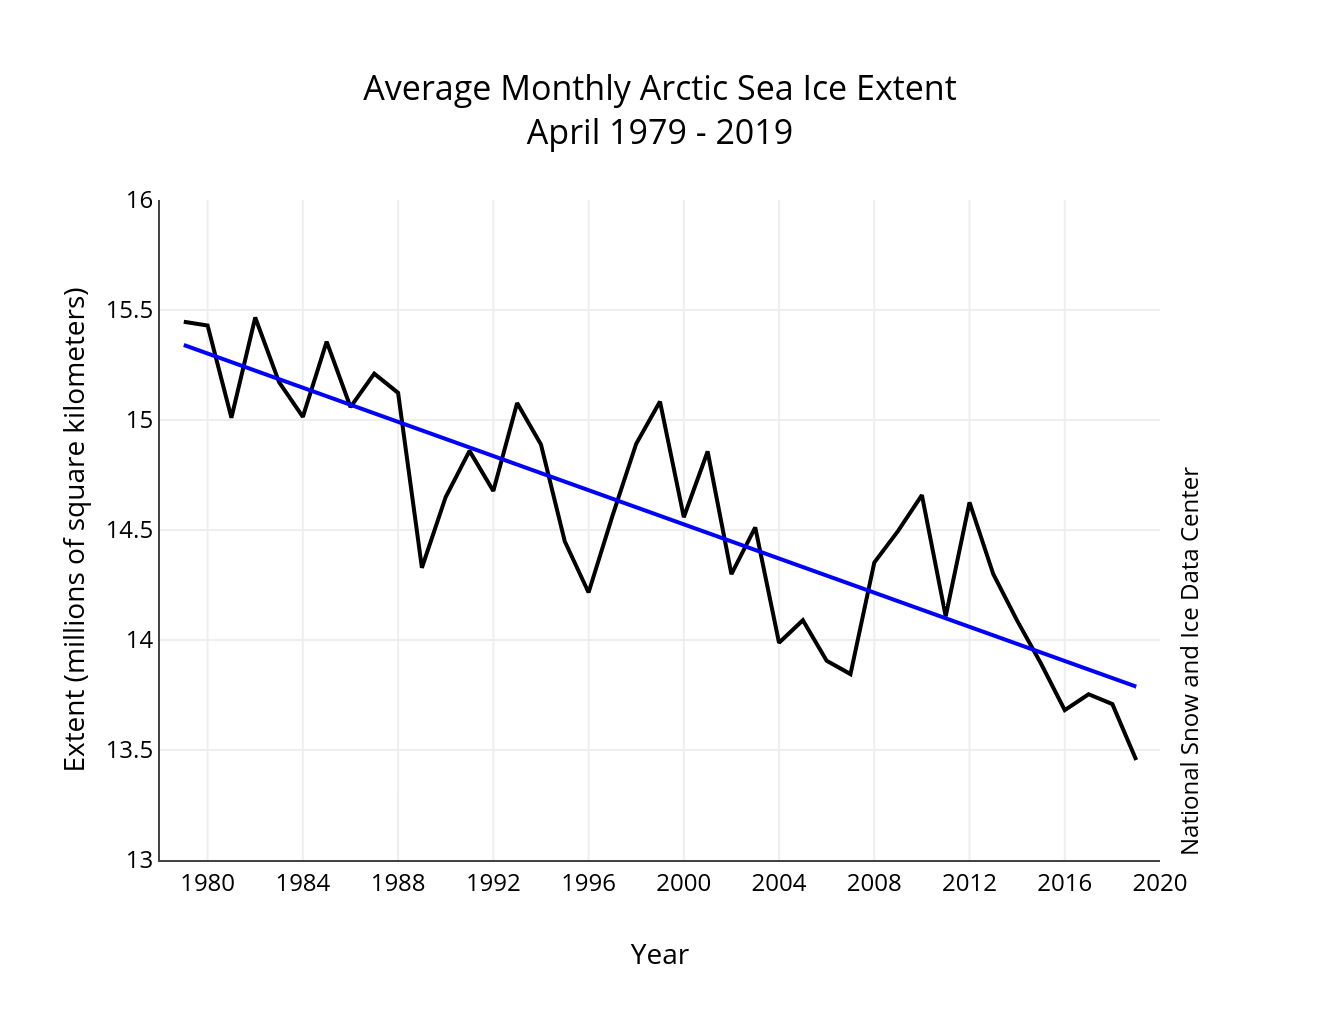
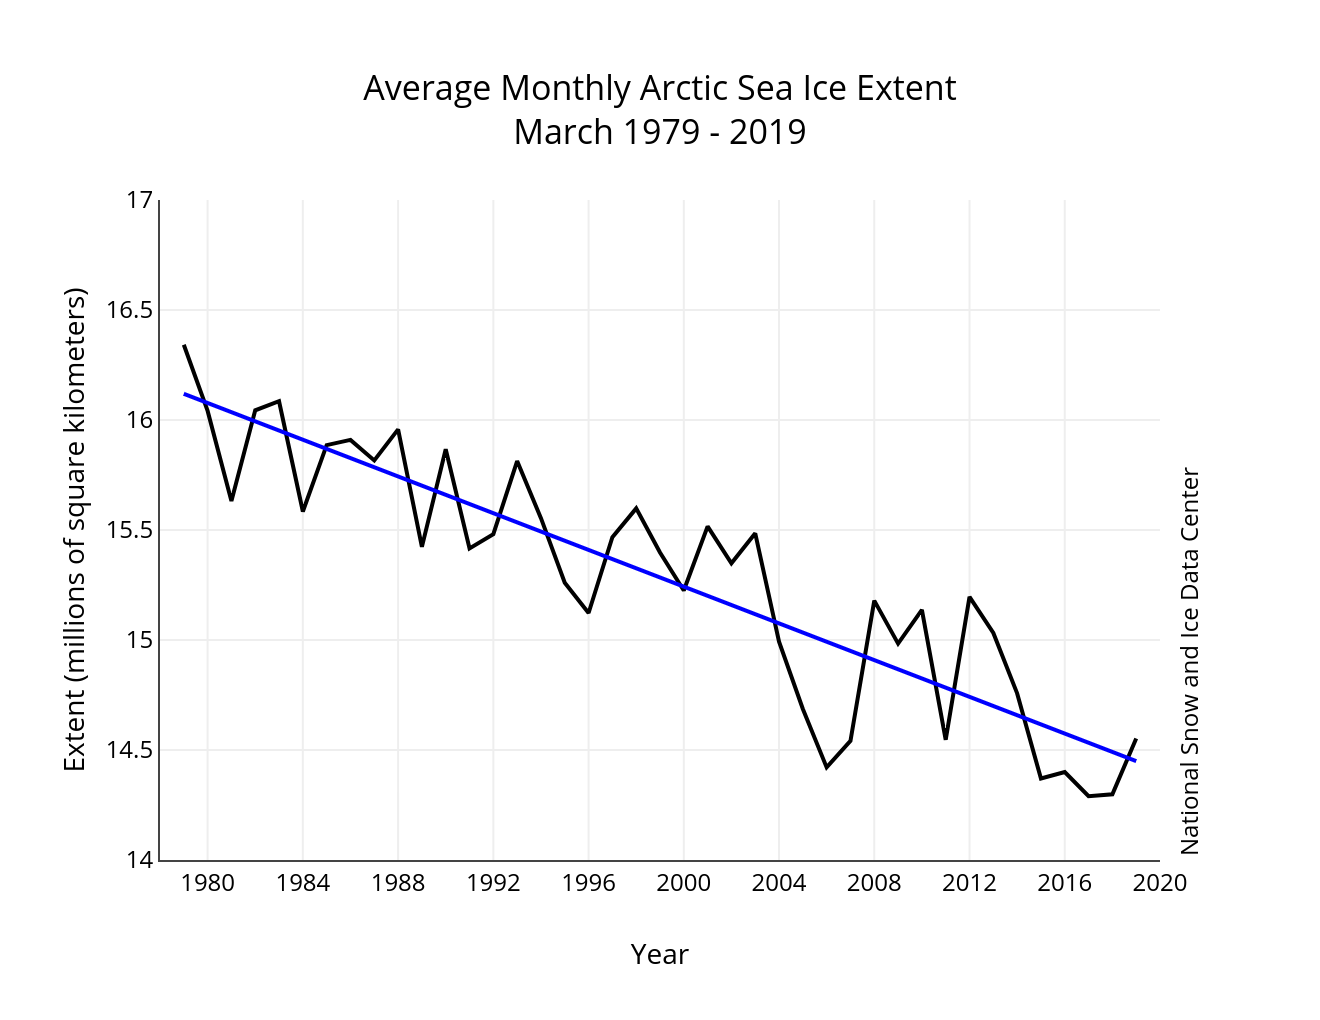
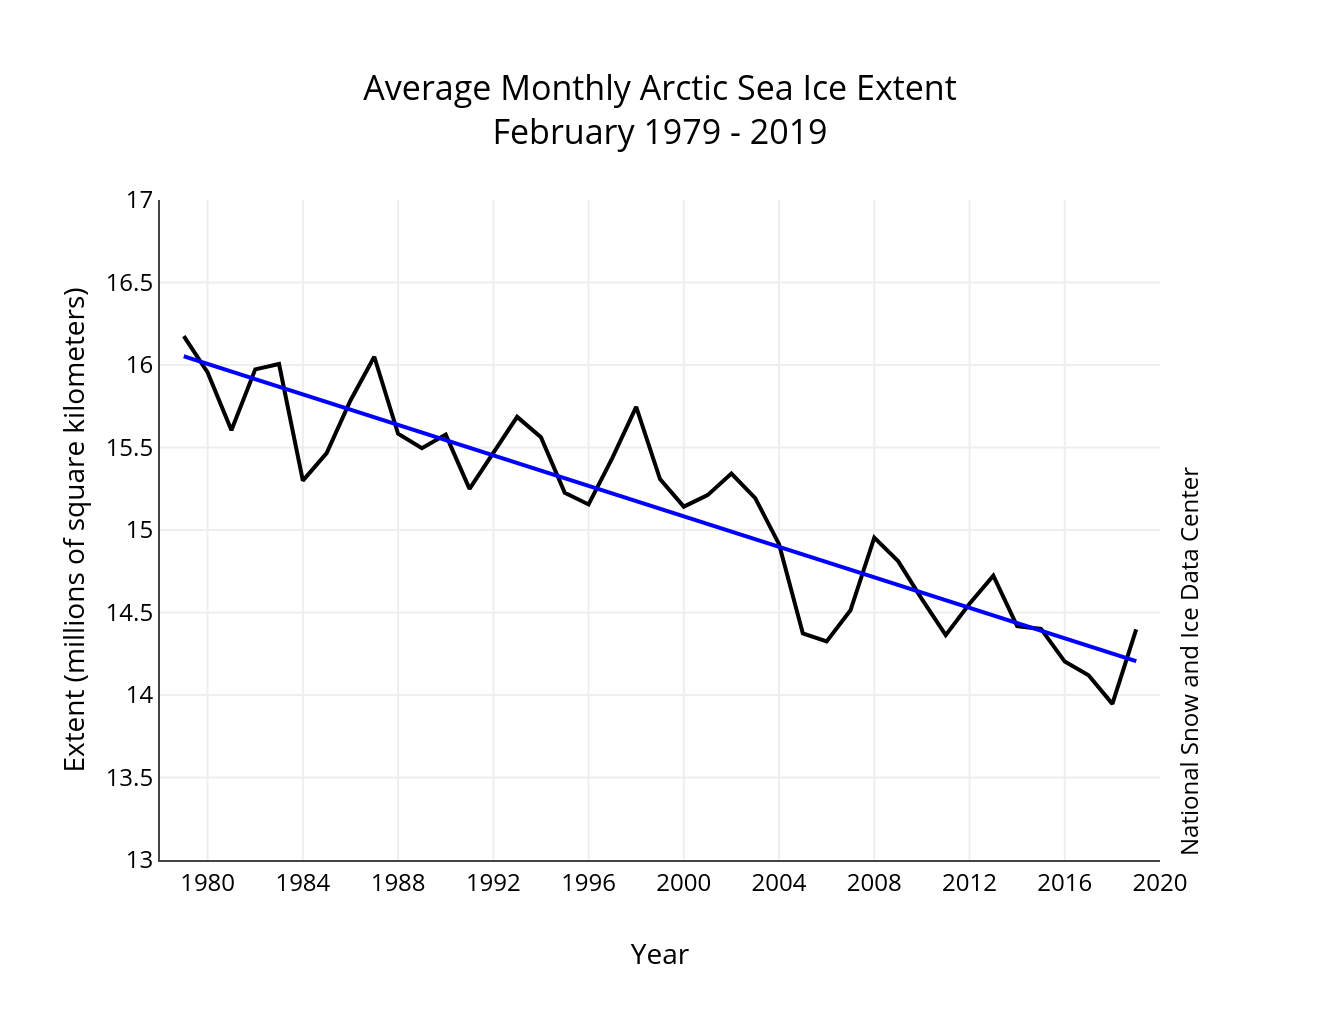
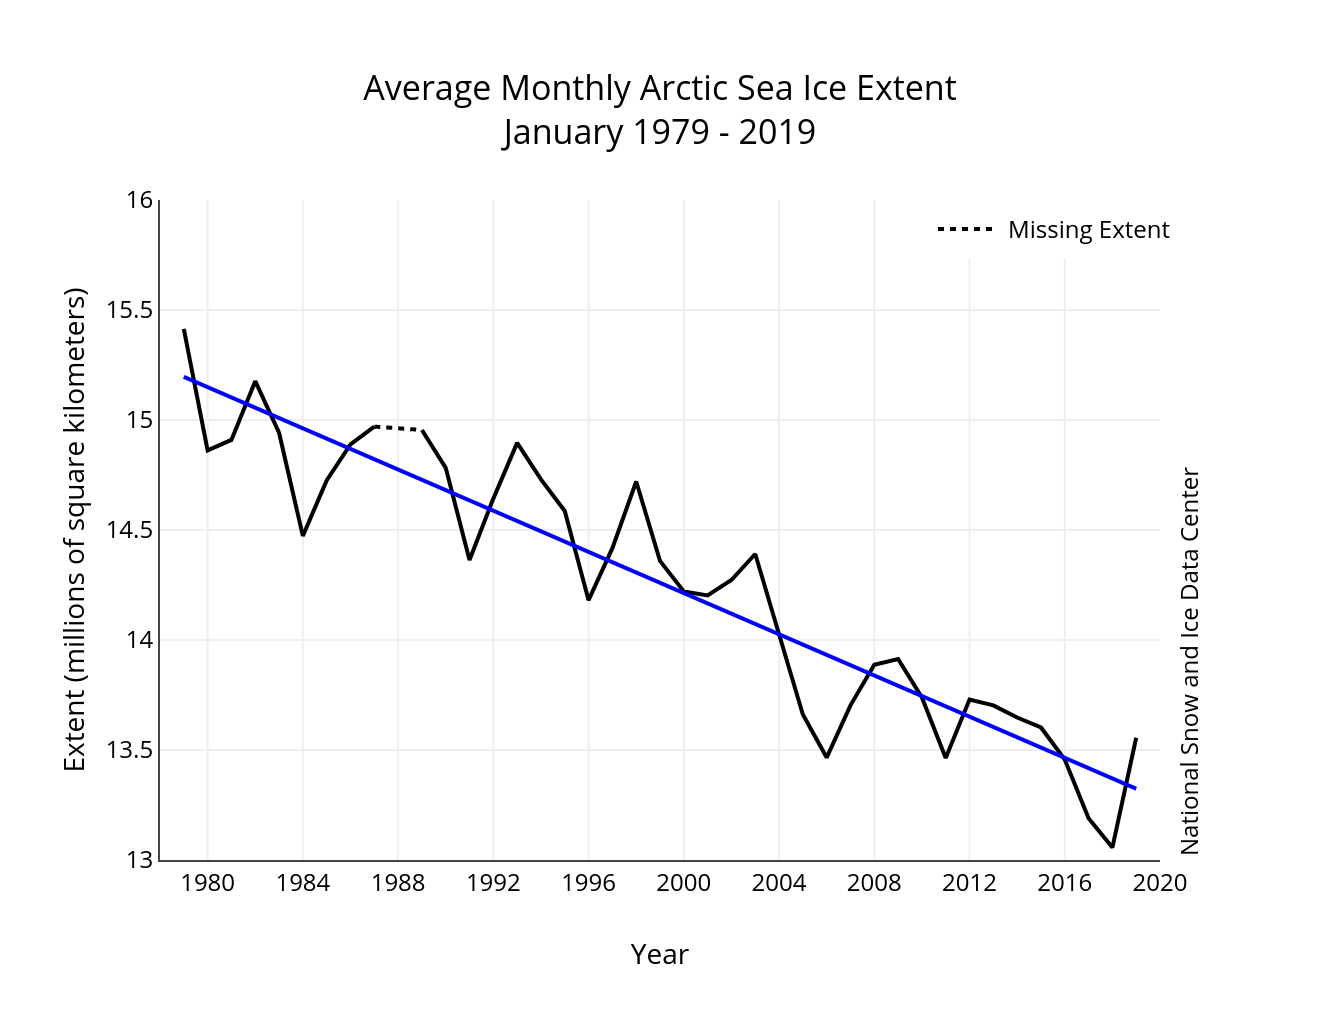
Figure 3. Monthly May ice extent for 1979 to 2019 shows a decline of 2.74 percent per decade.
Credit: National Snow and Ice Data Center
High-resolution image
Overall, sea ice extent during May 2019 decreased by 1.49 million square kilometers (575,300 square miles). This was fairly close to the 1981 to 2010 average loss for the month. The linear rate of sea ice decline for May from 1979 to 2019 is 36,400 square kilometers (14,100 square miles) per year, or 2.74 percent per decade relative to the 1981 to 2010 average.
Ice arch break up in the Lincoln Sea
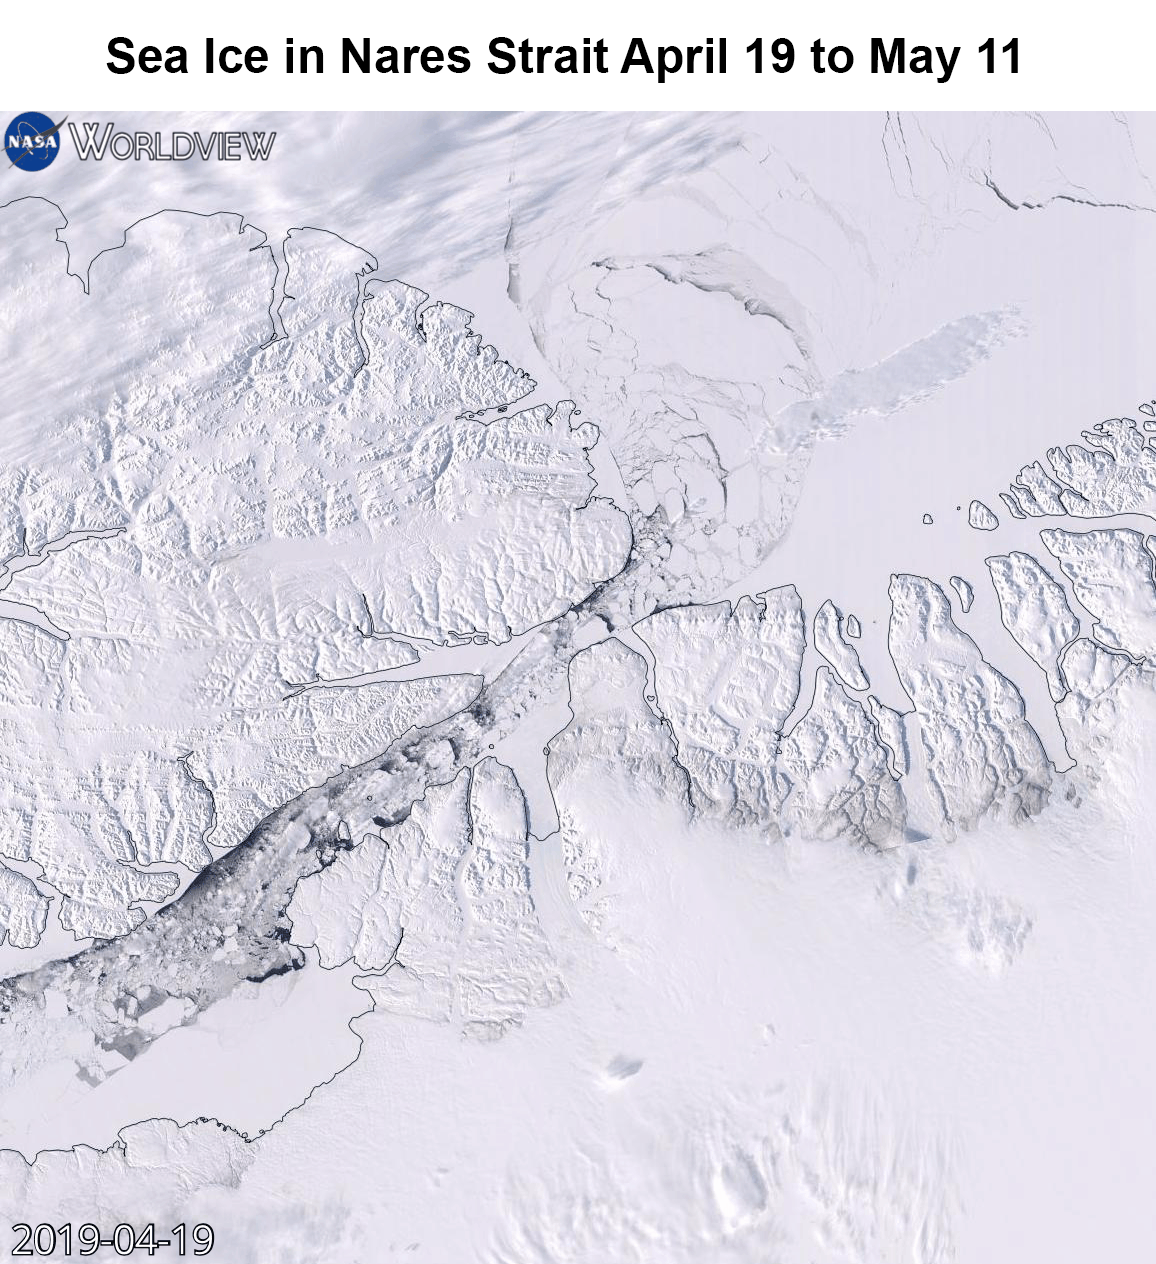
Figure 4. This NASA Worldview (download to view animation) image shows sea ice in the Nares Strait from April 19 to May 11. A new Worldview functions creates an animation using Aqua Moderate Imaging Spectroradiometer (MODIS) true color composite images.
Credit: NASA
High-resolution image
In most years (2007 being a notable exception), an ice arch forms during late autumn and winter at the north end of Nares Strait, the narrow passage that separates Greenland from Ellesmere Island. This arch acts as a barrier, preventing ice from the Arctic Ocean from drifting through the strait and into Baffin Bay. The arch typically breaks up in June or July, allowing ice to drift through the narrow channel. This year, the arch broke up by late March, much earlier than is typical. Since then, there has been a steady flow of ice through Nares Strait (download animation to view). Since 2000, only four other years appear to have had similar early breakups of the arch: 2007 (when no arch formed at all), 2008, 2010, and 2017 (Moore et al., 2018). Typically, strong wind events trigger the break up, but warm temperatures and thinner ice can also contribute.
Arctic sea ice variability linked to atmospheric temperature fluctuations
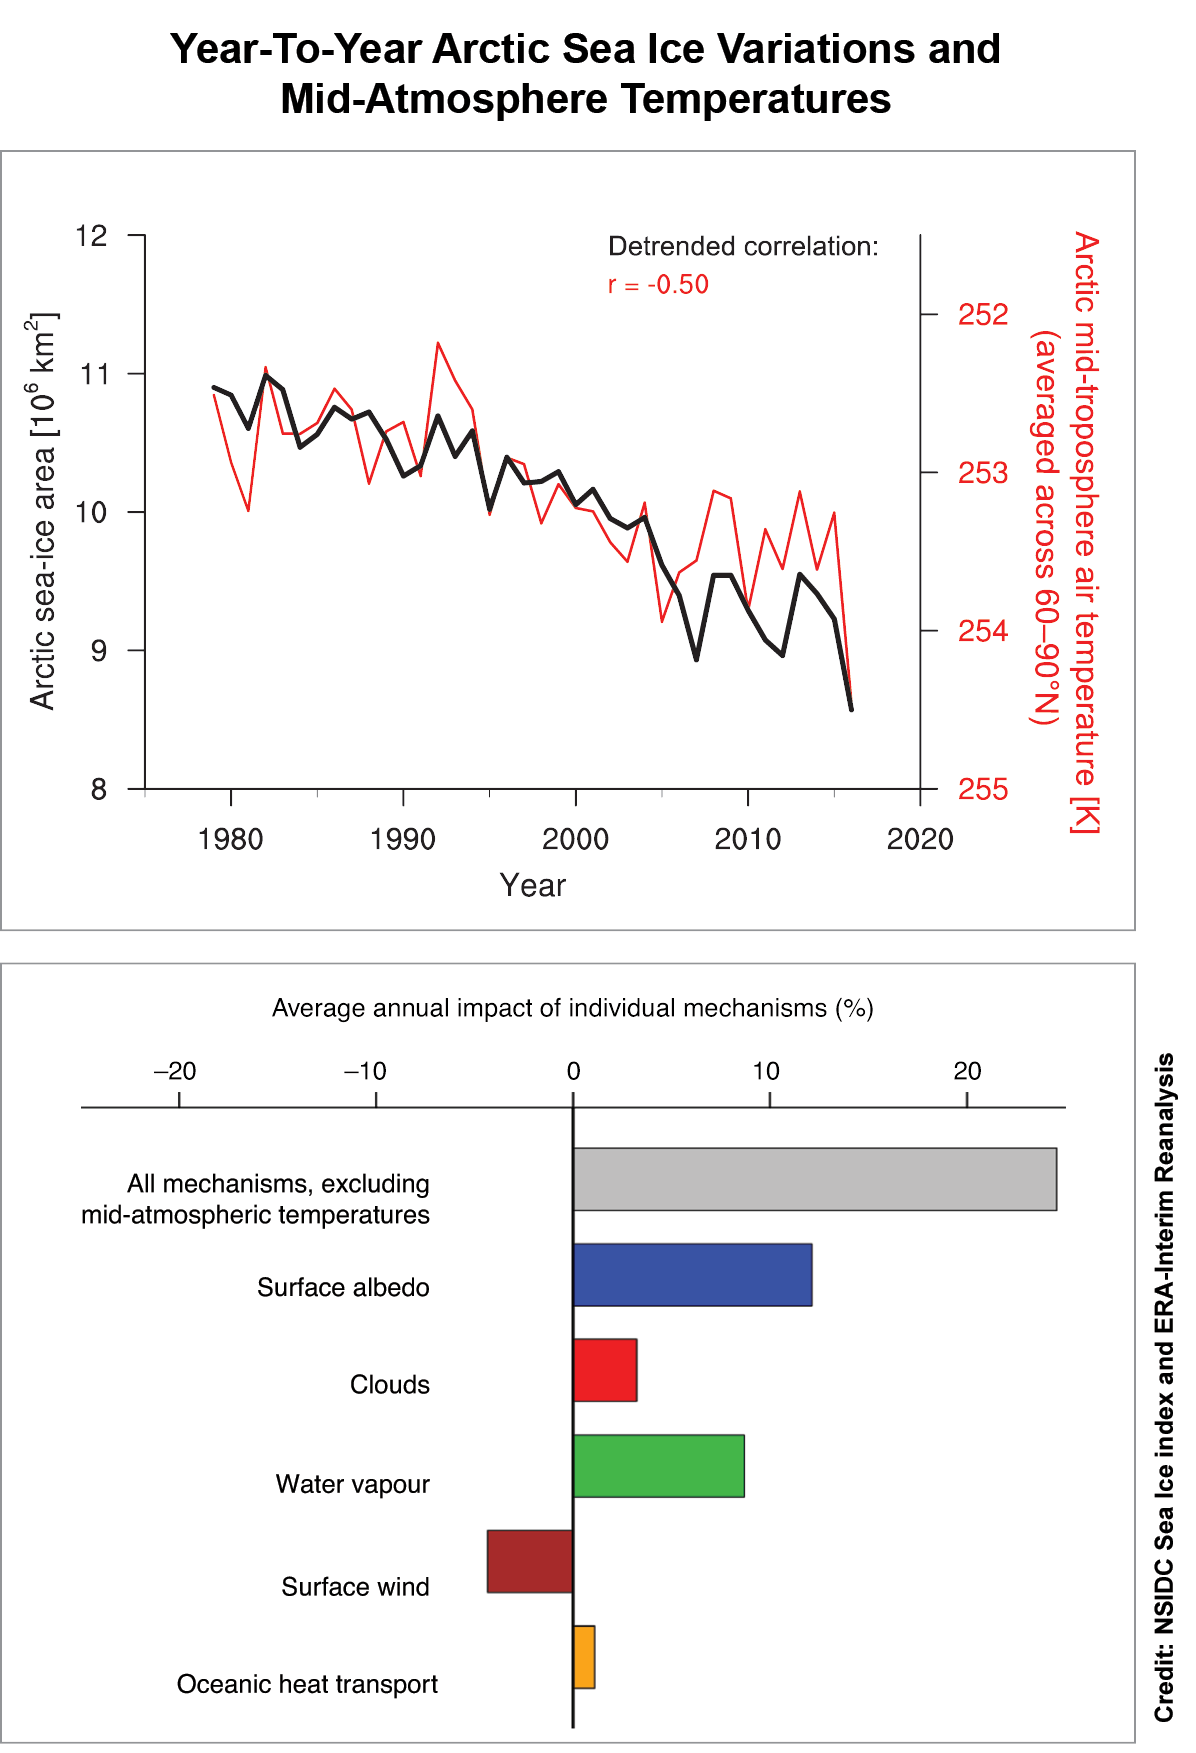
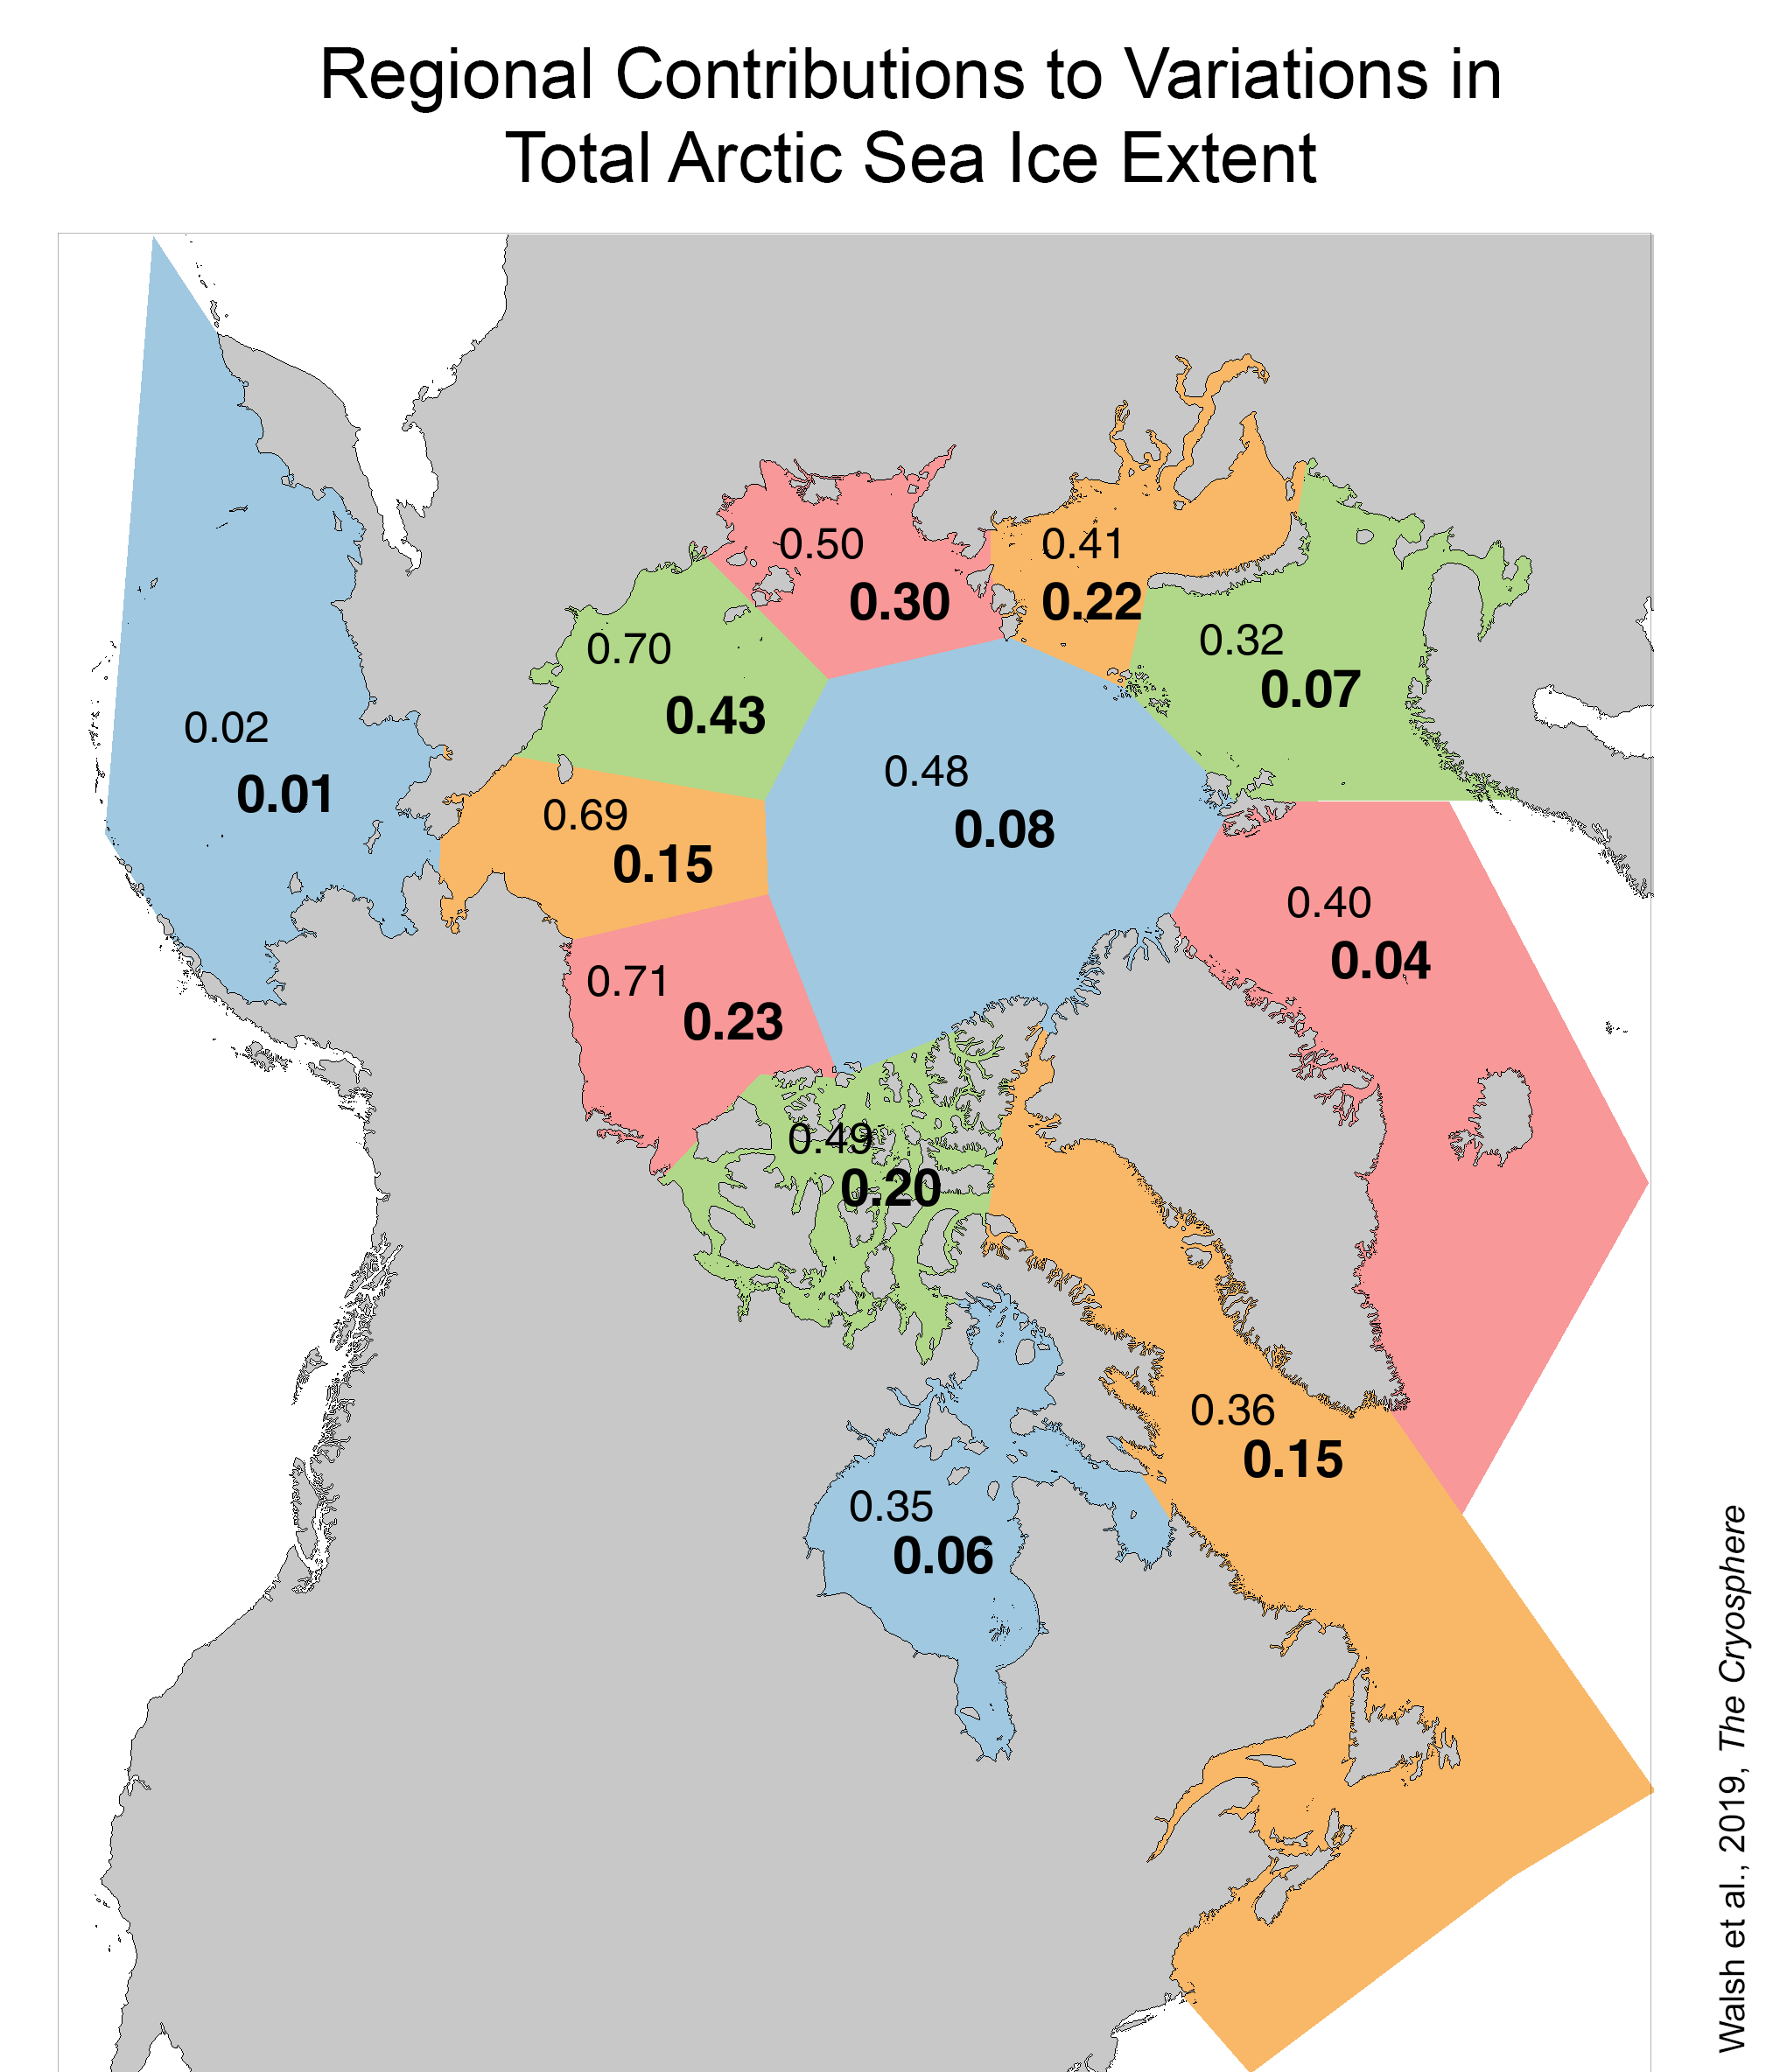
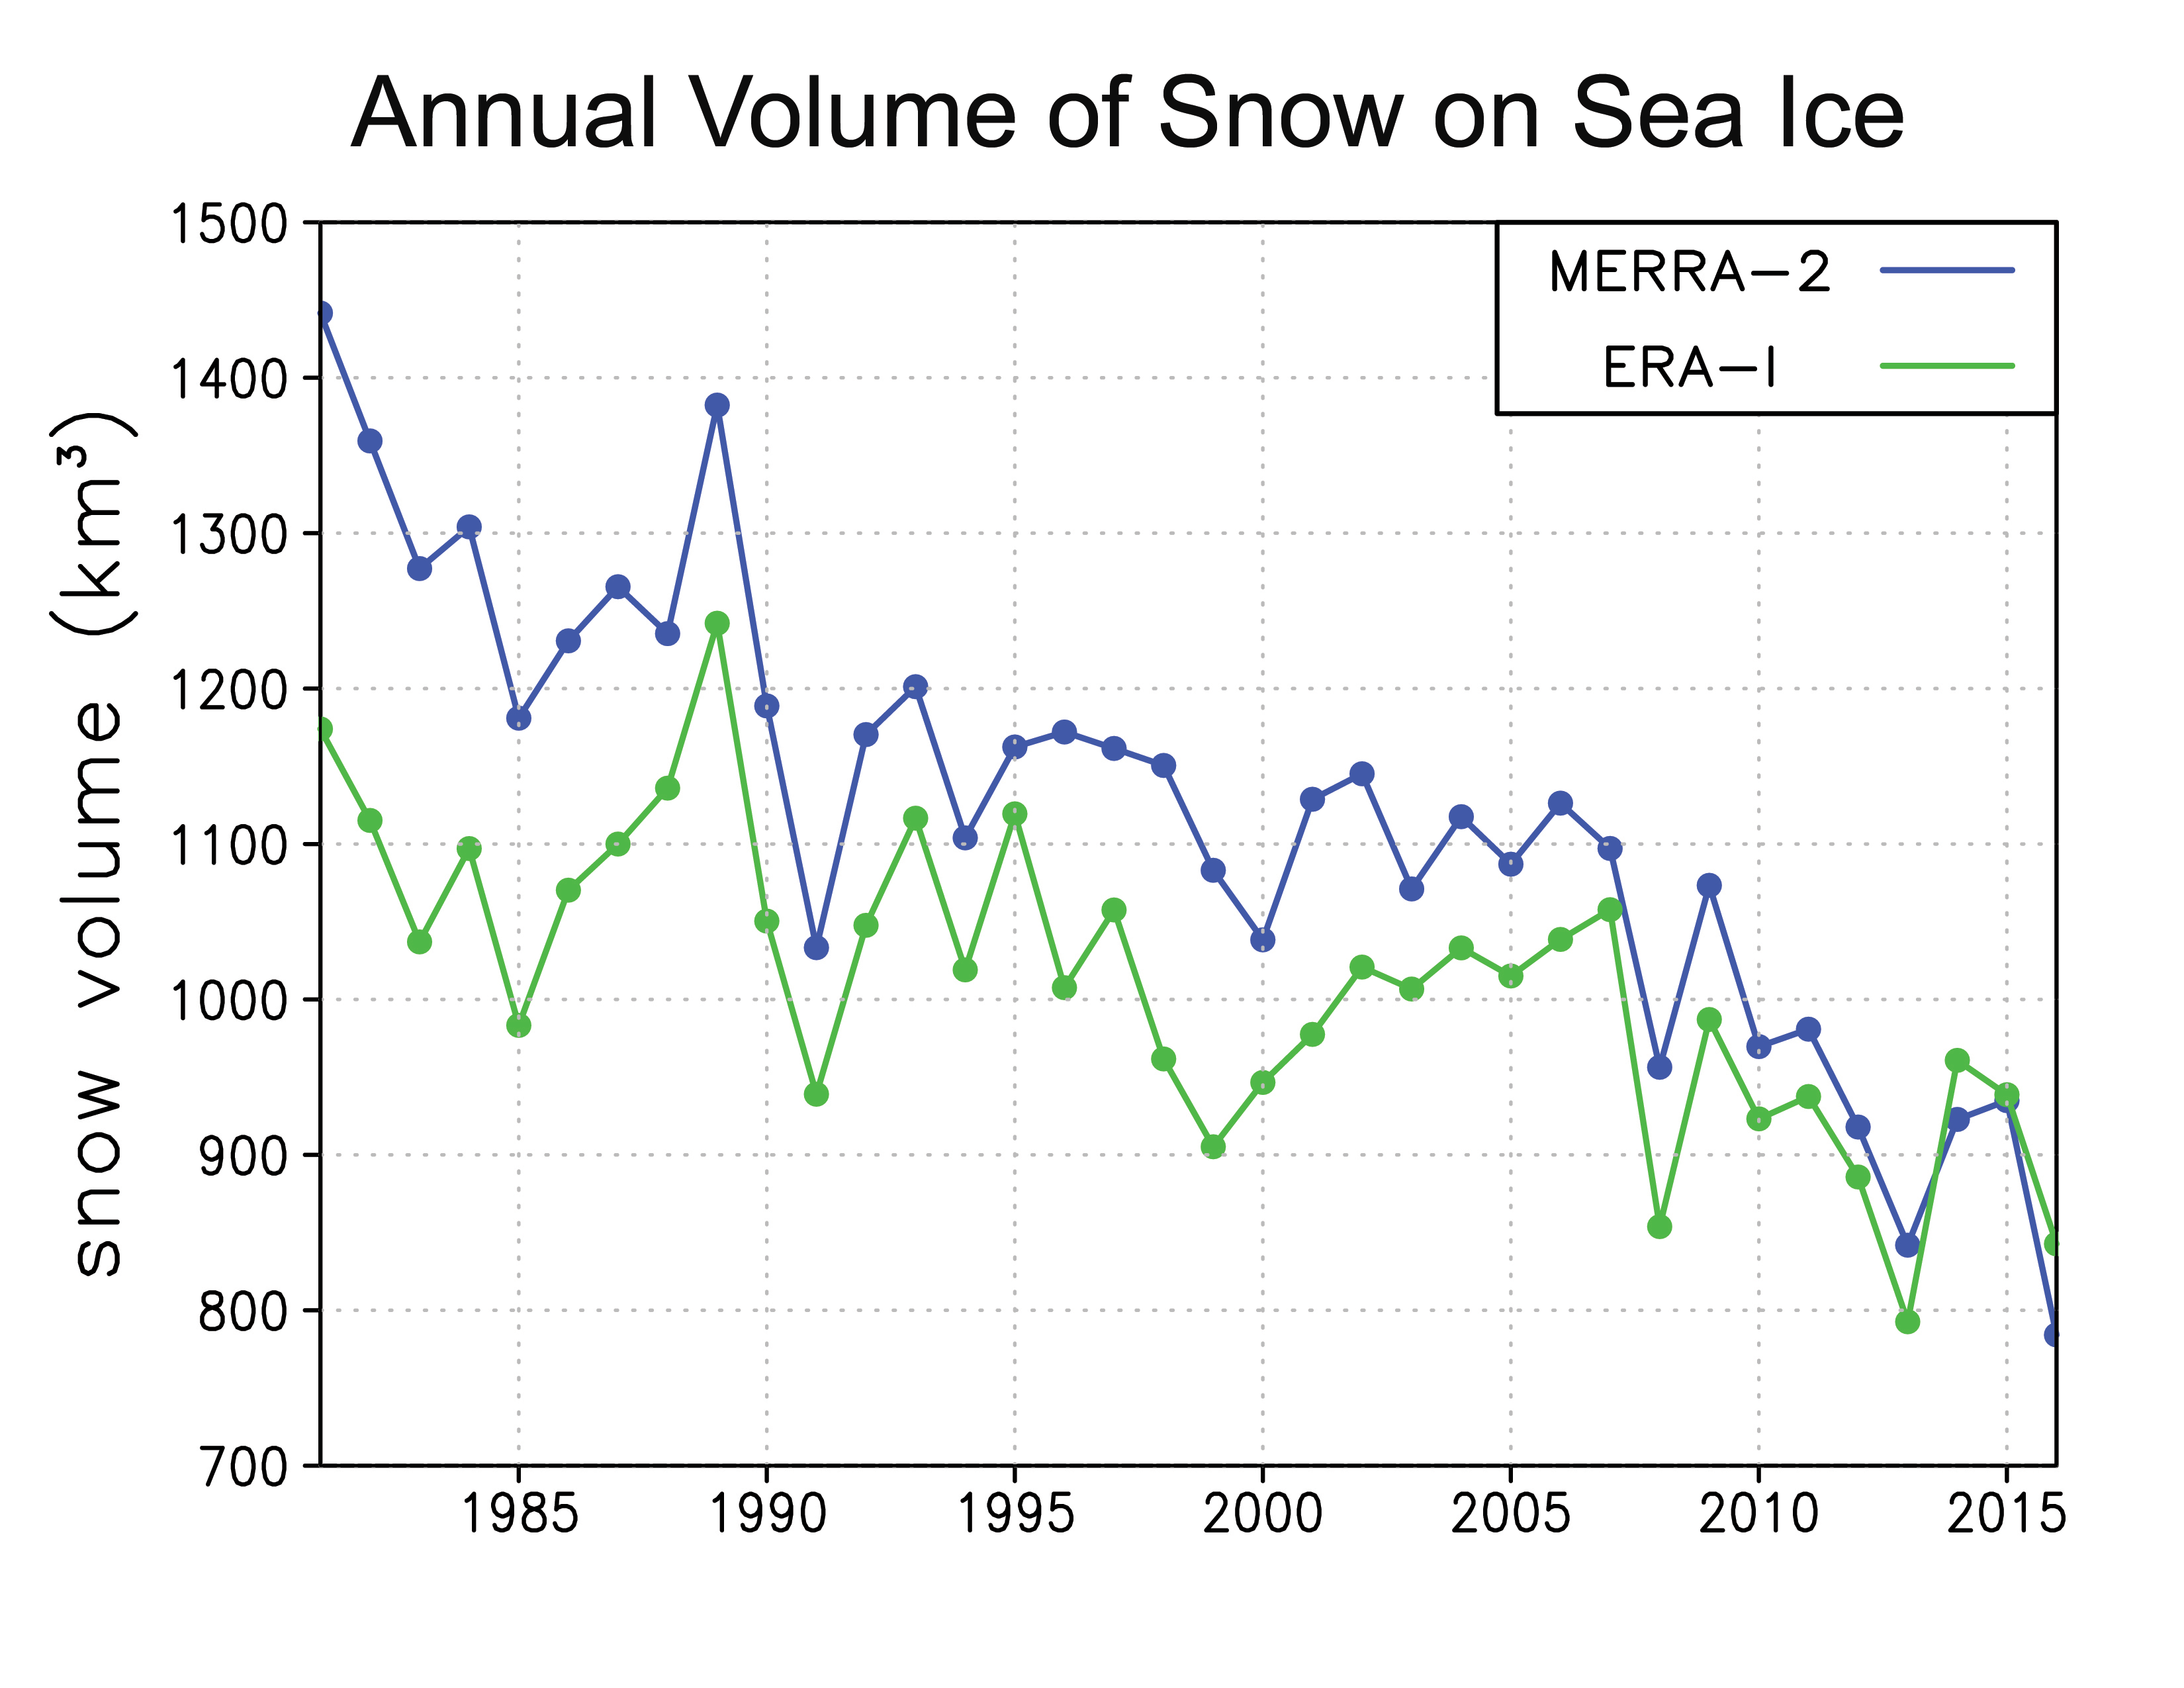
Figure 5. The top figure shows how the year-to-year sea ice area co-varies with mid-atmosphere temperatures (average of temperatures between 850 HPa to 400 HPa, or about 5,000 to 25,000 feet above sea level). The below bar graph provides the contributions of other suggested mechanisms. Combined, they account for about 25 percent of the sea ice variations. The direct influence of mid-atmosphere temperature fluctuations remains as the primary cause of year-to-year sea-ice variations.
Credit: NSIDC Sea Ice Index and ERA-Interim Reanalysis
High-resolution image
While Arctic sea ice extent is declining sharply, it is also highly variable from one year to the next. Scientists from the Max Planck Institute for Meteorology (MPI-M) and the University of Stockholm have proposed that this strong variability is closely related to fluctuations in the air temperature above the Arctic Ocean driven by atmospheric heat transport into the Arctic from lower latitudes. In contrast to previous assumptions, they argue that other factors, such as the ice-albedo feedback, cloud and water vapor feedbacks, and oceanic heat transported into the Arctic together explain only 25 percent of the year-to-year sea ice extent variations. Most of the sea ice variations are thus directly caused by mid-atmospheric temperature conditions; this is evident in both observational data and climate models. Their study implies that year-to-year fluctuations in sea ice extent are easier to understand than previously thought. However, their study also suggests that it may be more difficult to predict the summer extent of Arctic sea ice from one year to the next, because the problem of predicting atmospheric heat transport is closely related to the challenges of long-term weather forecasting.
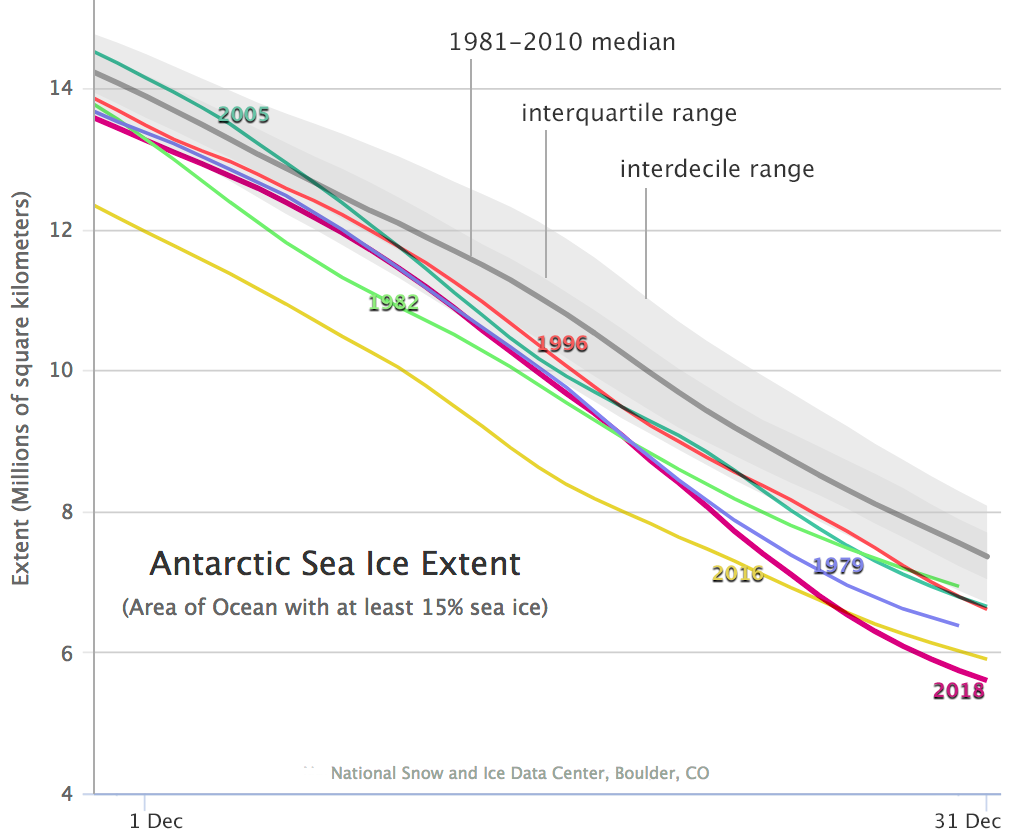
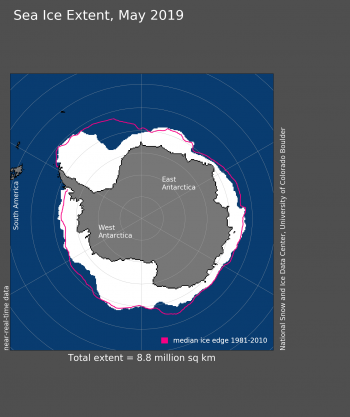
Antarctic sea ice extent exceptionally low in the Weddell and Amundsen Seas

Figure 6. Antarctic sea ice extent for May 2019 was 8.80 million square kilometers (3.40 million square miles). The magenta line shows the 1981 to 2010 average extent for that month. Sea Ice Index data. About the data
Credit: National Snow and Ice Data Center
High-resolution image
Antarctic sea ice extent continues to climb toward its seasonal maximum, which is expected in late September or early October. At the end of May, Antarctic sea ice extent was very close to record daily lows over the period of satellite observations, previously set for the month in 1980. Unusually low ice extent in the eastern Weddell Sea and northern Amundsen Sea are responsible for the low overall total extent, with smaller areas of open water in the eastern Wilkes Land coastal region and southwestern Indian Ocean (Cosmonaut Sea). Slightly above average sea ice extent is present in the north-central Ross Sea and northwestern Weddell Sea.
References
Kwok, R., L. Toudal Pedersen, P. Gudmandsen, and S. S. Pang. 2010. Large sea ice outflow into the Nares Strait in 2007. Geophysical Research Letters. doi: 10.1029/2009GL041872.
Moore, G. W. K. and K. McNeil. 2018. The early collapse of the 2017 Lincoln Sea ice arch in response to anomalous sea ice and wind forcing. Geophysical Research Letters. doi:10.1029/2018GL078428.
Olonscheck, D., T. Mauritsen, and D. Notz. 2019. Arctic sea-ice variability is primarily driven by atmospheric temperature fluctuations. Nature Geoscience. doi:10.1038/s41561-019-0363-1.


