Arctic sea ice began its autumn regrowth in the last 12 days of September, with the ice edge expanding along a broad front in the western Arctic Ocean. Overall, the summer of 2019 was exceptionally warm, with repeated pulses of very warm air from northern Siberia and the Bering Strait.
Overview of conditions
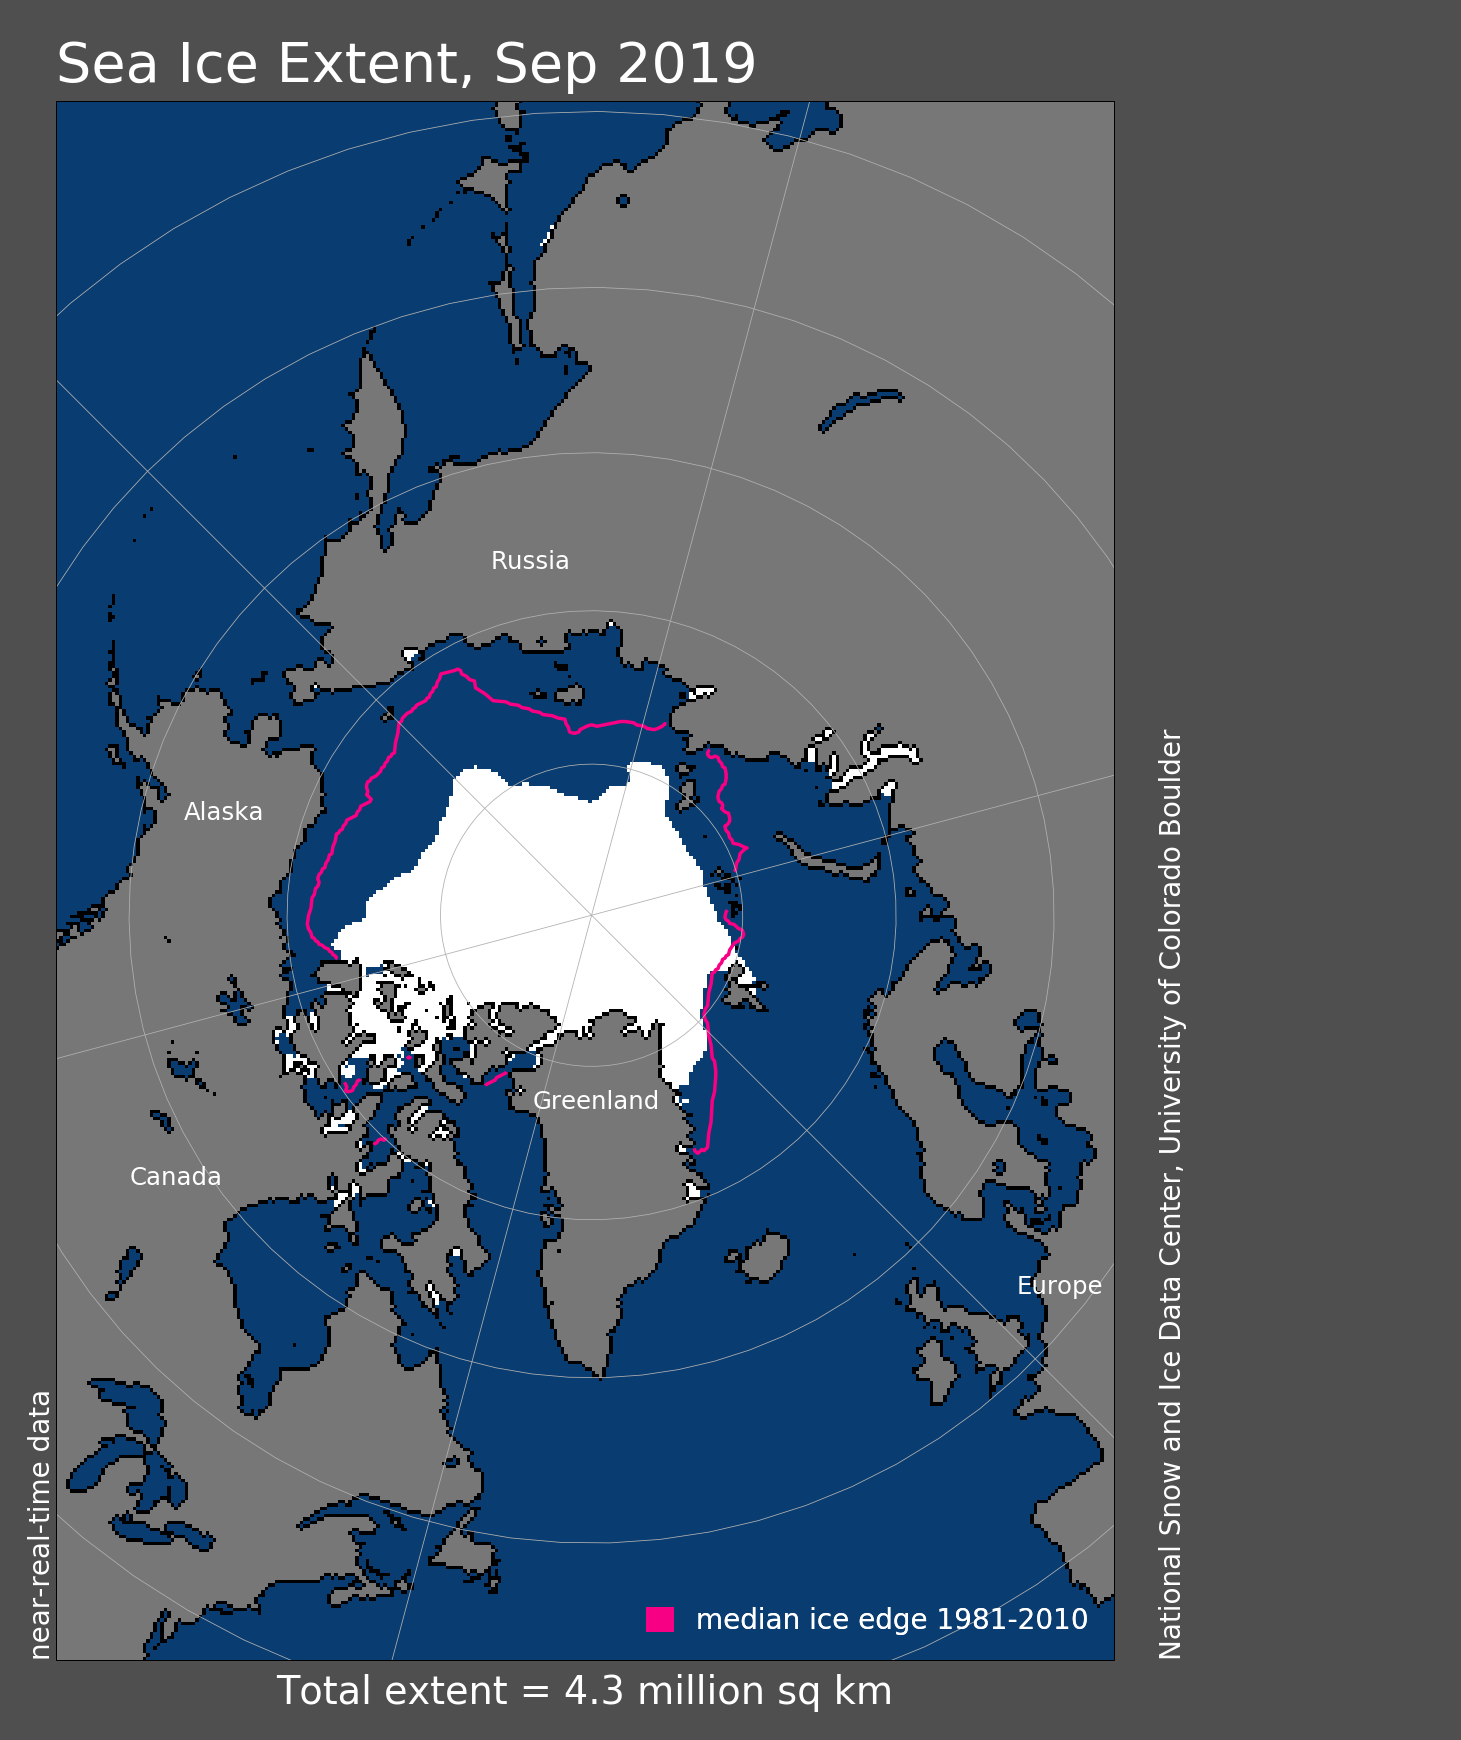
Figure 1a. Arctic sea ice extent for September 2019 was 4.32 million square kilometers (1.67 million square miles). The magenta line shows the 1981 to 2010 average extent for that month. Sea Ice Index data. About the data
Credit: National Snow and Ice Data Center
High-resolution image
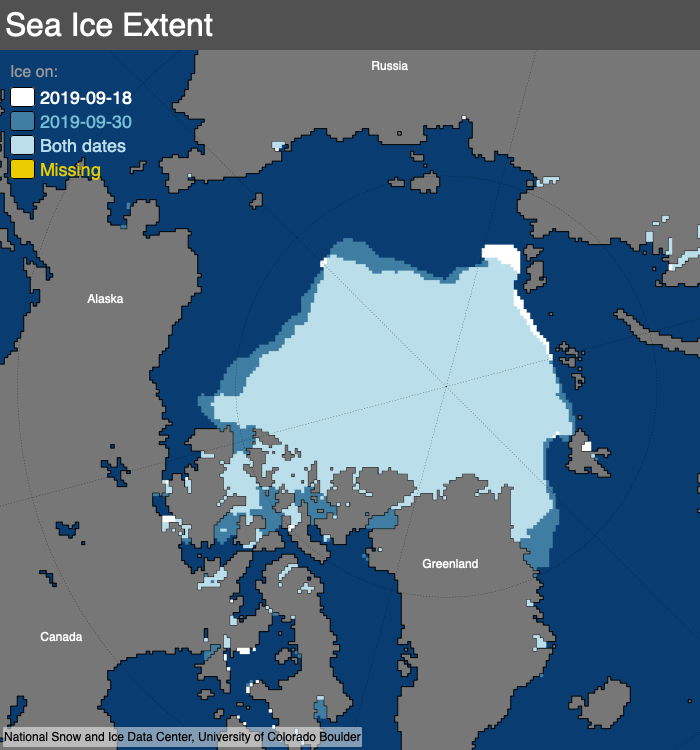
Figure 1b. This map compares sea ice extent between September 18 (white) and September 30 (dark blue), showing areas of retreat and expansion.
Credit NSIDC
High-resolution image
Arctic sea ice extent for September averaged 4.32 million square kilometers (1.67 million square miles), the third lowest in the 41-year continuous satellite record, behind 2012 and 2007. This is 750,000 square kilometers (290,000 square miles) above the record low set in September 2012, and 2.09 million square kilometers (807,000 square miles) below the 1981 to 2010 average. Following the minimum seasonal extent, which occurred on September 18 and tied for second lowest in the satellite record, rapid growth ensued along the ice edge in the northern Beaufort, Chukchi, East Siberian, and eastern Laptev Seas (Figure 1b). Winds from the south caused a small area of continued ice retreat in the western Laptev and Kara Seas, offsetting some of the ice expansion. There was also growth in the Canadian Archipelago and offshore northwest of Greenland, with some expansion caused by drift to the northeast of Greenland. The Northern Sea Route appeared to still be open at the end of September.
Conditions in context
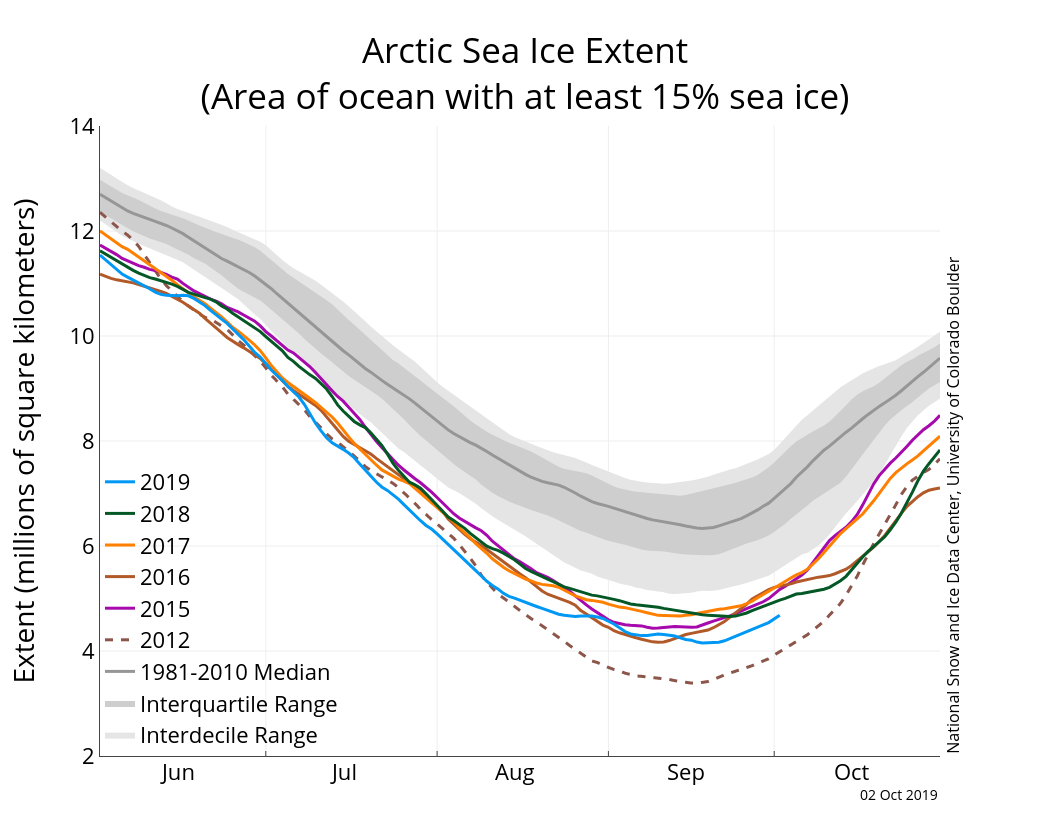
Figure 2a. The graph above shows Arctic sea ice extent as of October 2, 2019, along with daily ice extent data for four previous years and the record low year. 2019 is shown in blue, 2018 in green, 2017 in orange, 2016 in brown, 2015 in purple, and 2012 in dotted brown. The 1981 to 2010 median is in dark gray. The gray areas around the median line show the interquartile and interdecile ranges of the data. Sea Ice Index data.
Credit: National Snow and Ice Data Center
High-resolution image
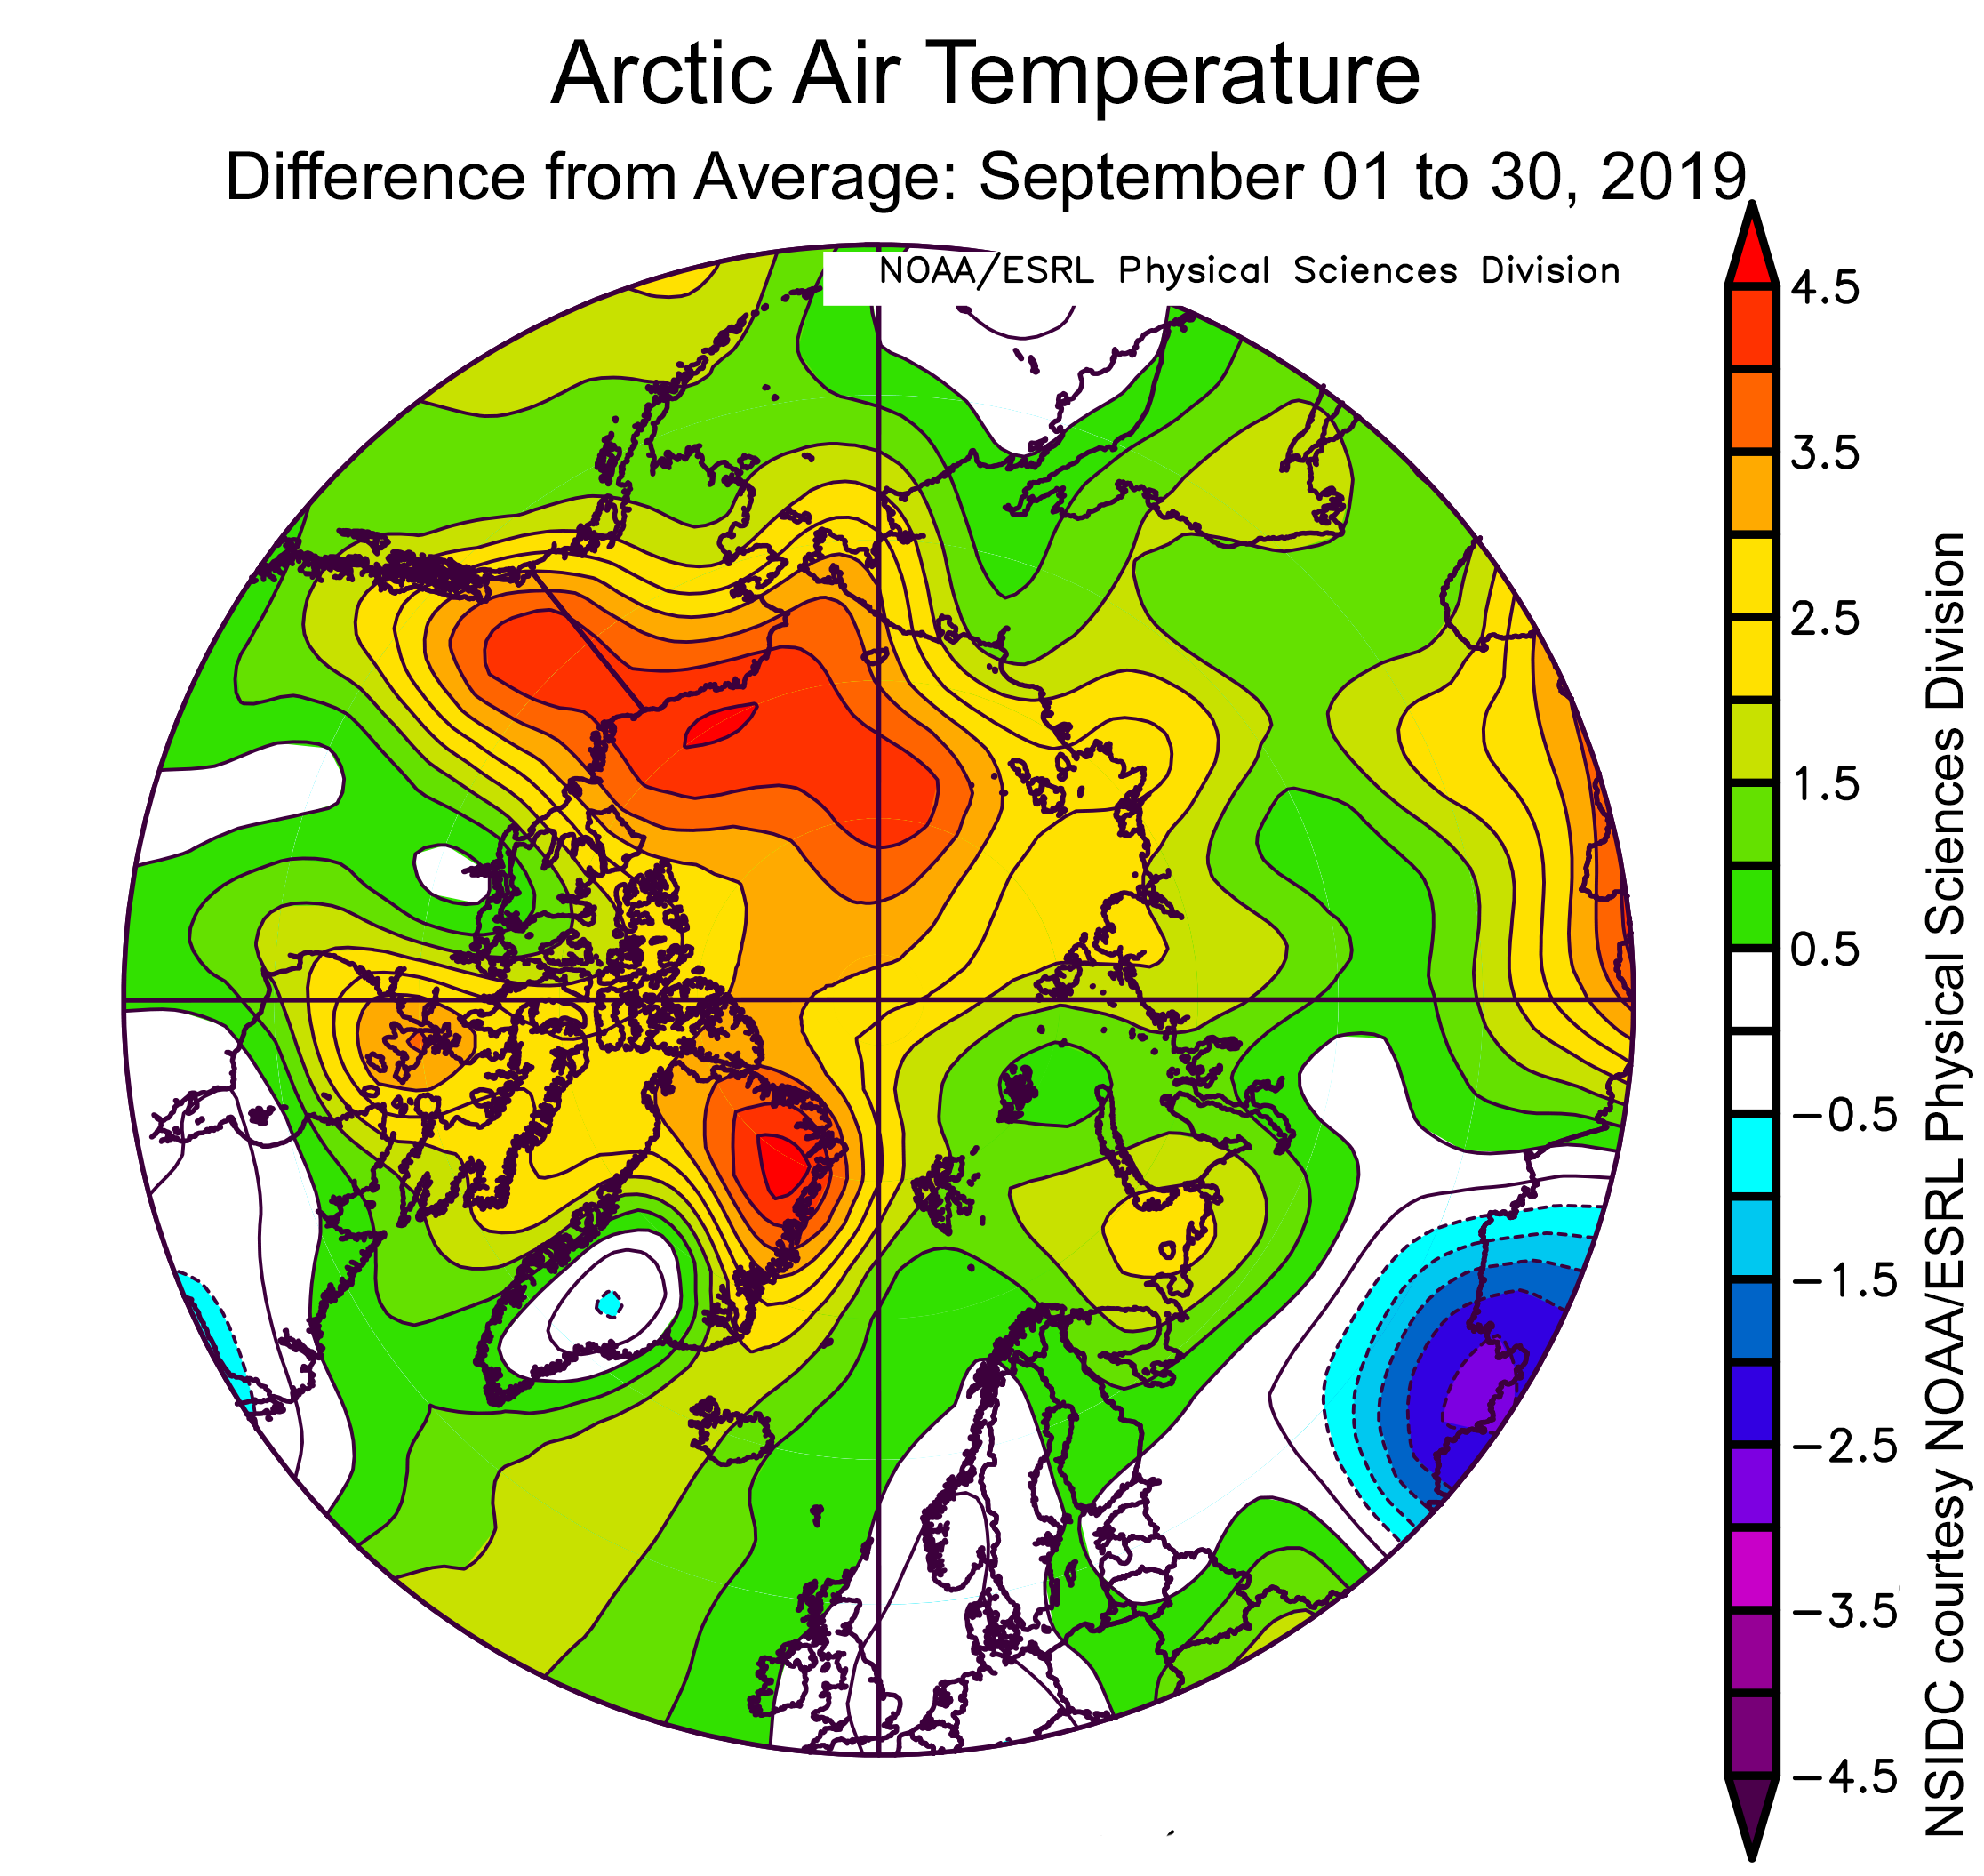
Figure 2b. This plot shows the departure from average air temperature in the Arctic at the 925 hPa level, in degrees Celsius, for September 01 to 30, 2019. Yellows and reds indicate higher than average temperatures; blues and purples indicate lower than average temperatures.
Credit: NSIDC courtesy NOAA Earth System Research Laboratory Physical Sciences Division
High-resolution image
Warm conditions marked September over the entire Arctic Ocean and its surrounding lands. Air temperatures at the 925 millibar level (about 2,500 feet above sea level) for the month were 2 to 4 degrees Celsius (4 to 7 degrees Fahrenheit) above the 1981 to 2010 reference period over the ocean region, reaching 4 degrees Celsius (7 degrees Fahrenheit) above average over the Beaufort Sea north of Alaska (Figure 2b). The surrounding Eurasian high-latitude areas experienced temperatures 1 to 2 degrees Celsius (2 to 4 degrees Fahrenheit) above the reference period average. Northern Canada and Alaska were also warm, at 1 to 4 degrees Celsius (2 to 7 degrees Fahrenheit) above average, with very warm conditions over the Yukon and eastern Alaska, which experienced temperatures 4 degrees Celsius (7 degrees Fahrenheit) above average. Only southern Greenland experienced below-average temperatures, around 1 degree Celsius (2 degrees Fahrenheit) below the 1981 to 2010 period.
The pace of sea ice growth in late September was about average for the post-minimum period. Sea ice expanded at a rate of about 35,000 square kilometers (13,500 square miles) per day. More rapid growth is typical of October when air temperatures fall.
September 2019 compared to previous years
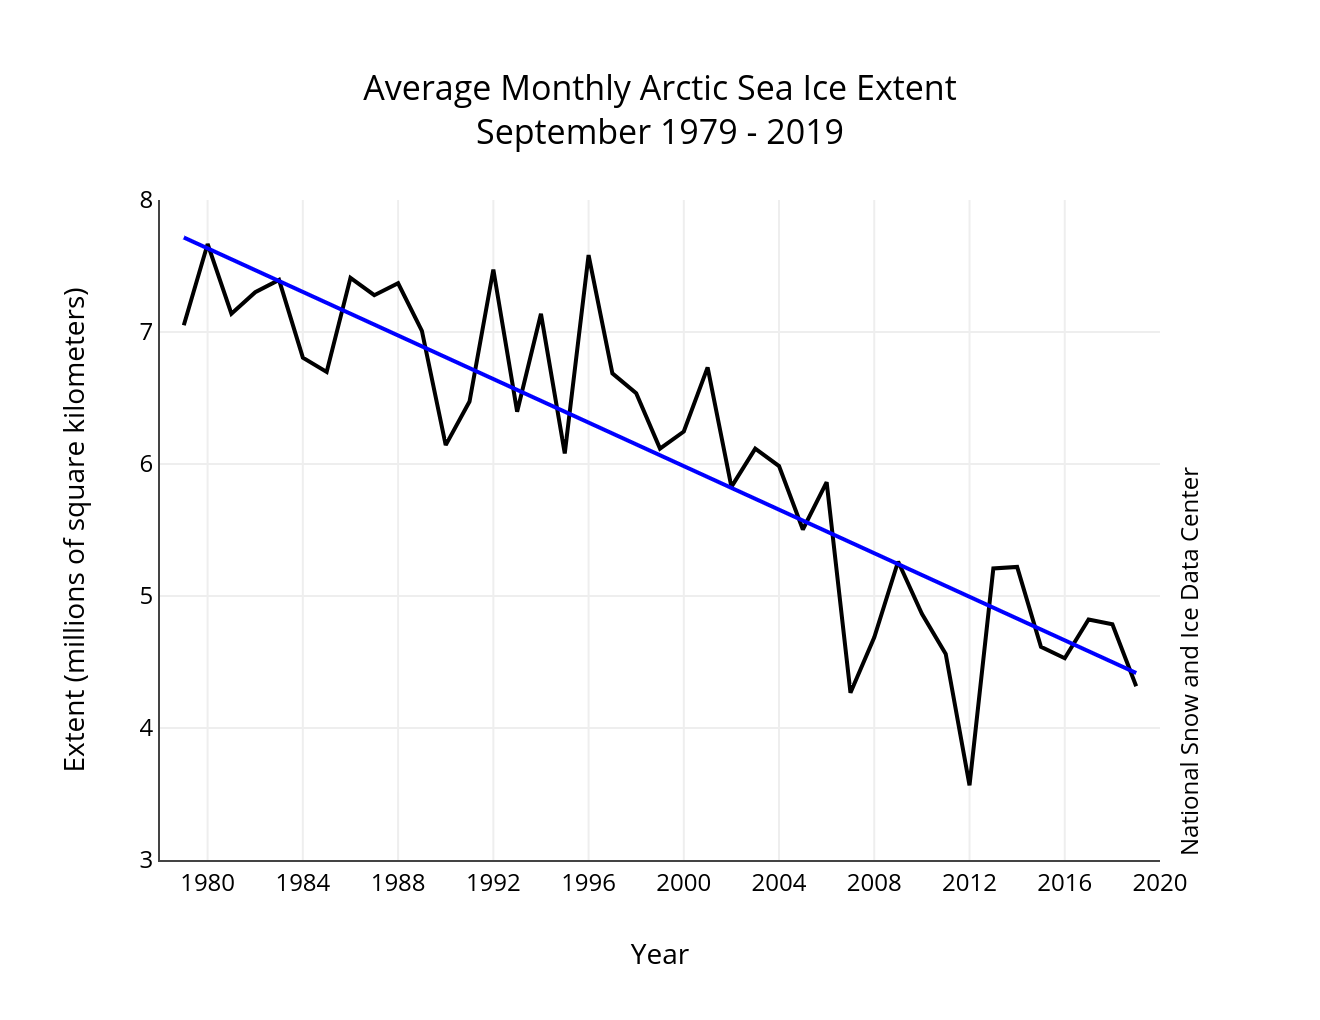
Figure 3a. Monthly September ice extent for 1979 to 2019 shows a decline of 12.9 percent per decade.
Credit: National Snow and Ice Data Center
High-resolution image
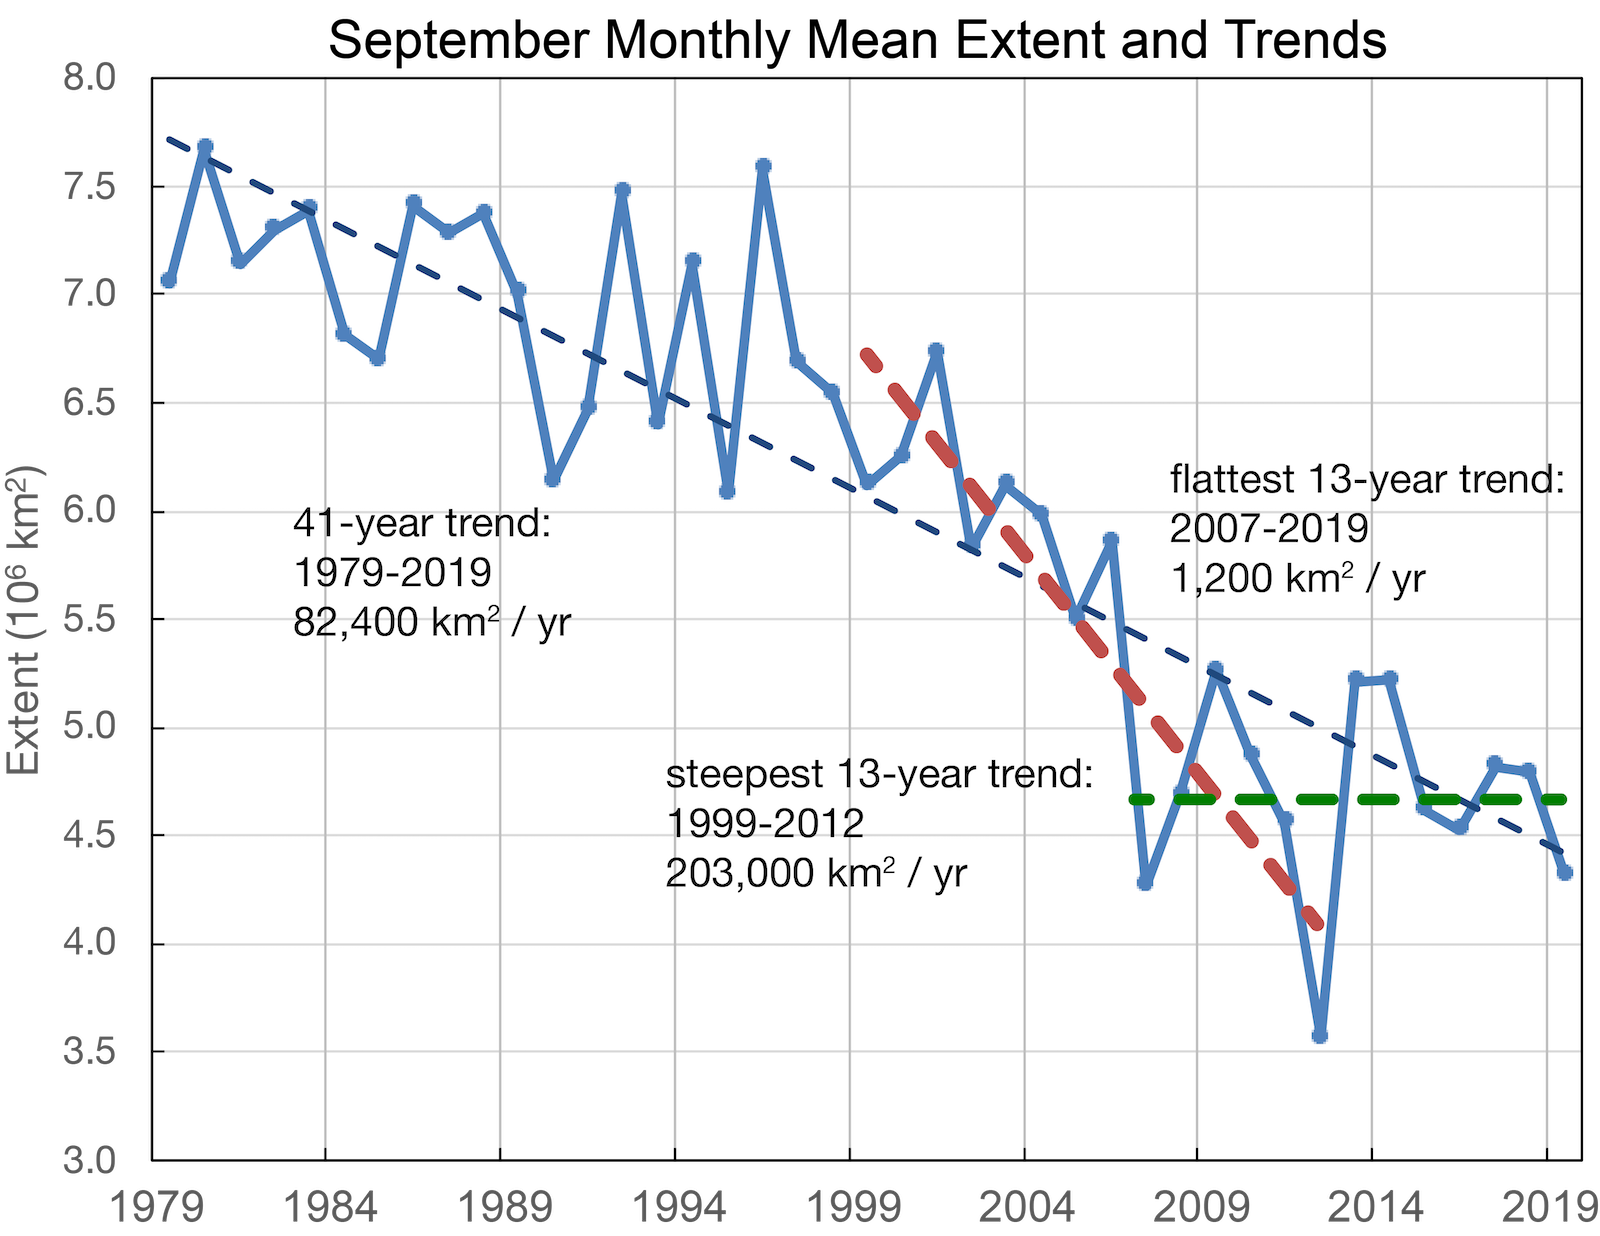
Figure 3b. September monthly mean trends for 1979-2019, showing overall trend and trends for the most recent 13 years, and the steepest 13 years in the 41-year record.
W. Meier, NSIDC
High-resolution image

Figure 3c. This animation shows Arctic sea ice decline from 1979 to 2019 from pink to purple, with dark purple in 2019. This animation is based on the Chartic Interactive Sea Ice Graph.
Credit: M. Scott, NSIDC
High-resolution image
Since sea ice extent typically falls during the first half of September and then rises, the overall monthly rate of change in not especially informative. However, in the interests of completeness, sea ice extent during September 2019 decreased by 80,000 square kilometers (31,000 square miles) over the month. By contrast, September extent increased by 130,000 square kilometers (50,200 square miles) during the 1981 to 2010 average. The linear rate of sea ice decline for September extent from 1979 to 2019 is 82,400 square kilometers (31,800 square miles) per year, or 12.9 percent per decade relative to the 1981 to 2010 average.
Within the overall decline, it is notable that the most recent 13 years, from 2007 to 2019, have shown very little decline (Figure 3b). Both 2007 and 2012 were extreme low extent years, and variability has been high in this period. However, an earlier 13 year period, 1999 to 2012, shows a rate of decline that is more than double the overall rate in the satellite record. This illustrates the challenge of extracting a quantitative rate of decline in a highly variable system like sea ice, and the benefits of looking at decadal, and not year-to-year variations. Our updates to our public analysis tool, Charctic now allows the user to see the decadal average trends as well as each year (Figure 3c).
A look back at the 2019 Arctic summer
Figure 4a. This graphic ranks months based on their Arctic air temperature from 1979 to 2019 at 925 hPa from the National Centers for Environmental Prediction/National Center for Atmospheric Research (NCEP/NCAR) Reanalysis for all areas north of 70 degrees N. Dark reds indicate warmest months; dark blues indicate coldest months.
Credit: Z. Labe, University of California, Irvine
High-resolution image
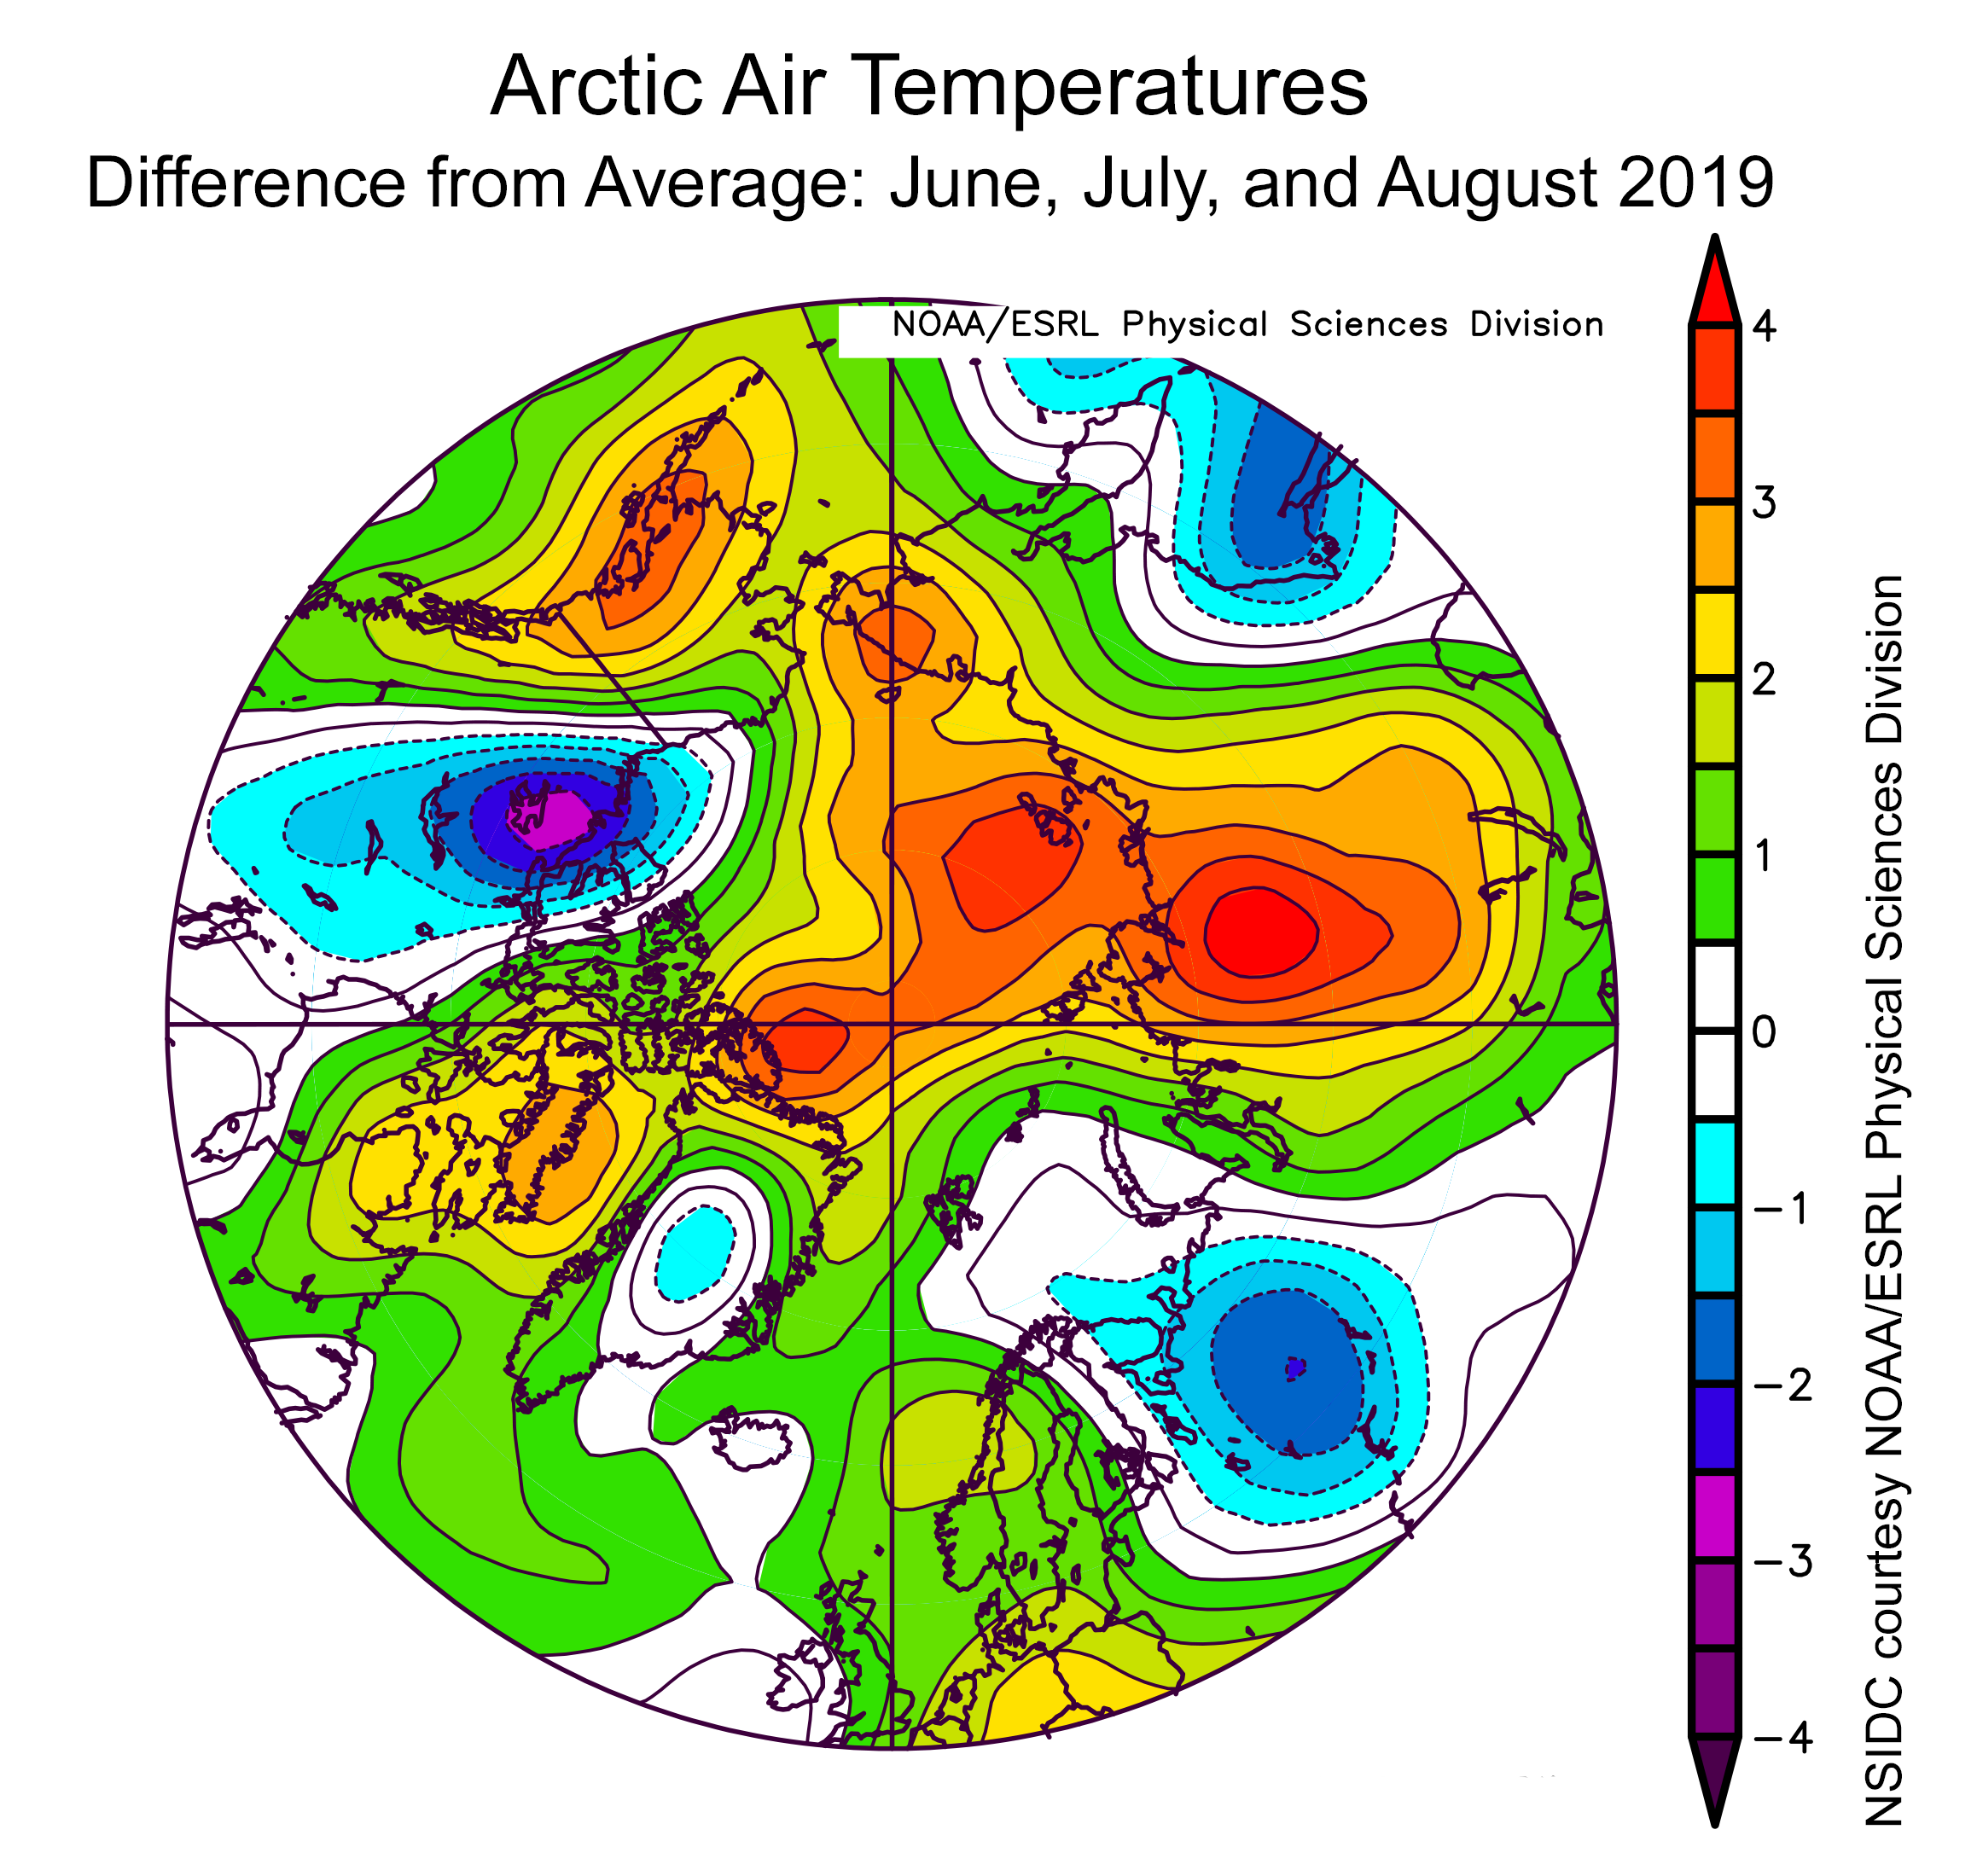
Figure 4b. This plot shows the departure from average air temperature in the Arctic at the 925 hPa level, in degrees Celsius, for June, July, and August 2019. Yellows and reds indicate higher than average temperatures; blues and purples indicate lower than average temperatures.
Credit: NSIDC courtesy NOAA Earth System Research Laboratory Physical Sciences Division
High-resolution image
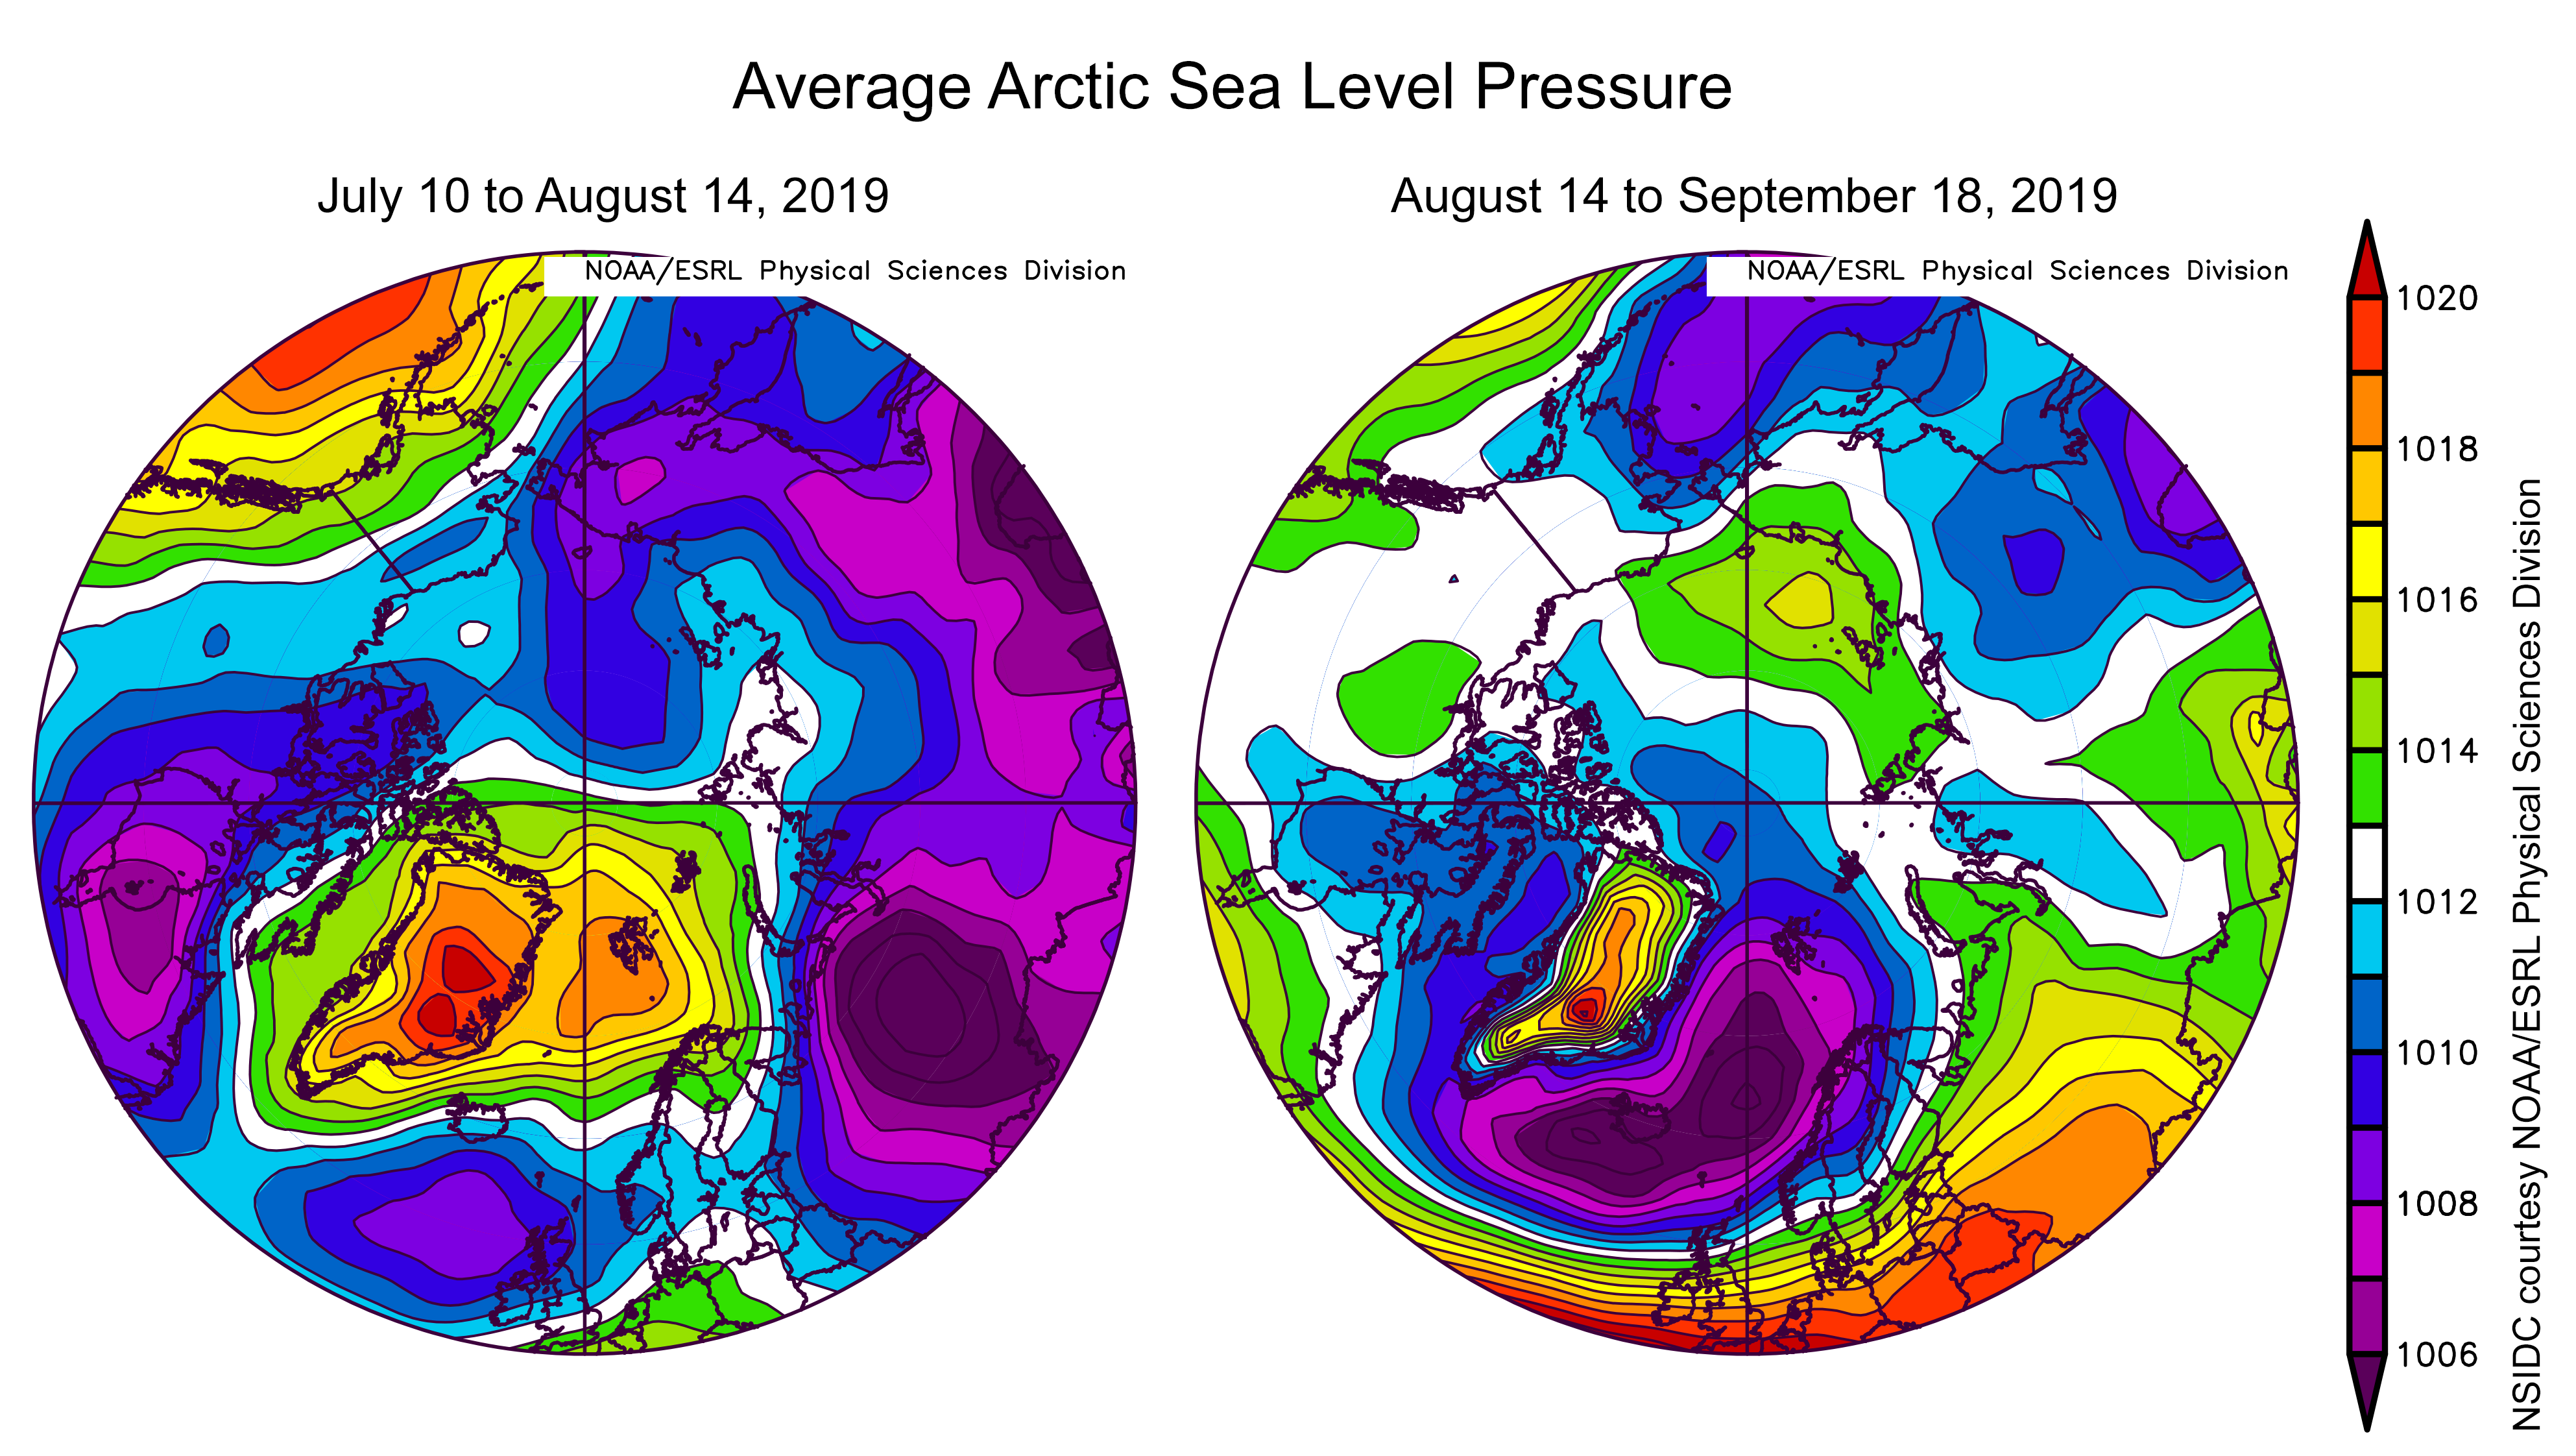
Figure 4c. This plot shows average sea level pressure (SLP) in the Arctic in millibars (hPa) for two different periods of the 2019 Arctic melt season. The left plot shows SLP average from July 10 to August 14, and the right plot shows SLP averages from August 14 to September 18. Yellows and reds indicate high air pressure; blues and purples indicate low pressure.
Credit: NSIDC courtesy NOAA Earth System Research Laboratory Physical Sciences Division
High-resolution image
Warm conditions across the Arctic Ocean, and early retreat of ice in the Chukchi and Beaufort Seas were distinguishing characteristics of the 2019 summer melt season, which followed another winter and spring with very little ice in the Bering Sea. Monthly average temperatures for the high Arctic (north of 70 degrees North latitude) show that the 2019 spring and summer months, from April to September, all ranked within the three warmest since 1979 (Figure 4a). Air temperatures at the 925hPa level over the Arctic Ocean for the period of June, July, and August were as much as 3 to 4 degrees Celsius (5 to 7 degrees Fahrenheit) above the 1981 to 2010 reference period average (Figure 4b). Similarly, warm conditions extended into central Siberia and southern Alaska.
The melt season began with little ice in the Bering Sea, which favored early losses in the southern Chukchi Sea by late May. May 2019 was the warmest May in the Arctic since 1979, with some areas seeing temperatures 6 to 7 degrees Celsius (11 to 13 degrees Fahrenheit) above average for the month. The sea ice retreat continued with a large area of open water along the coast of northern Alaskan, and initial retreat in the East Siberian Sea. Baffin Bay also lost its ice cover early, and was largely ice free by mid-July. From mid-July through August, a rapid retreat occurred along the entire western Arctic, which while typical for late summer, was more extreme than in earlier decades. However, the pace of ice loss slowed in mid-August, moving the 2019 daily sea ice extent above values for the same dates in 2012, the year that ended up with the lowest September extent in the satellite record. In September, above average temperatures persisted, but sea ice extent was largely controlled by shifting winds. The sea ice extent started to increase when ice growth exceeded the effects of compaction or regional melting from warm ocean waters.
Climatologically, the summer of 2019 was characterized by generally high pressure over Greenland and parts of the Arctic Ocean, with frequent winds from the south into the Arctic Ocean along the longitudes of Siberia and Alaska. The rate of sea ice decline in 2019 tracked the 2012 rate of decline for much of the summer, resulting in new record daily extent lows in July and early August for 2019. This fast-paced period of decline over 35 days, from July 10 to August 14, was attended by high air pressure over Greenland and the Barents Sea, driving warm air northward over Baffin Bay and into the central Arctic Ocean (Figure 4c). The slower pace of ice loss that began in mid-August through the minimum, from August 14 to September 18, was attended by sharply lower sea level pressures in this area, extending northward towards the Pole. High pressure over the East Siberian Sea coupled with this low air pressure extending from Svalbard and Greenland created an eastward wind flow on the Siberian side of the Pole that tended to disperse ice at the ice edge, slowing retreat. Declining temperatures and lower solar elevation are major factors at this time of year, highlighting how the 2012 melt season differed from average years.
Antarctic update
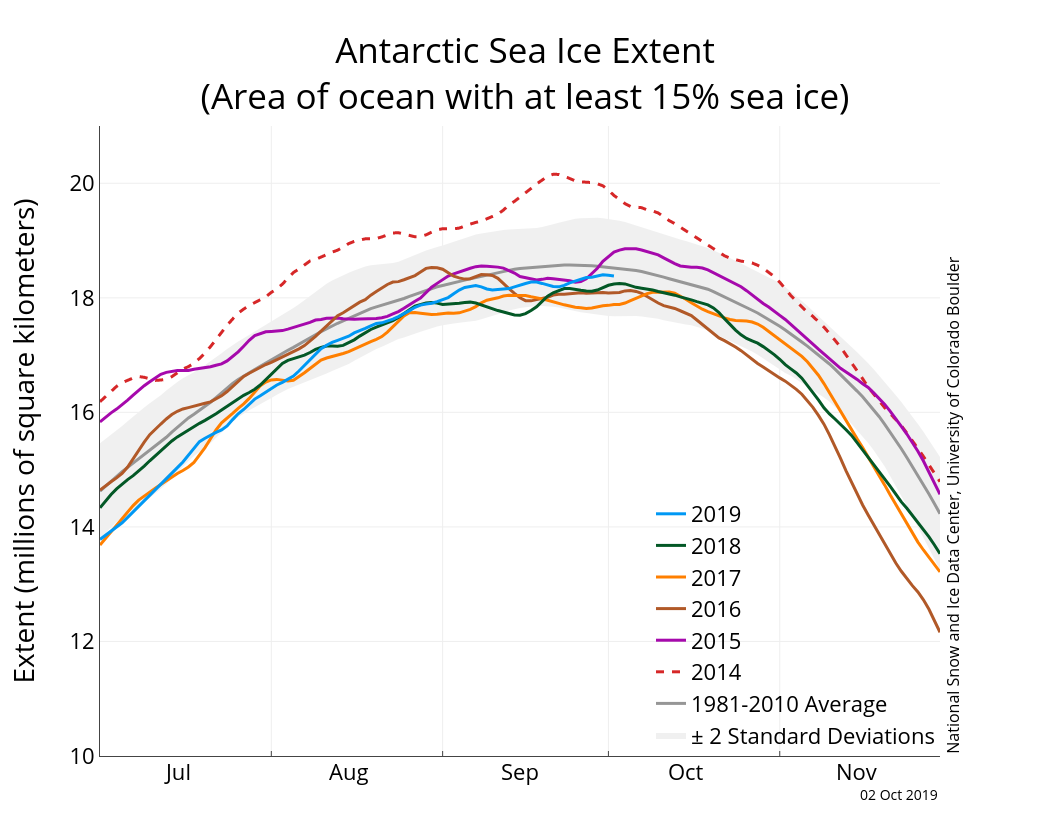
Figure 5. The graph above shows Antarctic sea ice extent as of October 2, 2019, along with daily ice extent data for four previous years and the record low and high maximum years. 2019 is shown in blue, 2018 in green, 2017 in orange, the record low maximum extent, 2016 in brown, 2015 in purple, and 2014 in dotted brown, the record high maximum extent. The 1981 to 2010 median is in dark gray. The gray areas around the median line show the interquartile and interdecile ranges of the data. Sea Ice Index data.
Credit: National Snow and Ice Data Center
High-resolution image
Antarctic sea ice is nearing its seasonal maximum for 2019, and may have reached the maximum extent on September 30 at 18.40 million square kilometers (7.10 million square miles). As of this post, sea ice extent is still only slightly below the 1981 to 2010 average, although Antarctic sea ice has tracked below the reference period continuously since September 2016. Regionally, sea ice extent is below the 1981 to 2010 average in the Amundsen, eastern Weddell, and western Wilkes Land coast, but slightly greater than average in the Cosmonaut Sea and eastern Wilkes Land areas.
Further reading
Comiso, J. C. and Gordon, A. L. 1987. Recurring polynyas over the Cosmonaut Sea and the Maud Rise. Journal of Geophysical Research: Oceans, 92(C3), pp. 2819-2833, doi: 10.1029/JC092iC03p02819.

