Arctic extent nearly matched 2012 values through the first week of July, but the rate of decline slowed during the second week. Weather patterns were unremarkable during the first half of July.
Overview of conditions
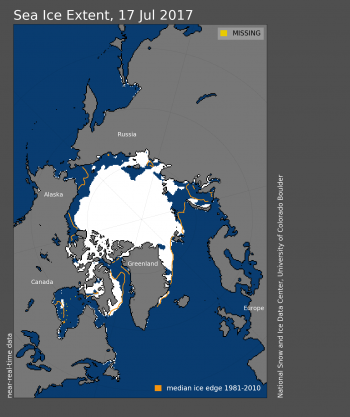
Figure 1. Arctic sea ice extent for July 17, 2017 was 7.88 million square kilometers (3.04 million square miles). The orange line shows the 1981 to 2010 average extent for that day. Sea Ice Index data. About the data
Credit: National Snow and Ice Data Center
High-resolution image
As of July 17, Arctic sea ice extent stood at 7.88 million square kilometers (3.04 million square miles). This is 1.69 million square kilometers (653,000 square miles) below the 1981 to 2010 average, and 714,000 square kilometers (276,000 million square miles) below the interdecile range. Extent was lower than average over most of the Arctic, except for the East Greenland Sea (Figure 1). Hudson Bay was nearly ice free by mid July, much earlier than is typical, but in line with what has been observed in recent years.
Conditions in context
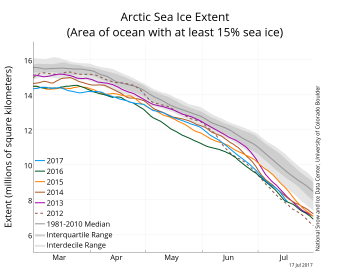
Figure 2a. The graph above shows Arctic sea ice extent as of July 17, 2017, along with daily ice extent data for five previous years. 2017 is shown in blue, 2016 in green, 2015 in orange, 2014 in brown, 2013 in purple, and 2012 as a dotted brown line. The 1981 to 2010 median is in dark gray. The gray areas around the median line show the interquartile and interdecile ranges of the data. Sea Ice Index data.
Credit: National Snow and Ice Data Center
High-resolution image
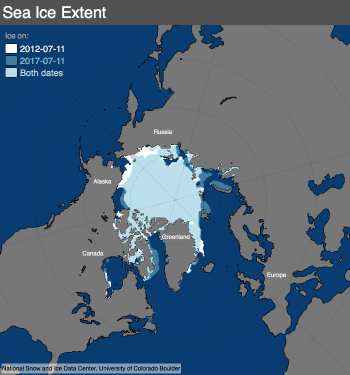
Figure 2b. This map compares sea ice extent for July 11 in 2017 and in 2012. White shows where ice occurred only in 2012, medium blue is where ice occurred only in 2017, and light blue is where ice occurred in both years.
Credit: National Snow and Ice Data Center
High-resolution image
Through the first week of July, extent closely tracked 2012 levels. The rate of decline then slowed, so that as of July 17, extent was 169,000 square kilometers (65,300 square miles) above 2012 for the same date (Figure 2a). The spatial pattern of ice extent differs from 2012, with less ice in the Chukchi and East Siberian Seas in 2017, but more in the Beaufort, Kara, and Barents Seas and in Baffin Bay (Figure 2b).
Visible imagery provides up close details
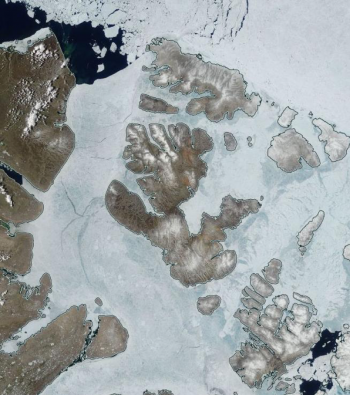
Figure 3a. This image from the NASA Moderate Resolution Imaging Spectroradiometer (MODIS) shows sea ice in the Canadian Archipelago on July 3, 2017. The blue hues indicate areas of widespread melt ponds on the surface of the ice.
Credit: Land Atmosphere Near-Real Time Capability for EOS (LANCE) System, NASA/GSFC
High-resolution image
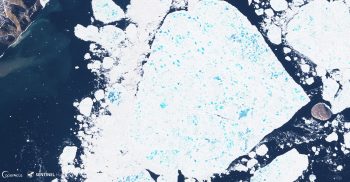
Figure 3b. The Sentinel-2 satellite captured this image of large sea ice floes in Nares Strait on July 8, 2017.
Credit: European Space Agency
High-resolution image
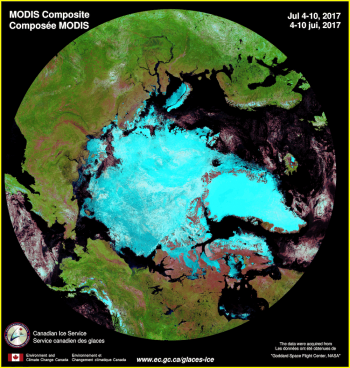
Figure 3c. This false-color composite image of the Arctic is based on NASA MODIS imagery from July 4 to 10. Most clouds are eliminated by using several images over a week, but some clouds remain, particularly over the ocean areas.
Credit: NASA/Canadian Ice Service
High-resolution image
NSIDC primarily relies on passive microwave data because it provides complete coverage—night and day, and through clouds—and because it is consistent over its long data record. However, other types of satellite data, for example visible imagery from the NASA MODIS instrument on the Aqua and Terra satellites or from the European Space Agency Sentinel 2 satellite, can sometimes provide more detail. When skies clear, details of the ice cover can be seen, including leads, individual ice floes and melt ponds. For example, on July 3 in the Canadian Archipelago, 1-kilometer resolution MODIS imagery shows that the ice surface has a distinctive blueish hue due to the presence of melt ponds on the surface (Figure 3a). Higher resolution Sentinel-2 imagery (10 meters, Figure 3b) on the other hand provides up close detail on individual melt ponds on the ice floes.
The Arctic is a cloudy place, and generally, it is difficult to obtain a clear-sky image of the entire region. However, if images are compiled, or composited, over several days, most of the region may have at least some clear sky. This approach can yield a composite image that is mostly cloud-free. The Canadian Ice Service uses this approach to create a weekly nearly cloud-free composite image of the Arctic (Figure 3c). However, because the ice cover moves (typically several kilometers per day) and melts (during the summer), over the week-long composite period, fine details that can be seen in the daily imagery are not as evident because they have been “smeared” out over the week.
An ice-diminished Arctic
In response to diminishing ice extent, the US Navy has been holding a semi-annual symposium to bring together scientists, policy makers, and others to discuss the sea ice changes and their impacts. The seventh Symposium is taking place this week in Washington, DC, and will be attended by NSIDC scientists Mark Serreze, Walt Meier, Florence Fetterer, and Ted Scambos.
Tendency for warmer winters is increasing
A new study published this week in Geophysical Research Letters by Robert Graham at the Norwegian Polar Institute shows that warm winters in the Arctic are becoming more frequent and lasting for longer periods of time than they used to. Warm events were defined by when the air temperatures rose above -10 degrees Celsius (14 degrees Fahrenheit). While this is still well below the freezing point, it is 20 degrees Celsius (36 degrees Fahrenheit) higher than average. The last two winters have seen temperatures near the North Pole rising to 0 degrees Celsius. While an earlier study showed that winter 2015/2016 was the warmest recorded at that time, the winter of 2016/2017 was even warmer.
Reference
, , , , , , , and 2017. Increasing frequency and duration of Arctic winter warming events, Geophys. Res. Lett., 44, doi:10.1002/2017GL073395.

