Arctic sea ice extent for April 2017 tied with April 2016 for the lowest in the satellite record for the month. Warm weather conditions and lower-than-average sea ice extent prevailed over the Pacific side of the Arctic, while relatively cool conditions were the rule in northern Europe and eastern North America. In the Southern Hemisphere, Antarctic sea ice extent remained lower than average.
Overview of conditions

Figure 1. Arctic sea ice extent for April 2017 was 13.83 million square kilometers (5.34 million square miles). The magenta line shows the 1981 to 2010 average extent for that month. Sea Ice Index data. About the data
Credit: National Snow and Ice Data Center
High-resolution image
Arctic sea ice extent for April 2017 averaged 13.83 million square kilometers (5.34 million square miles), and tied with April 2016 for the lowest April extent in the 38-year satellite record. The April 2017 extent is 1.02 million square kilometers (394,000 square miles) below the April 1981 to 2010 long-term average. The largest reductions in ice extent through the month occurred on the Pacific side of the Arctic, within the Bering Sea and the Sea of Okhotsk. Little change in extent occurred in the Atlantic sector of the Arctic.
Conditions in context

Figure 2a. The graph above shows Arctic sea ice extent as of May 2, 2017, along with daily ice extent data for five previous years. 2017 is shown in blue, 2016 in green, 2015 in orange, 2014 in brown, and 2013 in purple, and 2012 in dashed brown. The 1981 to 2010 median is in dark gray. The gray areas around the median line show the interquartile and interdecile ranges of the data. Sea Ice Index data.
Credit: National Snow and Ice Data Center
High-resolution image
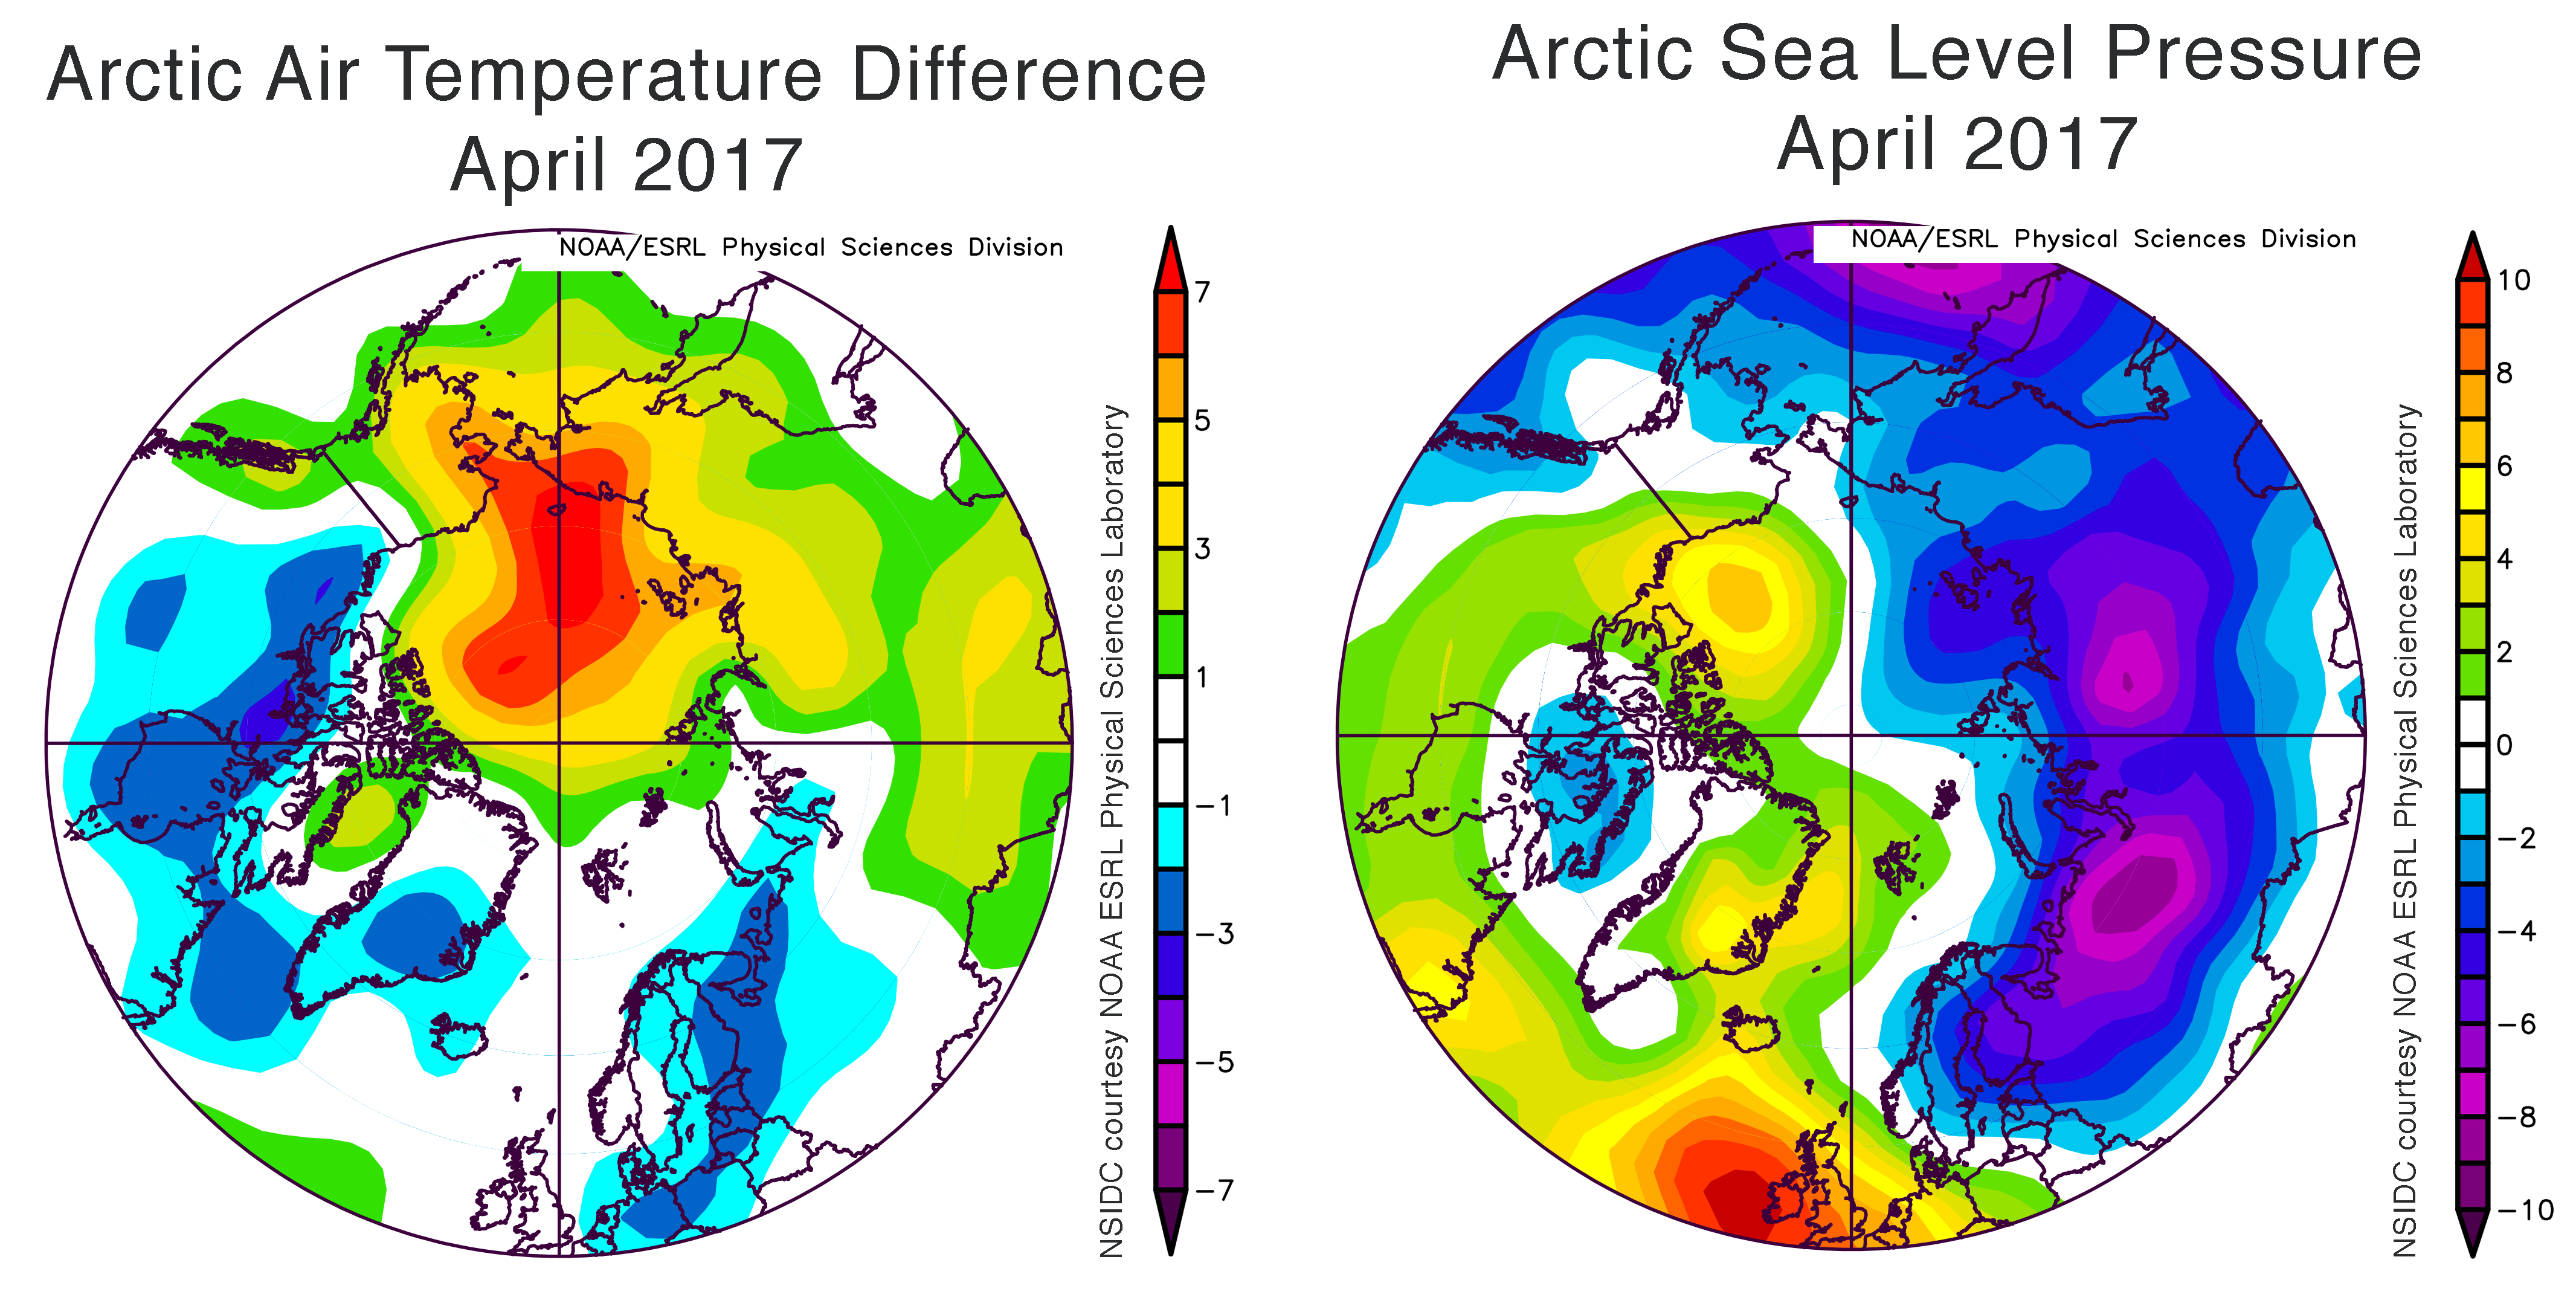
Figure 2b. These figures show April 2017 differences from average for Arctic air temperatures at the 925 hPa level (about 2,500 feet above sea level) in degrees Celsius (left) and for sea level pressure (right). Yellows and reds indicate higher than average temperatures and pressure; blues and purples indicate lower than average temperatures and pressure.
Credit: NSIDC courtesy NOAA Earth System Research Laboratory Physical Sciences Division
High-resolution image
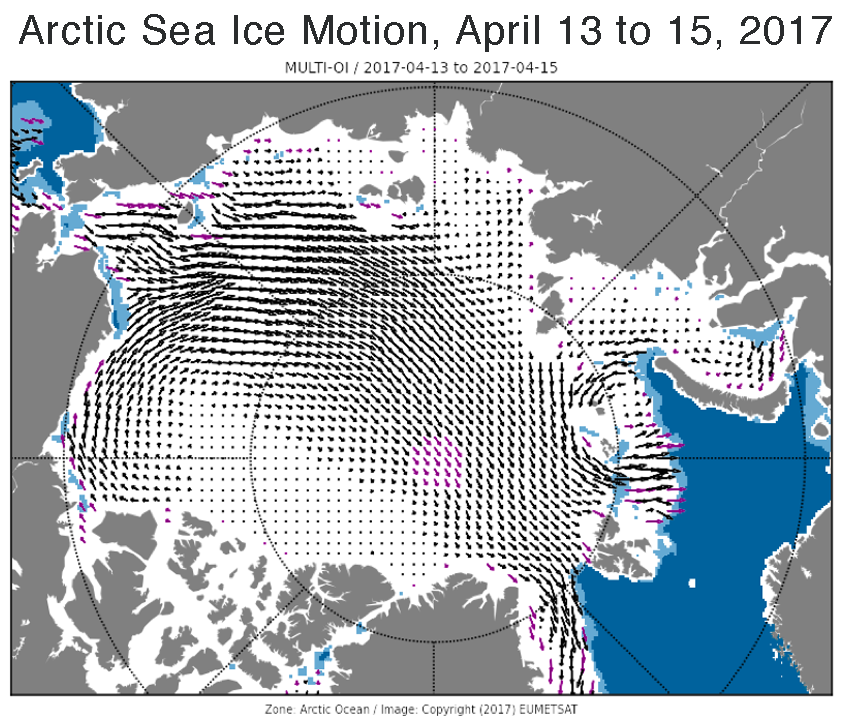
Figure 2c. These maps show Arctic sea ice motion for April 13 to 15, 2017, which is representative of the general pattern seen throughout the month. Black arrows represent sea ice drift. The purple arrows represent “filled” values, data gaps that have been interpolated from surrounding data.
Credit: EUMETSAT
High-resolution image
The decline in ice extent through the month was fairly steady, at a rate similar to what was observed over the previous two Aprils (2016 and 2015). Throughout the month, sea ice extent was either at daily record lows for the period of satellite observations, or within 100,000 square kilometers (~38,600 square miles) of record low values. At the end of the month, extent was below average in the Barents Sea, the Sea of Okhotsk, and the western Bering Sea, similar to the pattern seen in March. Despite fairly warm conditions, sea ice extent was slightly above average in Baffin Bay.
Unusually warm conditions were observed across the Pacific side of the Arctic Ocean, with temperatures at the 925 hPa level (about 2,500 feet above sea level) north of the Bering Strait ranging from 6 to 8 degrees Celsius (11 to 14 degrees Fahrenheit) above the 1981 to 2010 average. Western Alaska and easternmost Siberia also saw warm conditions. However, below average temperatures ruled across a broad swath of northern Canada. Of particular note, cooler-than-average conditions also prevailed over Greenland, leading to relatively little surface melting on the ice sheet in April (unlike the preceding two years).
The overall temperature pattern is consistent with the average sea level pressure pattern for the month, which had large areas of low and higher-than-average pressure in the Eastern and Western Hemispheres, respectively. This pattern produces a cross-Arctic airflow, with southerly winds from the Bering Sea blowing into the Chukchi Sea and central Arctic, and cool winds blowing from the north over Scandinavia and other areas of northern Europe. This cross-Arctic wind pattern is also evident in the sea ice motion field for April 2017. Sea ice motion is determined by tracking patterns in the sea ice in both visible imagery and in passive microwave data from satellites.
April 2017 compared to previous years

Figure 3a. Monthly April ice extent for 1979 to 2017 shows a decline of 2.6 percent per decade.
Credit: National Snow and Ice Data Center
High-resolution image
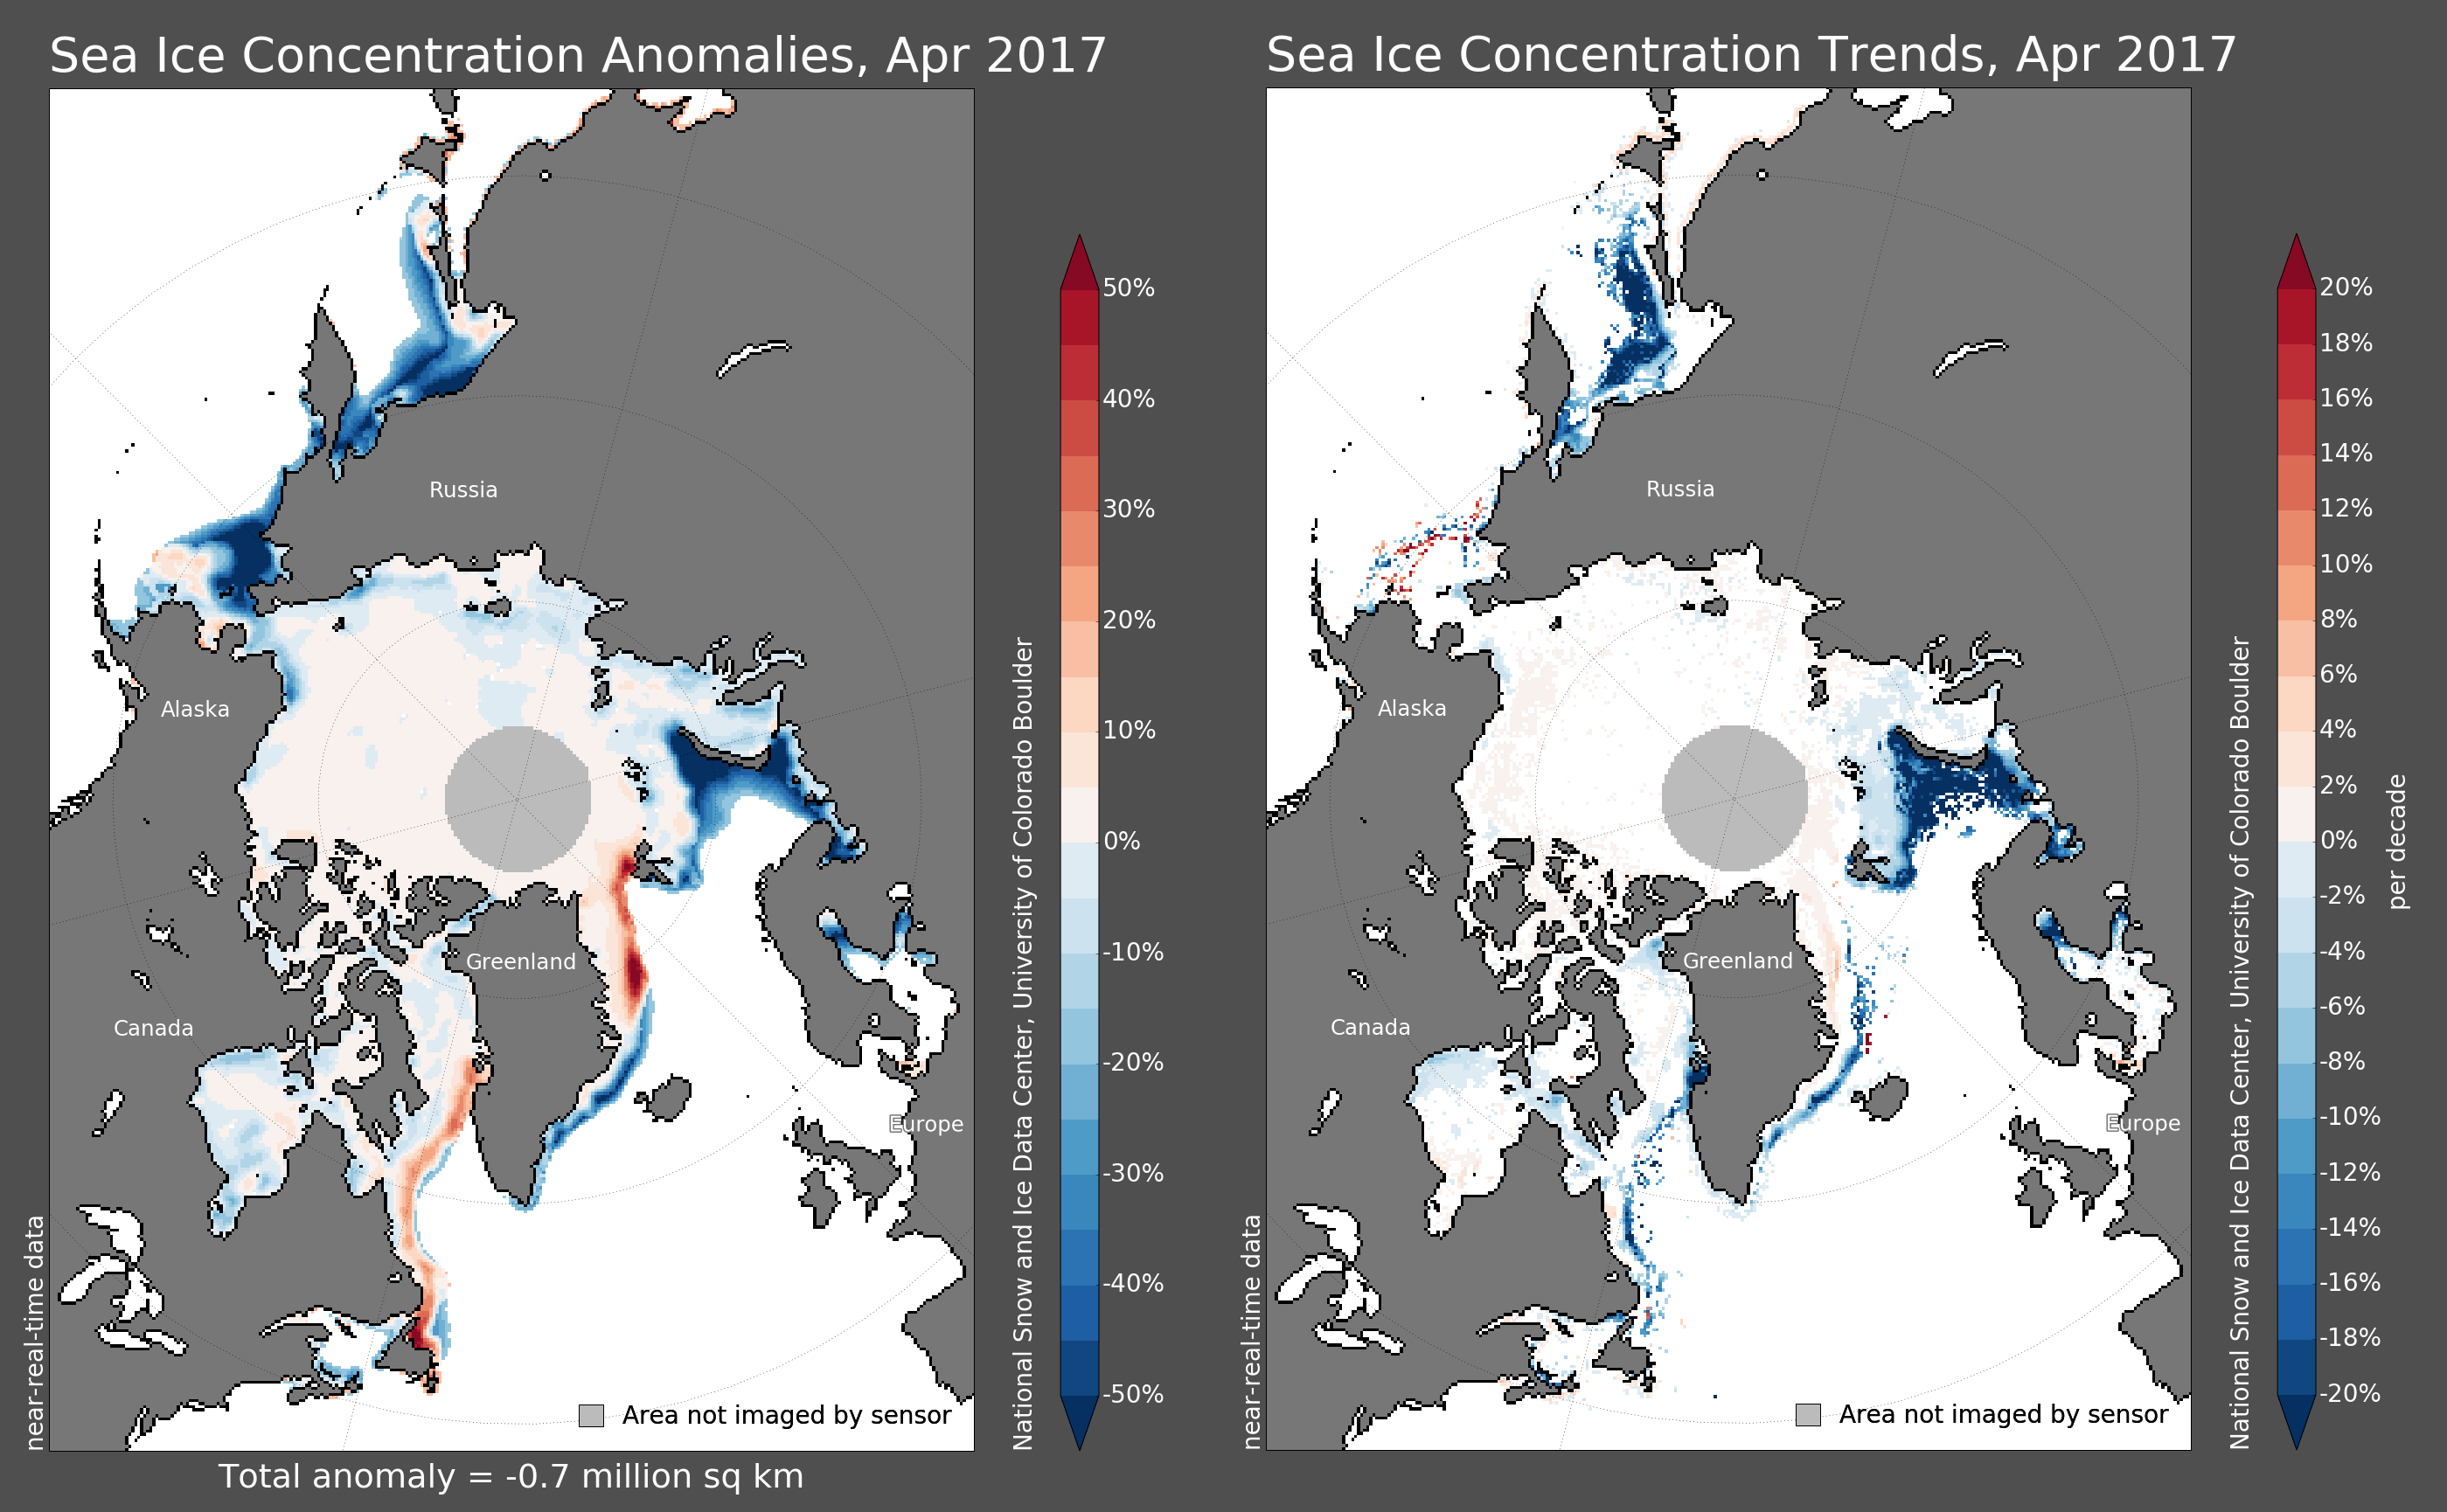
Figure 3b. These images show April 2017 Arctic sea ice concentration anomalies (left) and Arctic sea ice concentration trends (right). Sea Ice Index data. About the data
Credit: National Snow and Ice Data Center
High-resolution image
The linear rate of decline for April is 38,000 square kilometers (15,000 square miles) per year, or 2.6 percent per decade.
Declining ice extent in the Barents Sea, Sea of Okhotsk, and off the coast of southeastern Greenland is a part of the long-term pattern of sea ice decline. Below-average ice extent in the western Bering Sea has to date not been a part of the long-term trend for April.
A report from the field
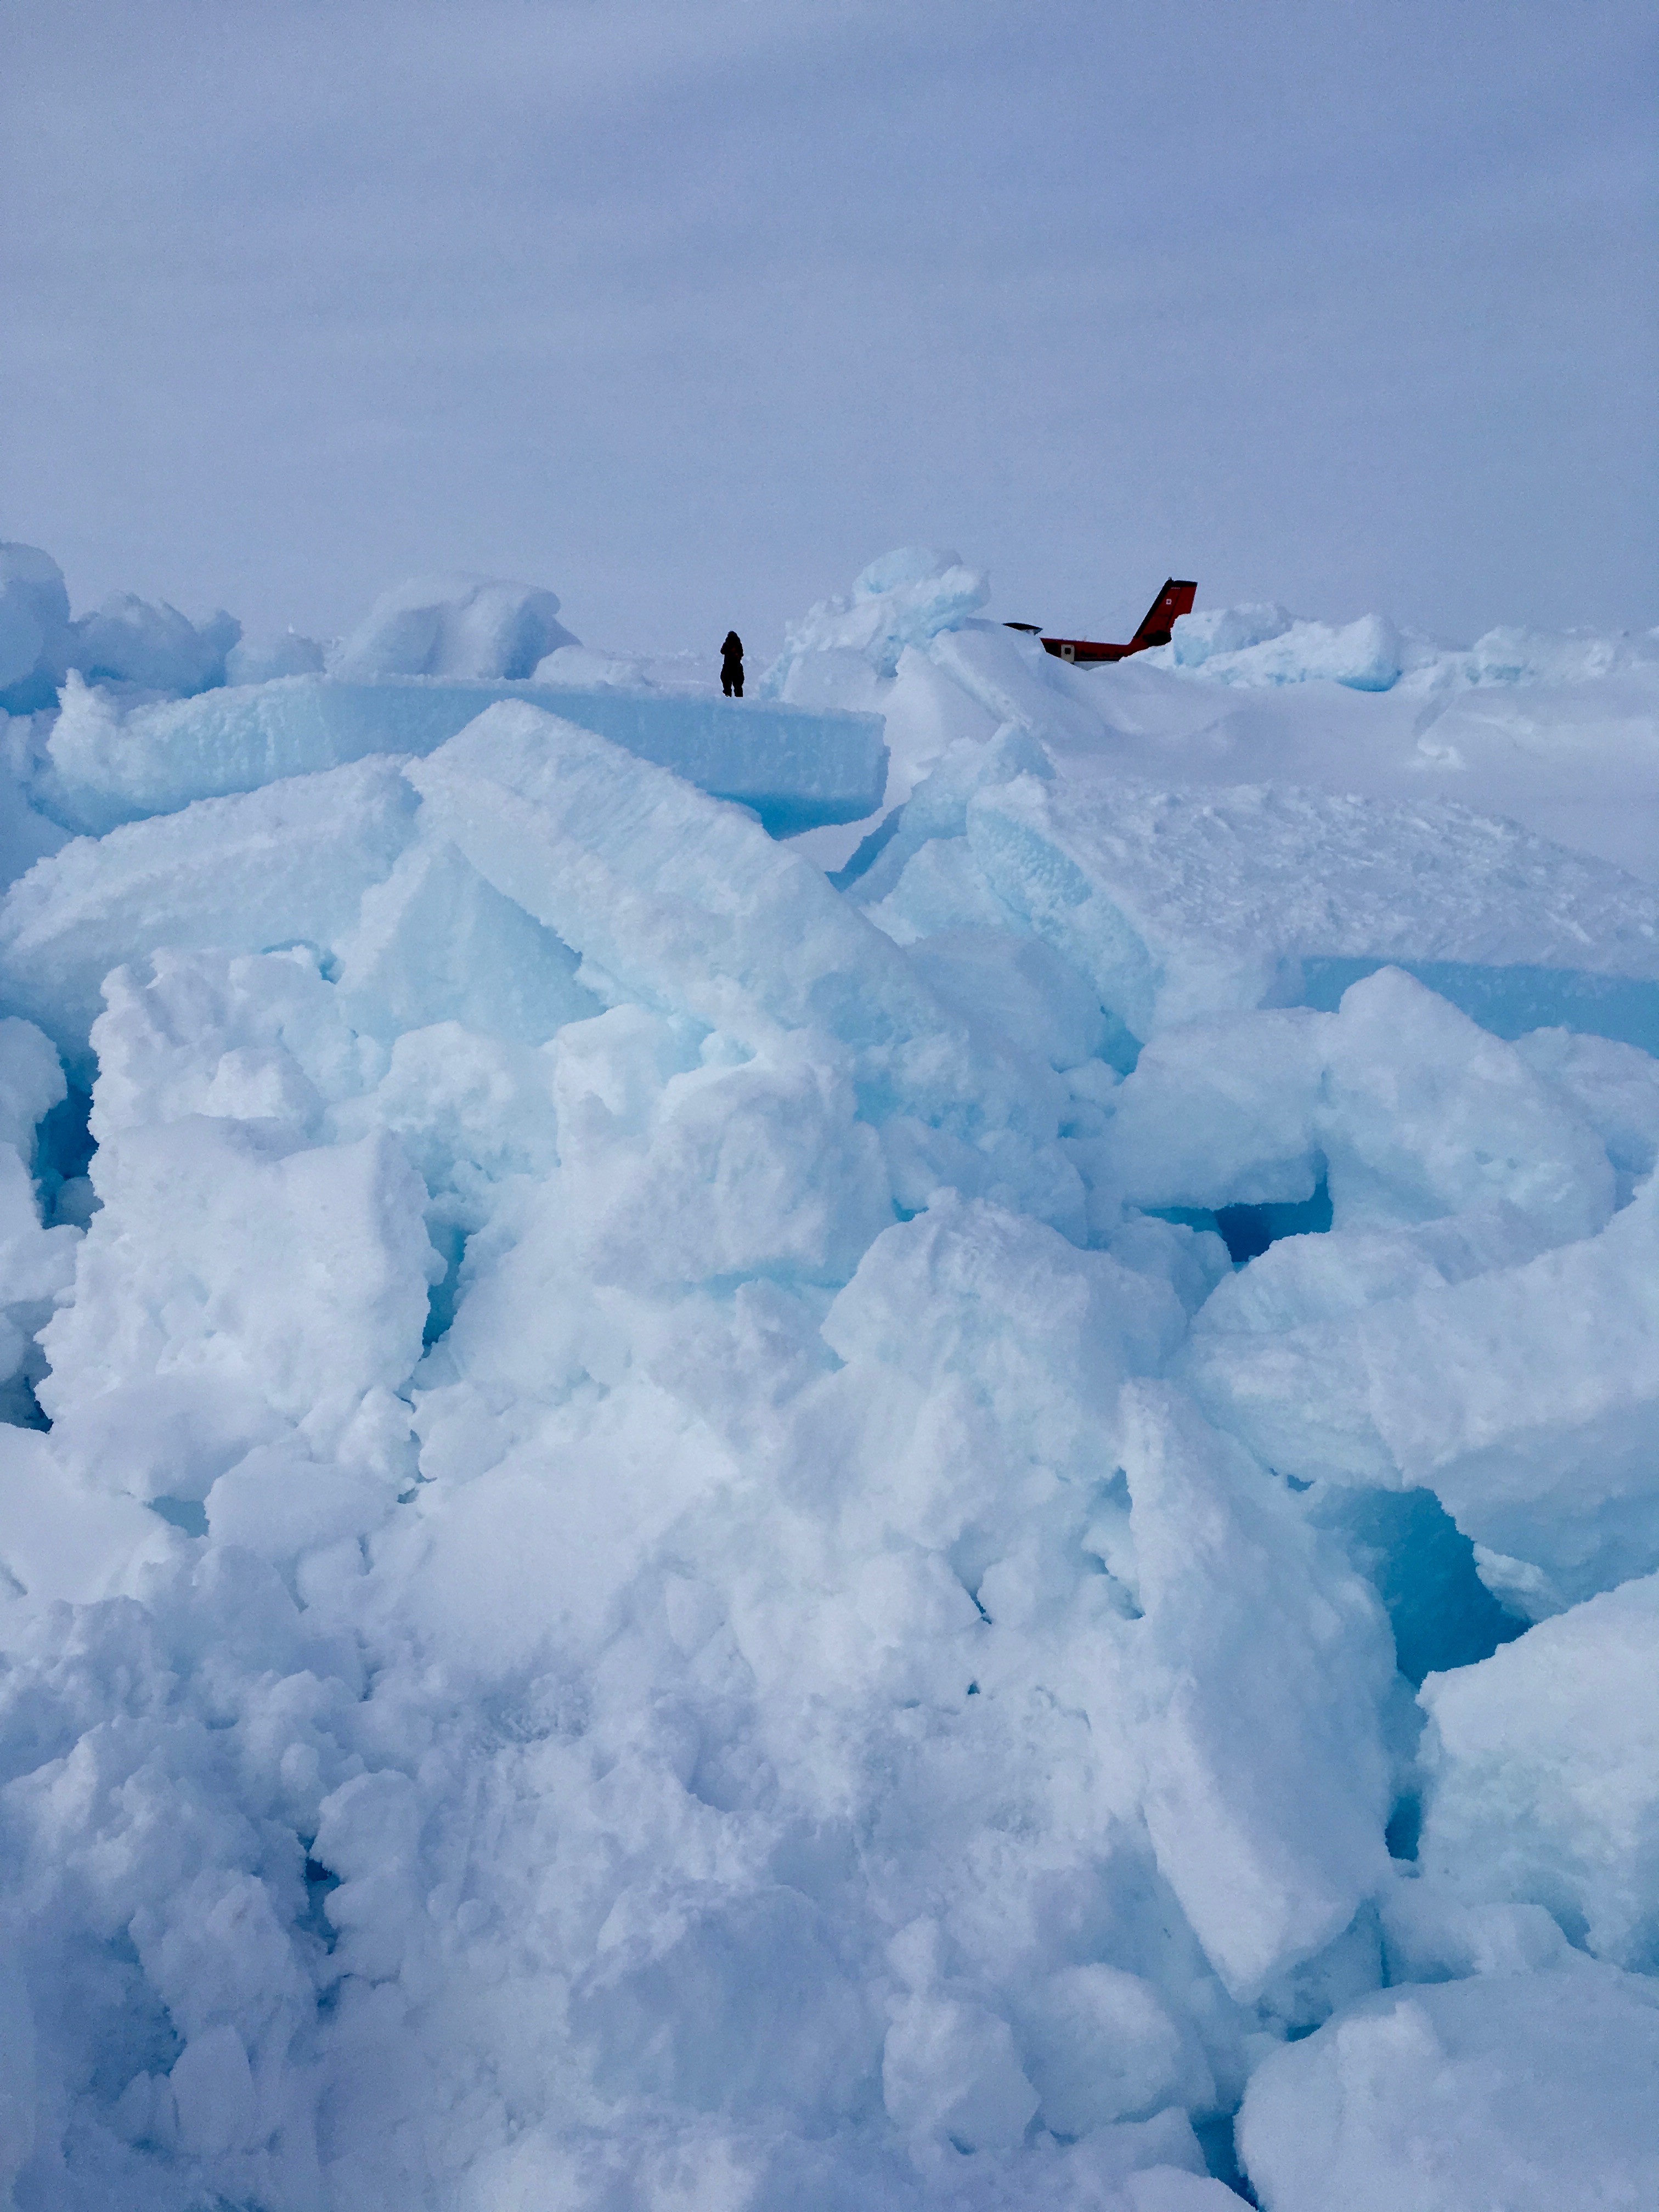
Figure 4. This photo shows broken up sea ice and some multi-year floes at Alert, on the northern tip of Ellesmere Island, Canada on April 2017. A researcher and a Twin Otter aircraft are obscured in the background.
Credit: J. Stroeve/NSIDC
High-resolution image
NSIDC scientist Julienne Stroeve continued her Arctic field work into early April, moving from Cambridge Bay, Canada to Alert in Ellesmere Island. In Alert, Stroeve focused on sampling ice thickness and snow pack characteristics along a CryoSat-2 flight track within the Lincoln Sea. This is an area between northernmost Greenland and Ellesmere Island where thick, old ice remains. The scientists flew by Twin Otter each day, out onto the sea ice between latitudes 83°N and 87.1°N. The field campaign was also supported by an aircraft from the British Antarctic Survey carrying a Ka band radar, LiDAR, and a broadband radiometer. A NASA Operation IceBridge flight also flew over the same track.
The group noted that the ice was unusually broken up and reduced to rubble, with few large multi-year floes, forcing the pilots to land on refrozen leads that at times were only 70 centimeters (28 inches) thick. Pilots remarked that they had never seen the ice look like this. Preliminary estimates suggest mean thicknesses ranging from 2 to 3.4 meters (6.6 to 11 feet), with the thickest ice found between an ice bridge in the Lincoln Sea and mobile pack ice to the north. Modal thickness, a representation of thermodynamically-grown level ice, ranged between 1.8 and 2.9 meters (6 and 10 feet), including 0.25 to 0.4 meters (10 to 16 inches) of snow. Second- and first-year modal ice thicknesses ranged between 1.8 and 1.9 meters (6 and 6.2 feet), about 0.2 meters (8 inches) thinner than previous airborne measurements indicated. More details can be found at the European Space Agency’s Campaigns at Work blog.
Arctic sea ice age

Figure 5. These maps shows 2016 (top left) and 2017 (top right) Arctic sea ice age for the end of March and the time series of percent coverage for the Arctic Ocean (bottom).
Credit: National Snow and Ice Data Center, courtesy M. Tschudi, C. Fowler, J. Maslanik, R. Stewart/University of Colorado Boulder; W. Meier/NASA Cryospheric Sciences
High-resolution image
Sea ice age is a proxy for ice thickness, with older ice generally meaning thicker ice. Though ice can pile up into rubble fields when the motion of the ice pushes up against the coast or thicker ice, level ice generally increases in thickness as it ages through more winter freeze cycles. Thus, ice age is a reasonable indicator of the sea ice thickness.
At the end of March, ice age data show only a small remaining coverage of old (5+ years) ice. Since 2011, the oldest ice has comprised less than 5 percent of the total ice cover. During the mid-1980s, such ice made up nearly a third of the ice.
The next oldest ice category, four-year-old ice has also dropped from about 8 to 10 percent to less than 5 percent. The coverage of intermediate age ice categories (2- and 3-year-old ice) has stayed fairly consistent through time. The oldest ice has essentially been replaced by first-year ice (ice that has formed since the previous September). First-year-ice has risen from 35 to 40 percent of the Arctic Ocean’s ice cover during the mid-1980s to about 70 percent now.
Comparison of March 2016 conditions to this year shows a similar percentage coverage for the different ice ages. However, the spatial distribution is different. In March 2016, bands of the oldest ice extended through the Beaufort Sea and into the Chukchi, with scattered patches north of the Canadian Archipelago and Greenland. This year, the oldest ice is consolidated against the coast of Greenland and the archipelago except for a short arm extending north to the region around the pole. Most of the third year ice is between Fram Strait and the pole, which means it is likely to exit the Arctic Ocean during the coming months.
Antarctic ice extent low, but not lowest
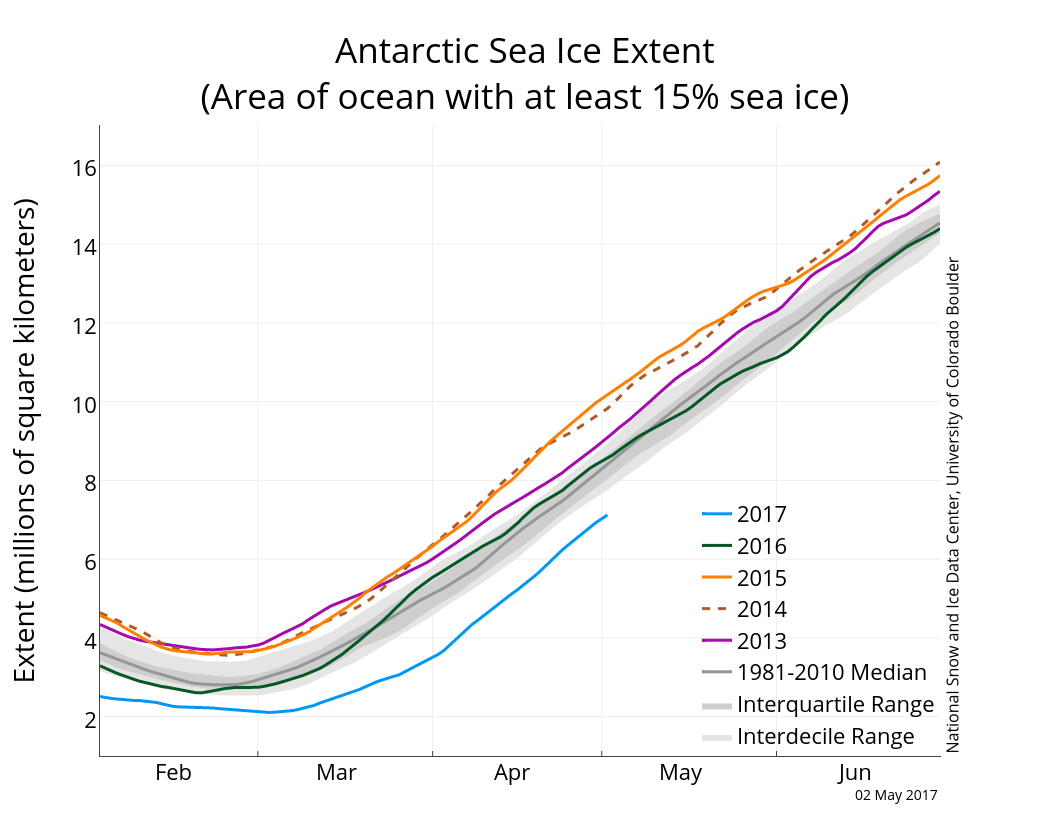
Figure 6. The graph above shows Antarctic sea ice extent as of May 2, 2017, along with daily ice extent data for four previous years. 2017 is shown in blue, 2016 in green, 2015 in orange, 2014 in dashed brown, and 2013 in purple. The 1981 to 2010 median is in dark gray. The gray areas around the median line show the interquartile and interdecile ranges of the data. Sea Ice Index data.
Credit: National Snow and Ice Data Center
High-resolution image
Antarctic sea ice grew at a slightly faster-than average pace in April, but was still setting daily record lows until about April 10, after which extent rose above the 1980 ice extent. The April 2017 sea ice extent is lower than average in the Amundsen Sea and slightly lower than average in the Ross Sea and easternmost Weddell Sea. However, an area of above average extent is present in the north-central Weddell. Temperatures on the continent were above average over West Antarctica and western Wilkes Land, and considerably below average over the central Weddell sea.

