Arctic sea ice reaches lowest maximum extent on record

On February 25, 2015, Arctic sea ice extent appeared to have reached its annual maximum extent, marking the beginning of the sea ice melt season. This year’s maximum extent not only occurred early; it is also the lowest in the satellite record. However, a late season surge in ice growth is still possible. NSIDC will post a detailed analysis of the 2014 to 2015 winter sea ice conditions in early April.

Overview of conditions

Figure 1. Arctic sea ice extent for February 25, 2015

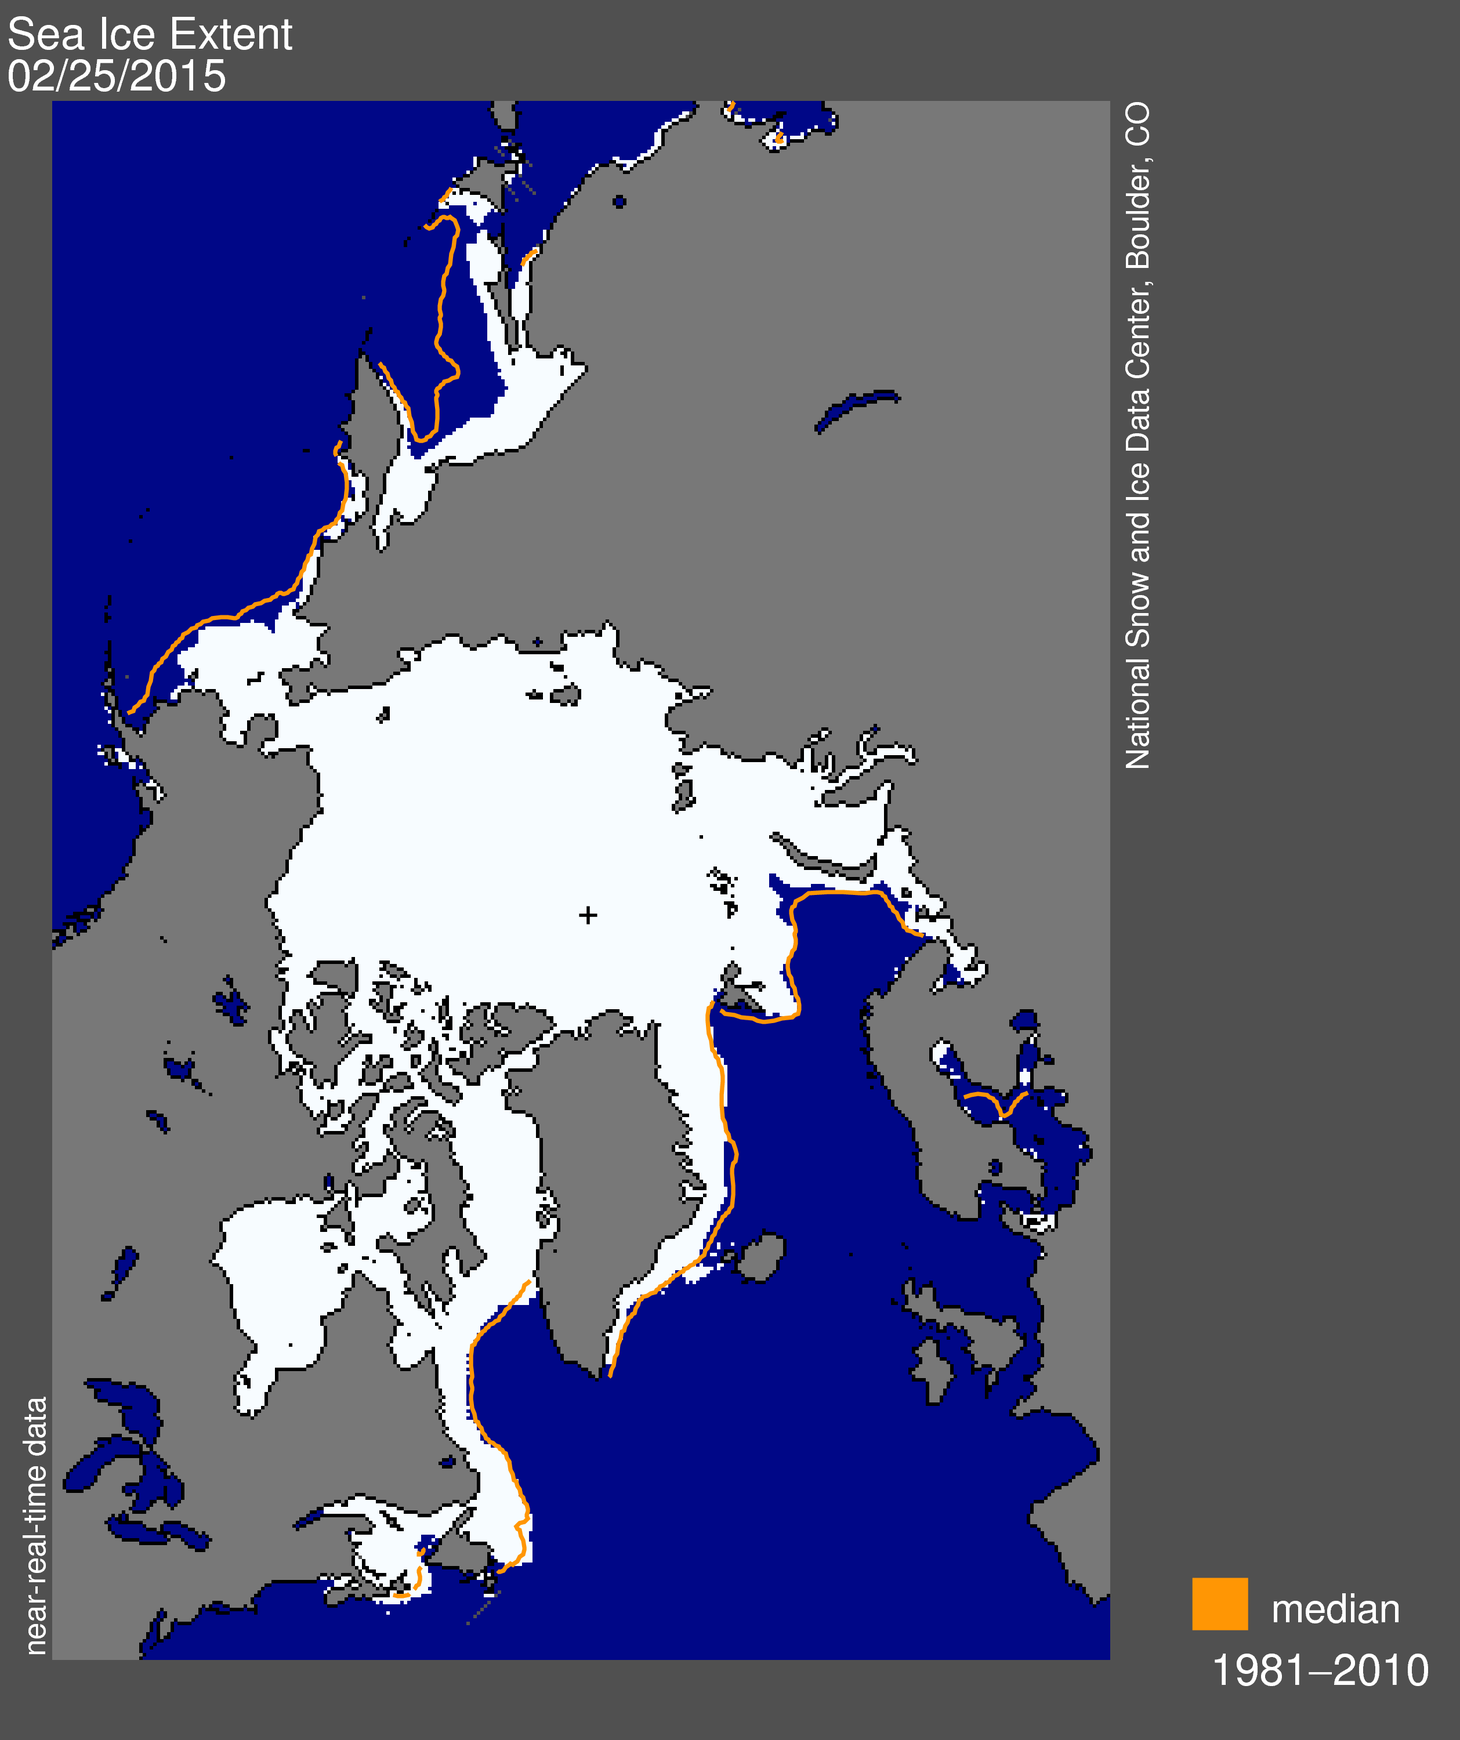
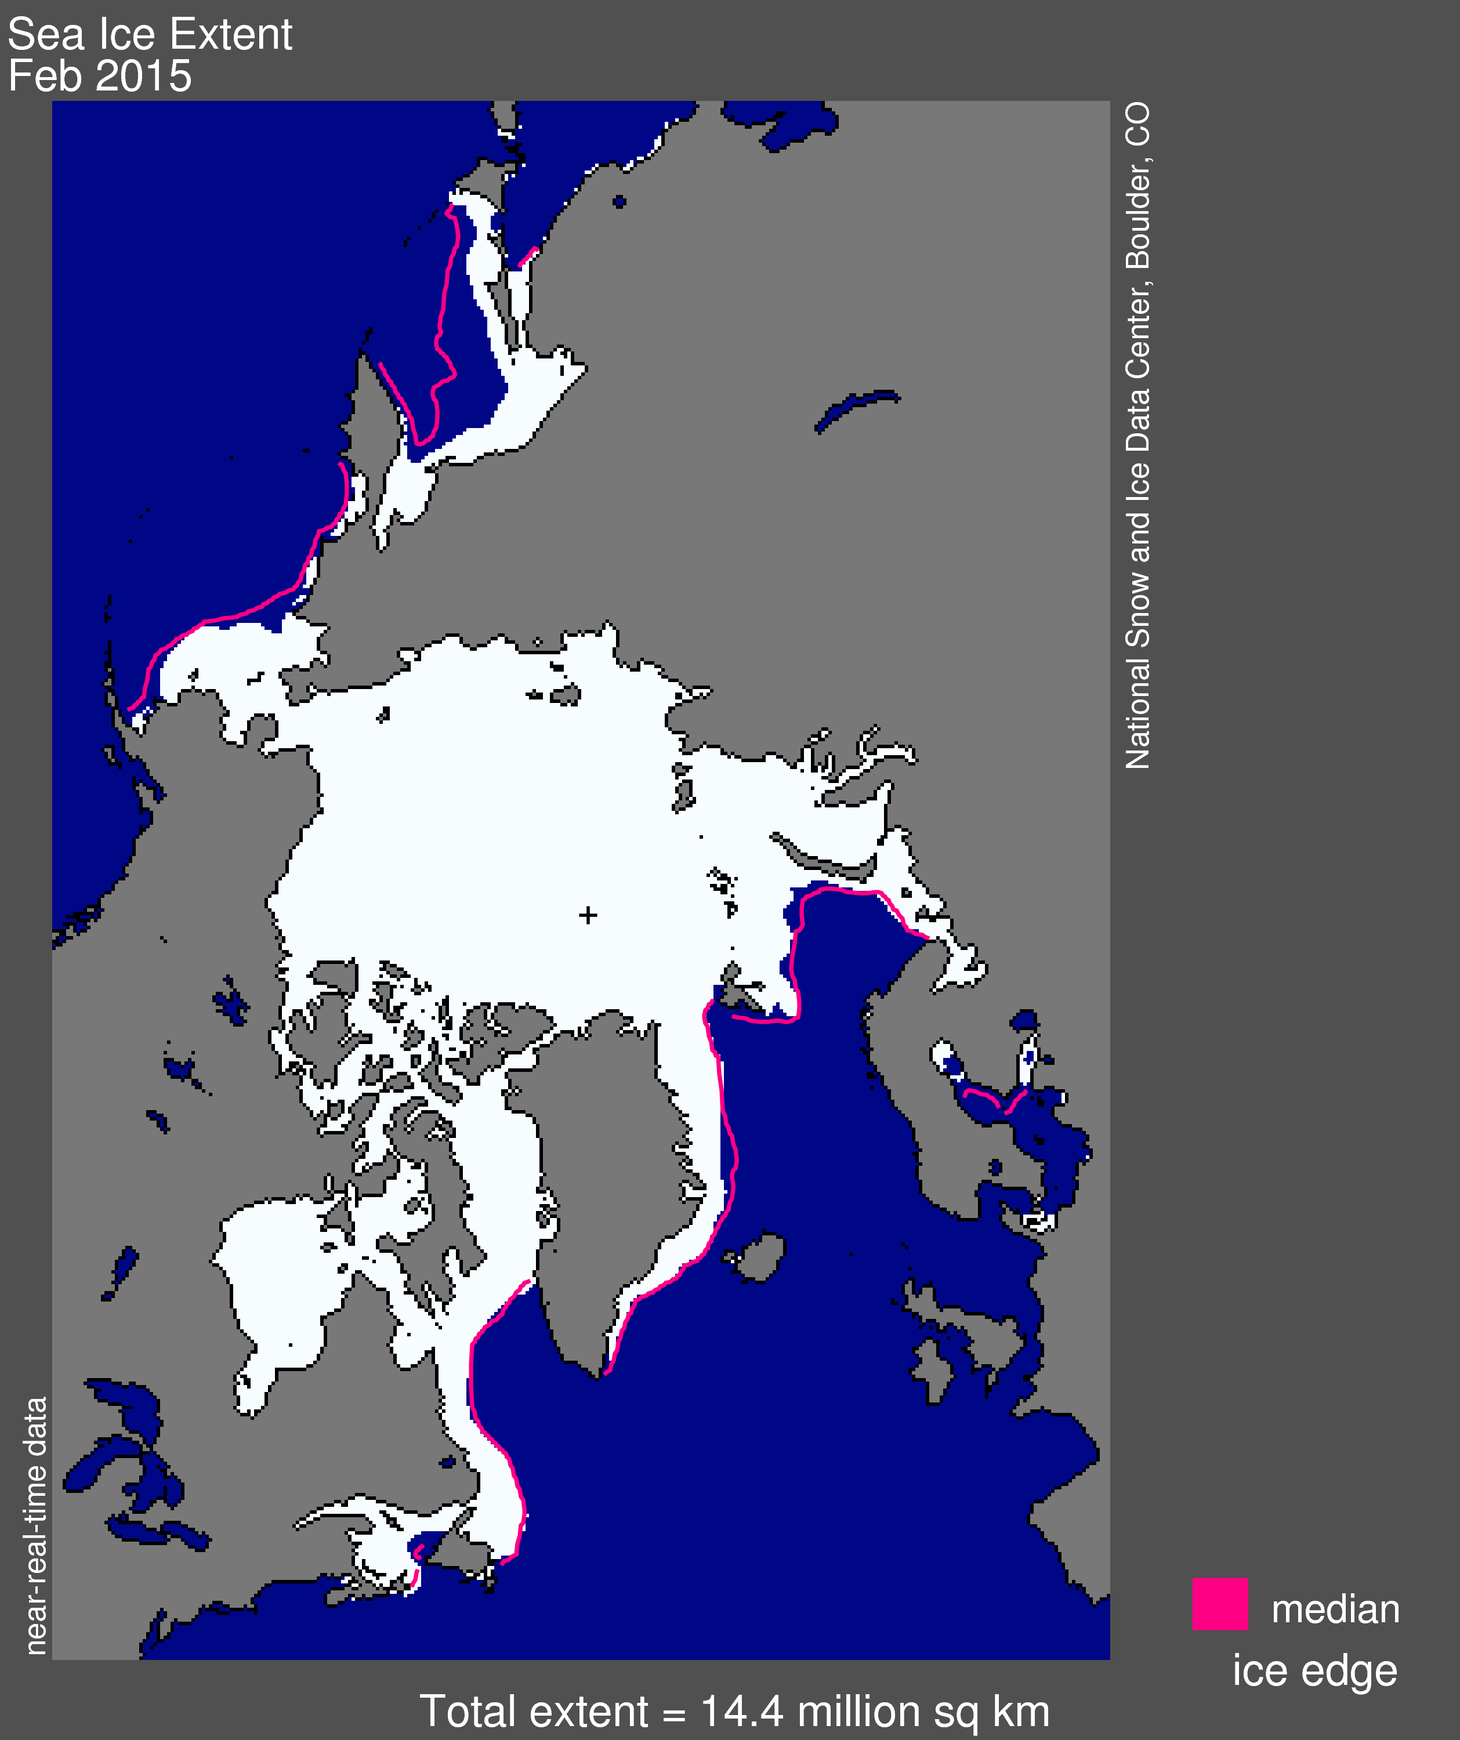
Figure 1. Arctic sea ice extent for February 25, 2015 was 14.54 million square kilometers (5.61 million square miles). The orange line shows the 1981 to 2010 median extent for that day. The black cross indicates the geographic North Pole. Sea Ice Index data. About the data

Credit: National Snow and Ice Data Center
High-resolution image

On February 25, 2015 Arctic sea ice likely reached its maximum extent for the year, at 14.54 million square kilometers (5.61 million square miles). This year’s maximum ice extent was the lowest in the satellite record, with below-average ice conditions everywhere except in the Labrador Sea and Davis Strait. The maximum extent is 1.10 million square kilometers (425,000 square miles) below the 1981 to 2010 average of 15.64 million square kilometers (6.04 million square miles) and 130,000 square kilometers (50,200 square miles) below the previous lowest maximum that occurred in 2011. This year’s maximum occurred 15 days earlier than the 1981 to 2010 average date of March 12. The date of the maximum has varied considerably over the years, occurring as early as February 24 in 1996 and as late as April 2 in 2010.

Because of the variability of ice extent at this time of year, there can be some delay in pinpointing the date of the maximum extent, as was true this year. NSIDC calculates daily ice extent as an average of the previous five days (see the Sea Ice Index documentation for more information), and we also look for a clear downward trend for a number of days.

While the downturn in extent was quite pronounced on February 25, the trend subsequently flattened. This is in part due to recent ice growth in the Bering Sea, partly balancing continued ice retreat in the Barents and Kara seas. Over the next two to three weeks, periods of increase are still possible. However, it now appears unlikely that there could be sufficient growth to surpass the extent reached on February 25.

Conditions in context

Arctic sea ice extent as of March 18, 2015

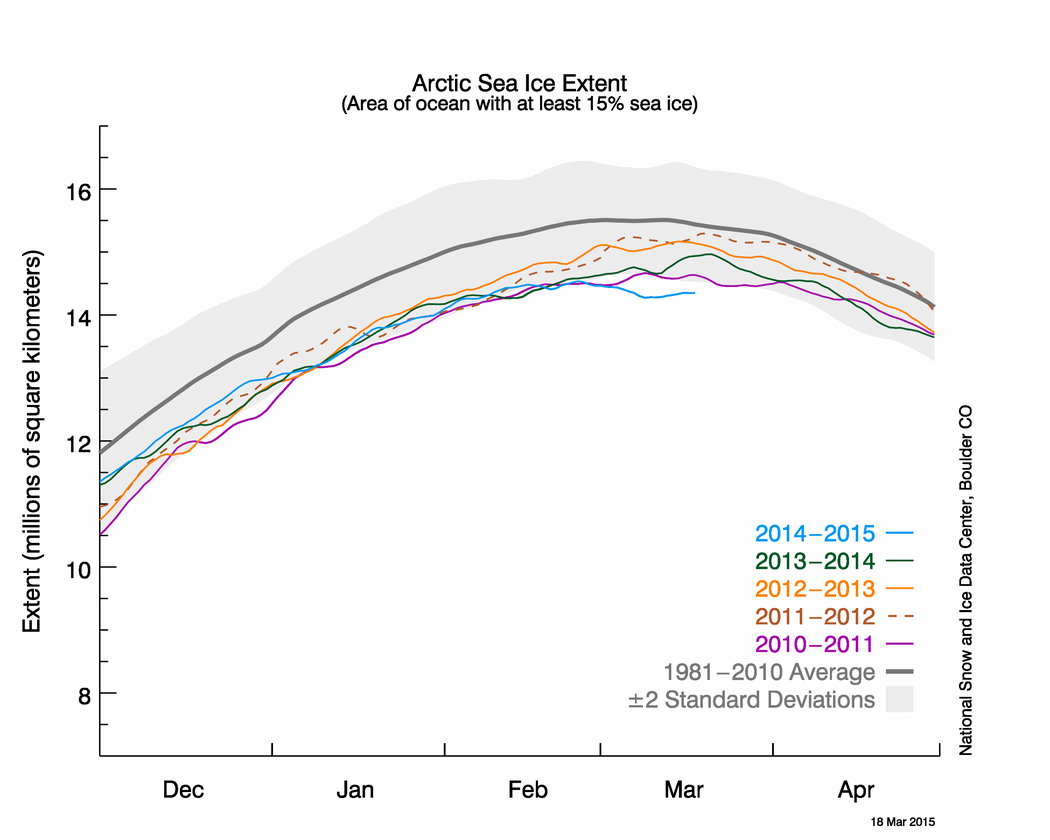
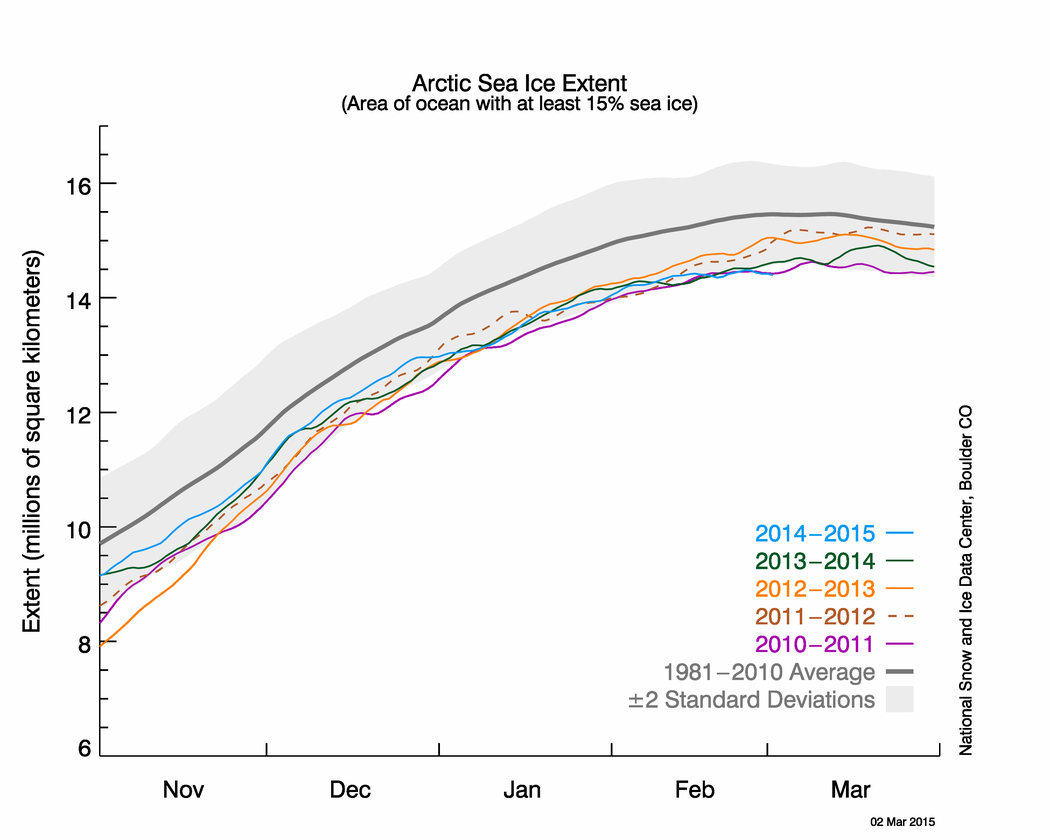
Figure 2. The graph above shows Arctic sea ice extent as of March 18, 2015, along with daily ice extent data for four previous years. 2014 to 2015 is shown in blue, 2013 to 2014 in green, 2012 to 2013 in orange, 2011 to 2012 in brown, and 2010 to 2011 in purple. The 1981 to 2010 average is in dark gray. The gray area around the average line shows the two standard deviation range of the data.Sea Ice Index data.

Credit: National Snow and Ice Data Center
High-resolution image

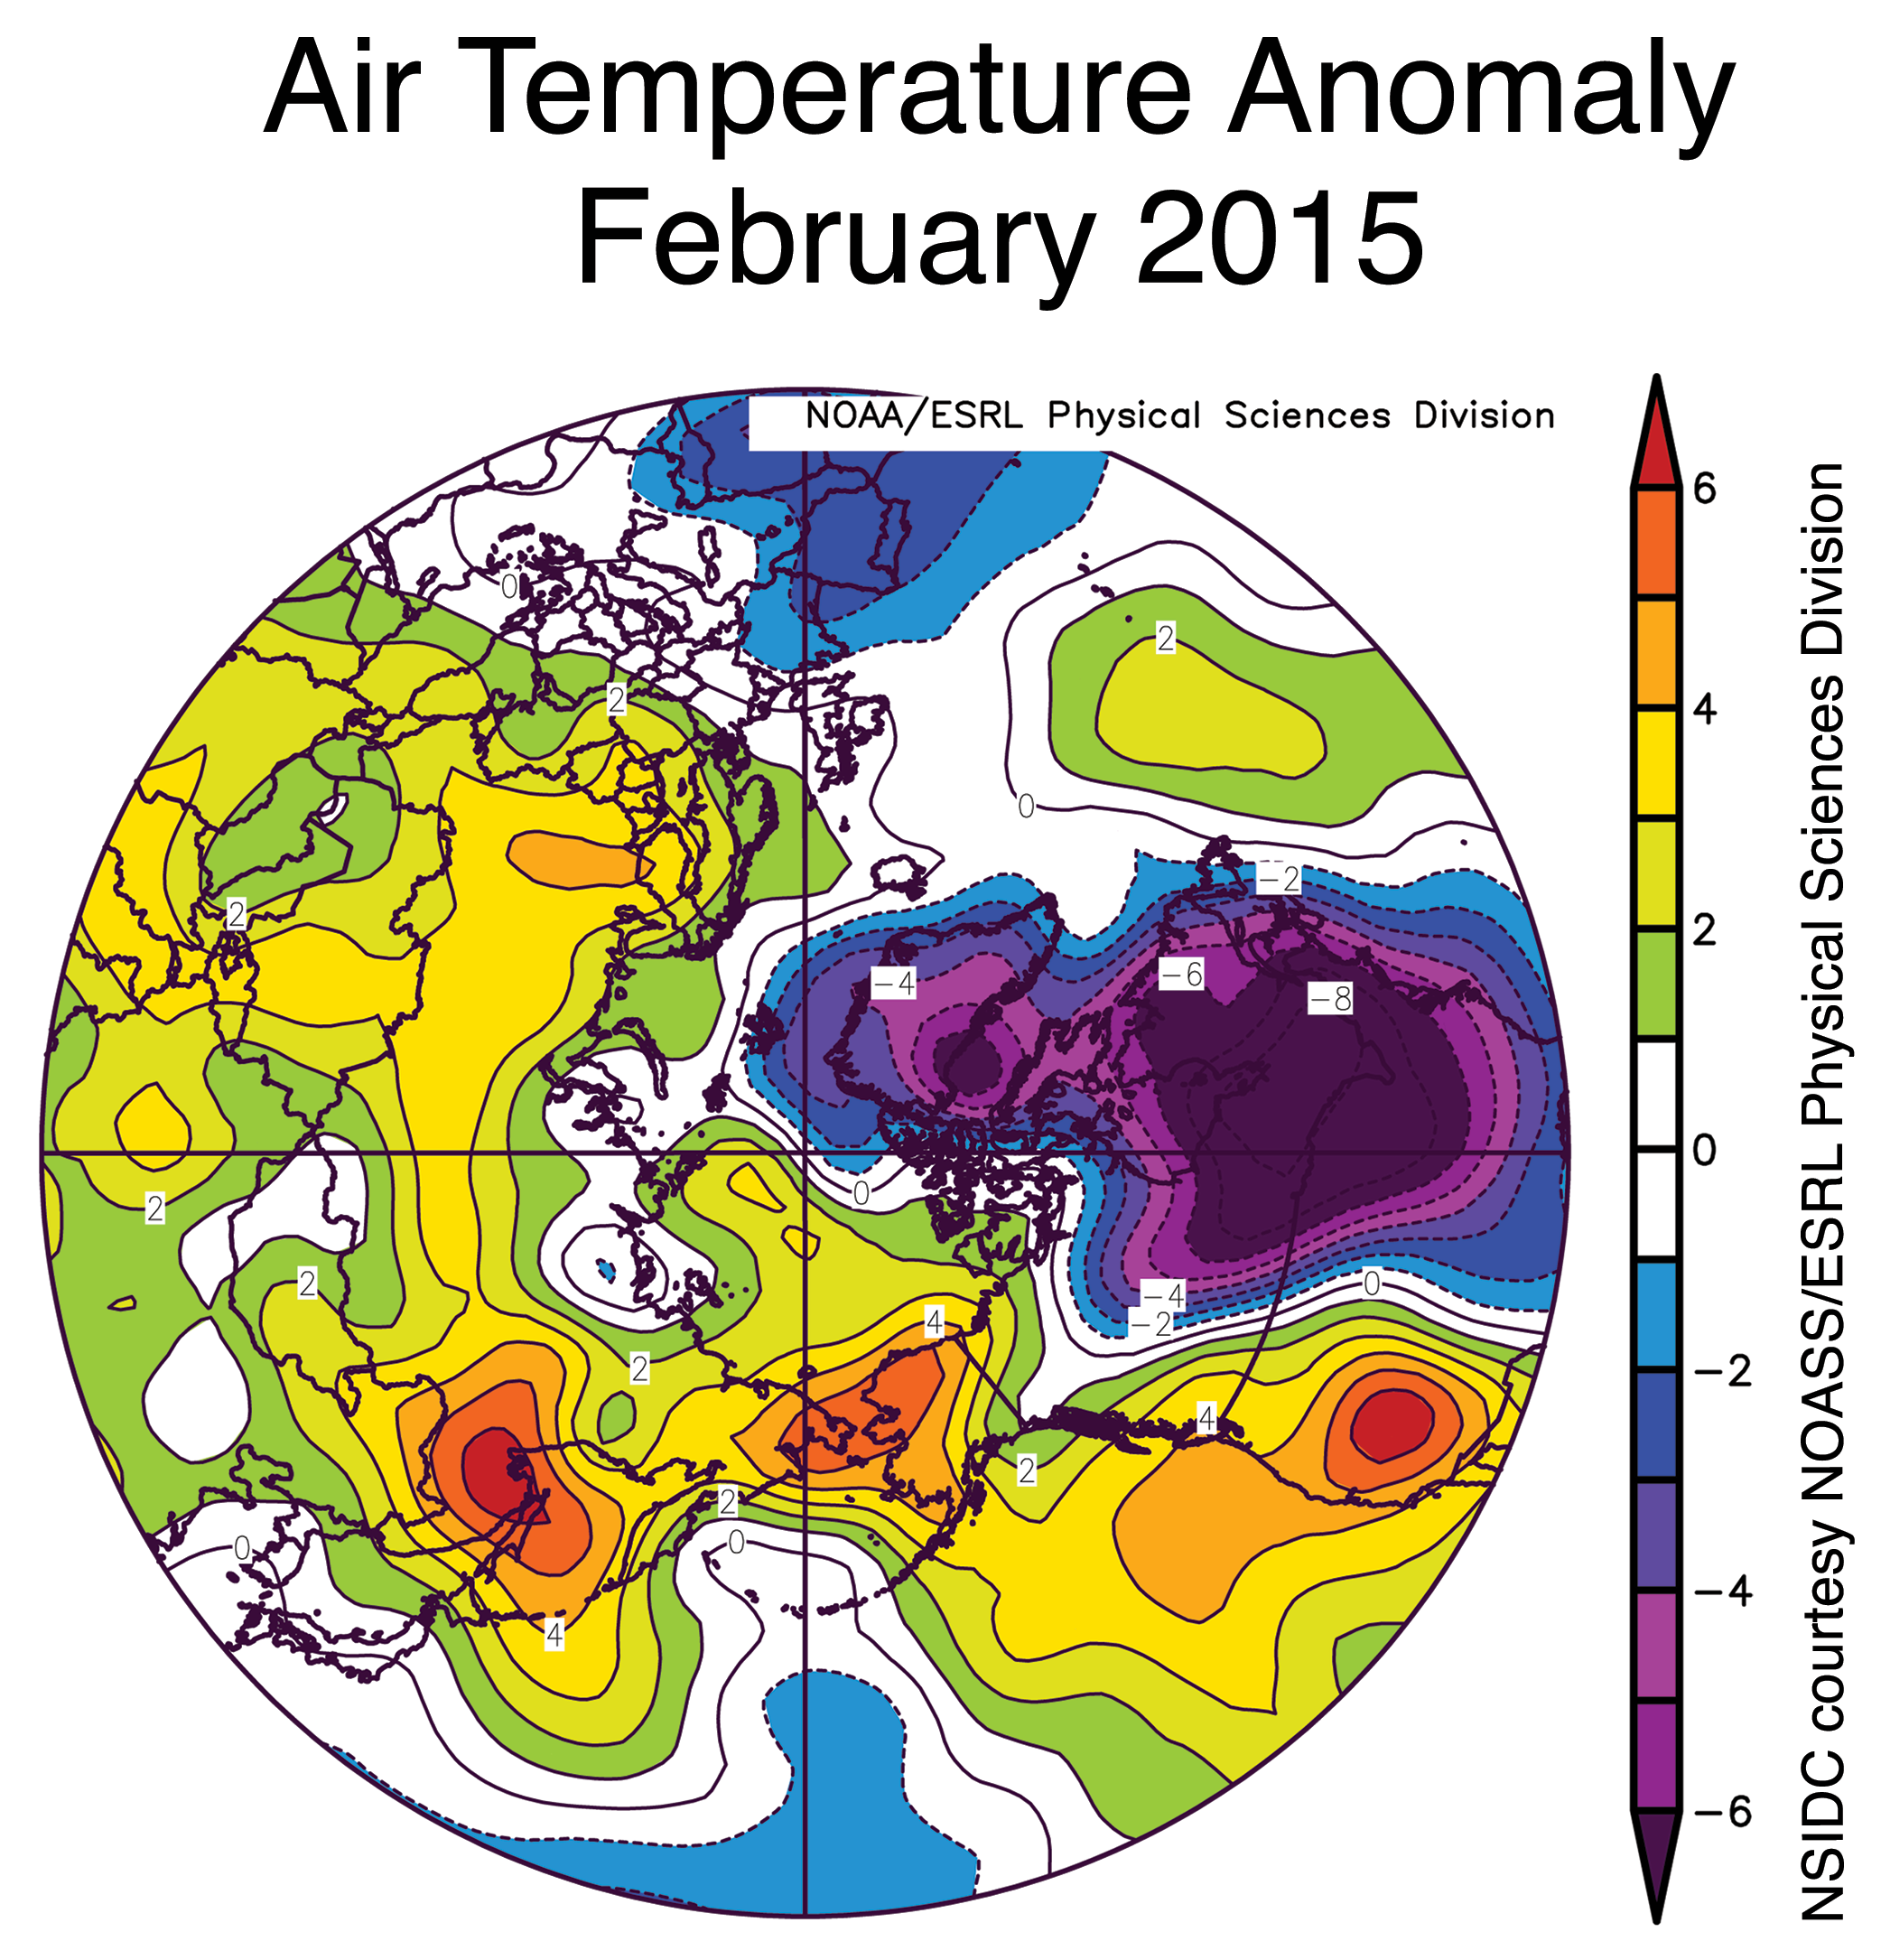
Over the 2014 to 2015 winter season, sea ice extent grew 9.91 million square kilometers (3.83 million square miles). This was substantially less ice growth than last year, which saw record growth over the winter. Part of the explanation for the record low maximum lies with recent weather patterns. As discussed in our previous post, February was characterized by an unusual configuration of the jet stream, leading to warm conditions over the Pacific side of the Arctic that maintained low sea ice extent in the Bering Sea and the Sea of Okhotsk. Furthermore, since the last half of February through the middle of March, the Arctic Oscillation was in a strongly positive phase, with index values exceeding 5.0 for several days in the first week of March. This has been expressed as a strong Icelandic Low, a semi-permanent area of low atmospheric pressure found between Iceland and southern Greenland and extending into the Barents Sea. The strong Icelandic Low led to a pattern of surface winds over the Barents and Kara seas with an unusually strong component from the south.

Over the first two weeks of March, temperatures throughout the eastern Arctic at the 925 hPa level (approximately 3,000 feet altitude) were several degrees Celsius above average, with temperatures as much as 8 to 10 degrees Celsius (14 to 18 degrees Fahrenheit) above average in the Barents Sea between Svalbard and Franz Josef Land.

While the seven-day weather forecasts show continued warmer-than-average conditions over the eastern Arctic, colder-than-average conditions are expected over the Bering Sea and may still lead to some new ice formation. Thus, while the maximum appears to have occurred on February 25, late season ice growth may still occur.

Final analysis pending

At the beginning of April, NSIDC scientists will release a full analysis of winter conditions, along with monthly data for March. For more information about the maximum extent and what it means, see the NSIDC Icelights post, the Arctic sea ice maximum.

Updates to the Sea Ice Index

Recently, NSIDC made two revisions to Arctic Sea Ice Index extent values used in our analyses, to improve scientific accuracy. These changes do not significantly affect sea ice trends and year-to-year comparisons, but in some instances users may notice very small changes in values from the previous version of the data. First, calculations of ice extent near the North Pole were improved whenever a newer satellite orbited closer to the pole than older satellites in the series, by using a sensor-specific pole hole for the extent calculations. Second, the accuracy of ice detection near the ice edge was slightly improved by adopting an improved residual weather effect filter. Details on the changes are discussed in the Sea Ice Index documentation.

Possibly low maximum in the north, a high minimum in the south

Arctic sea ice extent continues to track well below average, but it is still unclear whether March will see an increase in ice, or establish a record low maximum. Regionally, Arctic ice extent is especially low in the Sea of Okhotsk and the Bering Sea. In the Antarctic, sea ice shrank to the fourth highest minimum in the satellite record.

Overview of conditions

Figure 1. Arctic sea ice extent for February 2015

Figure 1. Arctic sea ice extent for February 2015 was 14.41 million square kilometers (5.56 million square miles). The magenta line shows the 1981 to 2010 median extent for that month. The black cross indicates the geographic North Pole. Sea Ice Index data. About the data

Credit: National Snow and Ice Data Center
High-resolution image

Arctic sea ice extent in February averaged 14.41 million square kilometers (5.56 million square miles). This is the third lowest February ice extent in the satellite record. It is 940,000 square kilometers (362,900 square miles) below the 1981 to 2010 long-term average of 15.35 million square kilometers (5.93 million square miles). It is also 50,000 square kilometers (19,300 square miles) above the record low for the month observed in 2005.

With the Arctic Ocean completely ice covered, the remaining areas of potential new ice growth are limited to the margins of the pack in the northern Pacific and northern Atlantic. Sea ice extent is below average across the entire sea ice margin, most prominently along the Pacific sectors. A small region of above-average ice extent is located near Newfoundland and the Canadian Maritime Provinces.

The Arctic maximum is expected to occur in the next two or three weeks. Previous years have seen a surge in Arctic ice extent during March (e.g., in 2012, 2014). However, if the current pattern of below-average extent continues, Arctic sea ice extent may set a new lowest winter maximum.

Conditions in context

Figure 2. The graph above shows Arctic sea ice extent as of March 2, 2015, along with daily ice extent data for four previous years

Figure 2. The graph above shows Arctic sea ice extent as of March 2, 2015, along with daily ice extent data for four previous years. 2014 to 2015 is shown in blue, 2013 to 2014 in green, 2012 to 2013 in orange, 2011 to 2012 in brown, and 2010 to 2011 in purple. The 1981 to 2010 average is in dark gray. The gray area around the average line shows the two standard deviation range of the data. Sea Ice Index data.

Credit: National Snow and Ice Data Center
High-resolution image

Arctic sea ice extent increased by 429,000 square kilometers (165,600 square miles) during the month of February. This gain was slightly less than the average for the month. While low extent for the Arctic as a whole was largely driven by conditions in the Sea of Okhotsk and the Bering Sea, extent was also slightly below average along the Barents Sea and parts of the East Greenland Sea.

February 2015 compared to previous years

Figure 3. Monthly February ice extent for 1979 to 2015 shows a decline of 2.9% per decade relative to the 1981 to 2010 average.

Figure 3. Monthly February ice extent for 1979 to 2015 shows a decline of 2.9% per decade relative to the 1981 to 2010 average.

Credit: National Snow and Ice Data Center
High-resolution image

The monthly average Arctic sea ice extent for February was the third lowest in the satellite record. Through 2015, the linear rate of decline for February extent is 2.9% per decade.

Hot Bering(s)

Figure 4. The plot shows Arctic air temperature anomalies at the 925 hPa level in degrees Celsius for February 2015.

Figure 4. The plot shows Arctic air temperature anomalies at the 925 hPa level in degrees Celsius for February 2015. Yellows and reds indicate higher than average temperatures; blues and purples indicate lower than average temperatures.

Credit: NSIDC courtesy NOAA Earth System Research Laboratory Physical Sciences Division
High-resolution image

The low ice extent in the Bering Sea and Sea of Okhotsk is linked to unusually warm conditions in the area. February air temperatures at the 925 hPa level were as much as 4 to 6 degrees Celsius (7 to 11 degrees Fahrenheit) above average in the northern Bering Sea, easternmost Siberia, and Sea of Okhotsk.

While these localized hotspots are in part driven by the low sea ice extent and the resulting large heat fluxes from the open water to the atmosphere, they are seen to be part of a broad area of unusually warm conditions extending across most of northern Eurasia, across Alaska, and into the western part of the United States. In contrast, cold and snowy conditions have persisted across the eastern half of North America. Broadly speaking, these opposing patterns of warmth and cold, along with low ice extent in the Sea of Okhotsk and Bering Sea, can be linked to an unusual jet stream pattern, with the jet lying north of its usual location over Eurasia and the North Pacific (meaning that warm air extends further north than is usual), and then plunging southwards over eastern North America.

Snow cover

Figure 5a. This snow cover anomaly map shows the difference between snow cover for February 2015, compared with average snow cover for February from 1981 to 2010.

Figure 5a. This snow cover anomaly map shows the difference between snow cover for February 2015, compared with average snow cover for February from 1981 to 2010. Areas in orange and red indicate lower than usual snow cover, while regions in blue had more snow than normal.

Credit: National Snow and Ice Data Center, courtesy Rutgers University Global Snow Lab
High-resolution image

Figure 5b. This graphs shows snow cover extent anomalies in the Northern Hemisphere for February from 1967 to 2015.

Figure 5b. This graphs shows snow cover extent anomalies in the Northern Hemisphere for February from 1967 to 2015. The anomaly is relative to the 1981 to 2010 average.

Credit: National Snow and Ice Data Center, courtesy Rutgers University Global Snow Lab
High-resolution image

This unusual jet stream pattern is clearly manifested in the pattern of Northern hemisphere snow cover for February. Snow extent was well above average over the northeastern U.S. However, the western U.S. and Northern Rockies saw less snow cover than average, especially along the Pacific coast where it has been particularly warm and severely dry. While the Tibetan Plateau saw a somewhat more extensive snow cover than average in December and January, extent for Tibet and Eurasia as a whole was below average in February. Higher-than-average snow cover in the eastern U.S. expanded and became more pronounced this month as well. All of these are continuations of the basic pattern seen in December and January, although the pattern of extensive snow over the northeastern U.S. became more pronounced this month. The low snow cover extent in much of Eurasia is consistent with the warmer-than-average conditions there as described above.

Seasonal Antarctic minimum reached

Figure 6a. This figure shows the concentration anomaly for February 2015 monthly average extent relative to the 1981 to 2010 average.  Sea Ice Index data. About the data||Credit: National Snow and Ice Data Center|High-resolution image

Figure 6a. This figure shows the concentration anomaly for February 2015 monthly average extent relative to the 1981 to 2010 average. Sea Ice Index data. About the data

Credit: National Snow and Ice Data Center
High-resolution image

Figure 6b. Monthly Antarctic February ice extent for 1979 to 2015 shows a trend of 5.0% per decade relative to the 1981 to 2010 average.

Figure 6b. Monthly Antarctic February ice extent for 1979 to 2015 shows a trend of 5.0% per decade relative to the 1981 to 2010 average.

Credit: National Snow and Ice Data Center
High-resolution image

Antarctic sea ice extent reached its annual minimum, dipping to 3.58 million square kilometers (1.38 million square miles) on February 20. This is the fourth highest summer minimum extent on record, trailing behind 2008 (3.75 million square kilometers or 1.44 million square miles, highest), 2013, and 2003. The 2014 Antarctic minimum ranked the fifth highest (3.54 million square kilometers or 1.36 million square miles). For the month as a whole, February 2015 has the sixth highest ice extent (3.8 million square kilometers or 1.46 million square miles). The sea ice extent trend for February for 1979 to 2015 shows an increase of 5.0%  per decade. However, Antarctica’s sea ice extent is highly variable. As recently as 2011, Antarctic sea ice extent was at near-record low levels for the summer minimum.

Nevertheless, the recent series of high-ice-extent minima is part of a remarkable recent uptick in extent year-round for Antarctica, dominated by extensive ice in both the Weddell Sea (south of Africa) and the Ross Sea (south of New Zealand). Sea ice in the eastern Weddell Sea presently extends several hundred kilometers further north and east of its typical extent, while ice extent in the Ross Sea is presently near average. The debate continues regarding the cause of the recent Antarctic trends, but the best explanation so far involves a combination of strengthening low pressure in the eastern Ross Sea (the Amundsen Sea Low) and the eastern Weddell Sea, and a persistently positive phase of the Southern Annular Mode. The freshening of surface seawater around Antarctica may also play a role.

Global sea ice trends

Claire Parkinson of NASA recently presented the global average (Arctic plus Antarctic) trend in sea ice extent for the period 1979 to 2013. Overall, global sea ice has declined, despite the positive trend in Antarctic extent. The annual average trend is -35,000 square kilometers (-13,500 square miles) per year, or about -1.5% per decade. The strong Arctic decline in September leads to the largest magnitude monthly trend for global sea ice in that month, at -68,000 square kilometers (-26,300 square miles) per year, or -2.6% per decade. See the NSIDC FAQ on global sea ice here.

Further reading

Parkinson, C. L. 2014. Global sea ice coverage from satellite data: annual cycle and 35-year trends. Journal of Climate, doi: 10.1175/JCLI-D-14-00605.1.