Arctic sea ice continued to expand throughout the month of October, remaining at near-average levels on the Atlantic side and below average on the Pacific side. In the Southern Hemisphere, Antarctic sea ice has declined after reaching its record maximum in October and is now nearly within two standard deviations of the long-term average.
Overview of conditions
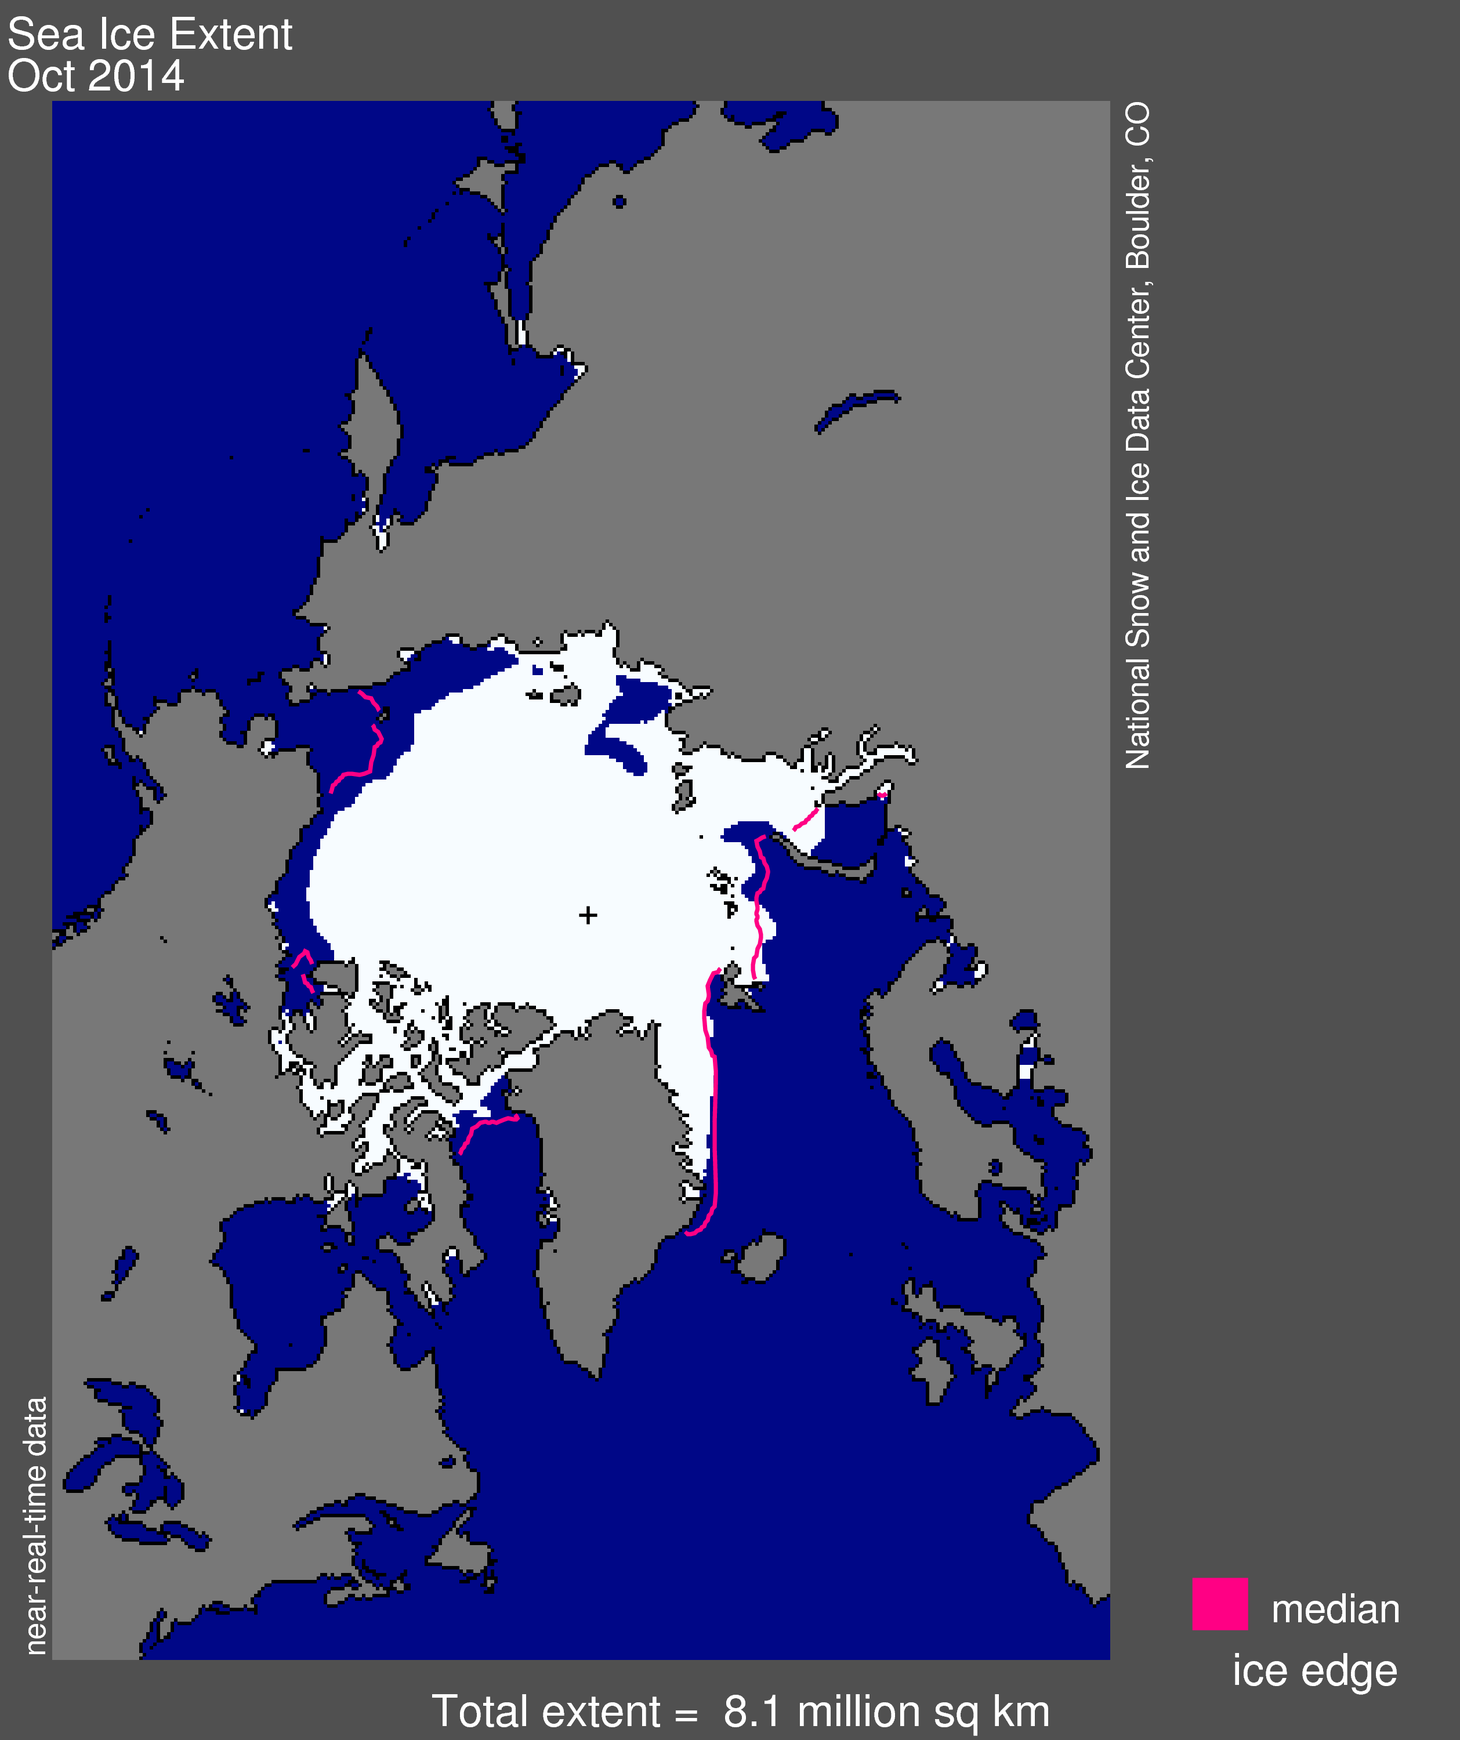
Figure 1. Arctic sea ice extent for October 2014 was 8.06 million square kilometers (3.11 million square miles). The magenta line shows the 1981 to 2010 median extent for that month. The black cross indicates the geographic North Pole. Sea Ice Index data. About the data
Credit: National Snow and Ice Data Center
High-resolution image
Sea ice extent in October averaged 8.06 million square kilometers (3.11 million square miles). This is 850,000 square kilometers (328,000 square miles) below the 1981 to 2010 long-term average of 8.91 million square kilometers (3.44 million square miles) and 1.29 million square kilometers (498,000 square miles) above the record low for the month observed in 2007.
Arctic sea ice extent continued to increase throughout the month of October. Ice extent in the Pacific side remains below average. Areas in the Beaufort Sea along the Canadian and Alaskan coasts, and in the Chukchi Sea along the coast of Siberia were still ice free at the end of October. The image of monthly average sea ice extent (Figure 1) shows a large polynya within the East Siberian Sea, but this area is now covered by ice. On the Atlantic side, extent remains at near-average levels.
Conditions in context

Figure 2. The graph above shows Arctic sea ice extent as of November 3, 2014, along with daily ice extent data for four previous years. 2014 is shown in blue, 2013 in green, 2012 in orange, 2011 in brown, and 2010 in purple. The 1981 to 2010 average is in dark gray. The gray area around the average line shows the two standard deviation range of the data. Sea Ice Index data.
Credit: National Snow and Ice Data Center
High-resolution image
Through the month of October, the Arctic gained 3.39 million square kilometers (1.31 million square miles) of ice. This is faster than the average rate of ice gain for the month of October, but slower than the rate of ice gain seen in October 2012, after the record minimum of September 2012, and other recent Octobers.
Temperatures at the 925 hPa level show that the Arctic was 1 to 4 degrees Celsius (2 to 7 degrees Fahrenheit) higher than average everywhere, except in the Kara and Barents seas where air temperatures were 1 to 3 degrees Celsius (2 to 5 degrees Fahrenheit) lower than average. Lower than average temperatures in this region were also a persistent feature of summer 2014 and helped maintain a more extensive ice cover in the region than in recent summers.
Warm conditions were partly a result of the ocean releasing the heat gained during summer back to the atmosphere. In addition, sea level pressures were higher than average over the central Arctic Ocean and the Barents Sea, reflecting the negative phase of the Arctic Oscillation .
October 2014 compared to previous years

Figure 3. Monthly October ice extent for 1979 to 2014 shows a decline of 6.9% per decade relative to the 1981 to 2010 average.
Credit: National Snow and Ice Data Center
High-resolution image
Due to the relatively rapid ice growth during October, Arctic sea ice extent for October 2014 was the 6th lowest in the satellite record. Through 2014, the linear rate of decline for October Arctic ice extent over the satellite record is 6.9% per decade.
Amplified autumn warming
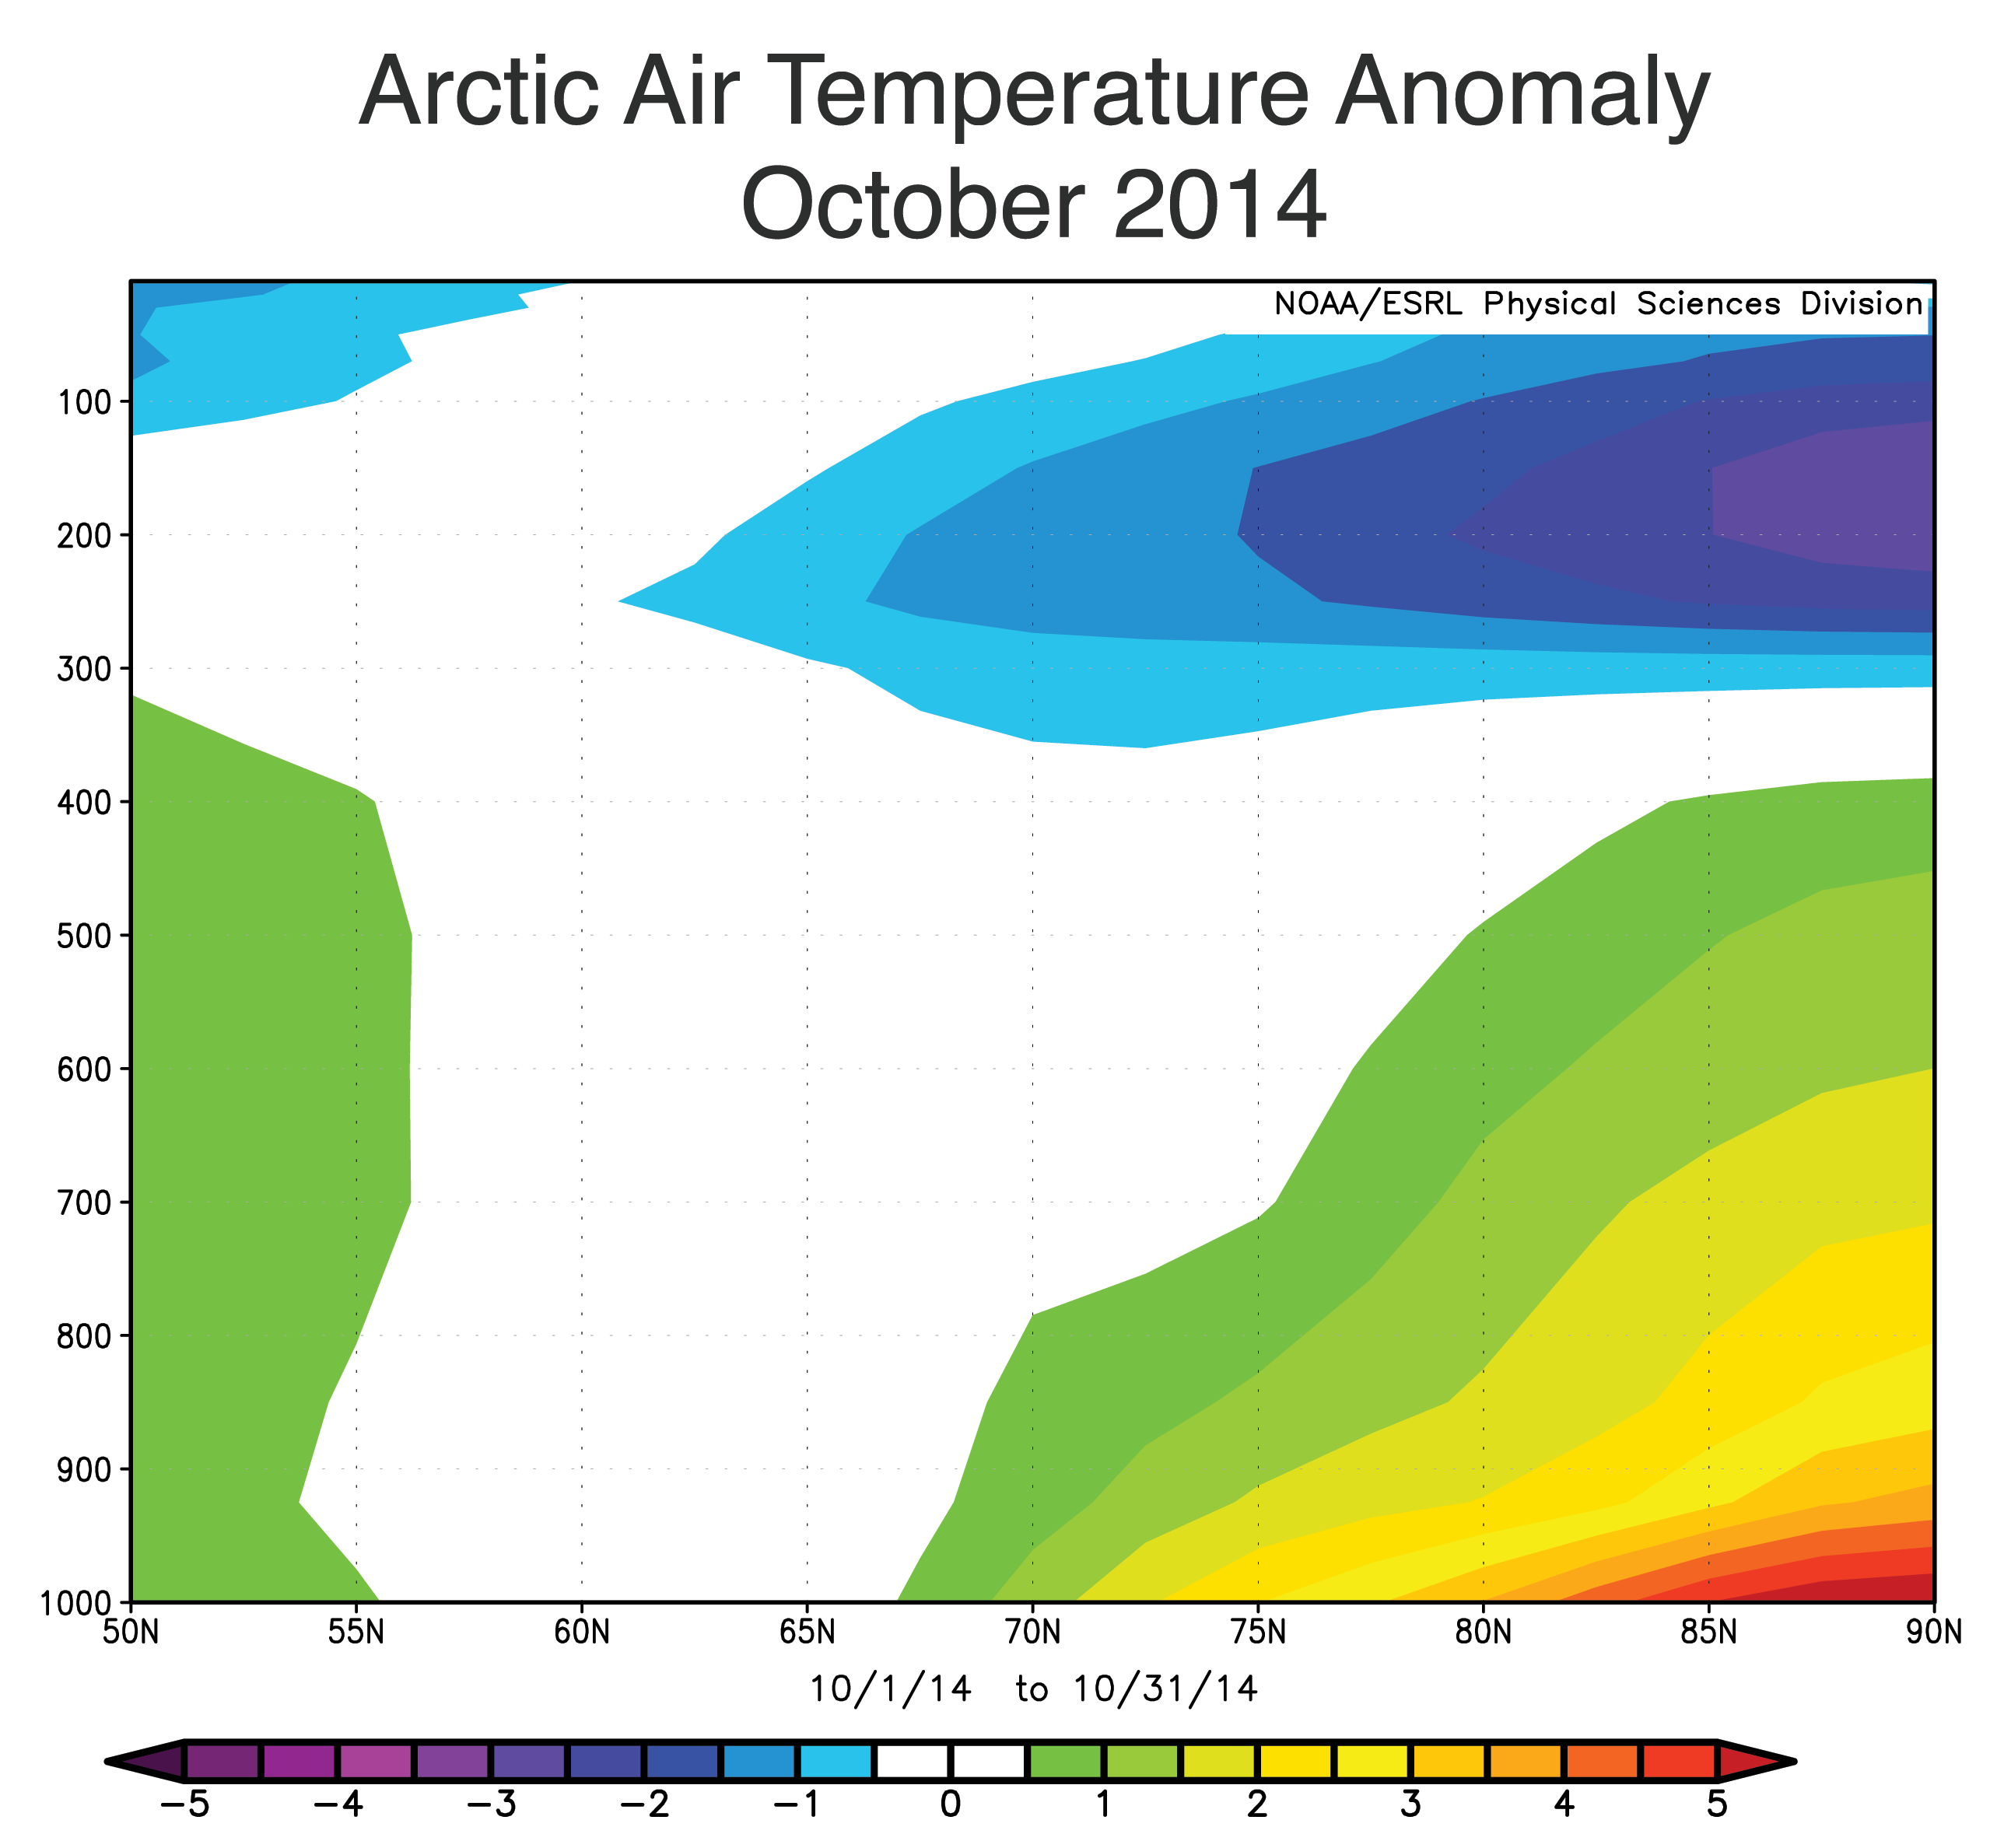
Figure 4. This figure shows average air temperature anomalies for October 2014 at each latitude from 50 North (left side of axis) to 90 North (right side of axis). The Y axis shows air pressure in millibars, indicating height above the surface.
Credit: NSIDC courtesy NOAA Earth System Research Laboratory Physical Sciences Division
High-resolution image
Projections of climate change through the rest of the century show amplified warming in the Arctic compared to the rest of the planet. While there are a number of reasons for this, sea ice loss plays a strong role. With less ice in spring and summer, the upper ocean (the top 20 meters, or 66 feet) gains more heat through absorption of solar radiation. For the ocean surface to refreeze in autumn and winter, the ocean must first lose this extra heat. This is manifested as strong surface warming over the areas of sea ice loss during autumn. While the warming is greatest near the surface, the warming can extend to a considerable height in the atmosphere.
This October shows the expected pattern of amplified warmth. Warming was greatest near the surface at high latitudes (5 degrees Celsius, or 9 degrees Fahrenheit above average) and extended upwards to the 700 hPa level, roughly 3,000 meters (9,842 feet) above the surface. This pattern is similar to that observed in October 2007 and 2009. However, in other recent years the location of the warmest surface conditions shifted further south, or did not extend as far up in the atmosphere. Such variations point to the influence of other factors, including patterns of atmospheric circulation, cloud cover, and atmospheric humidity.
Arctic sea ice and the Madden-Julian Oscillation
Variations in large-scale atmospheric circulation patterns, such as the Arctic Oscillation , are known to affect the sea ice cover. These variations alter wind patterns that affect ice motion and bring in warm or cold air that influence ice melt and growth. For example, during a positive Arctic Oscillation phase, changes in the wind field help to push ice away from the coast of Siberia, allowing new ice to form and increasing the transport of ice out of Fram Strait. In the winters of the late 1980s and early 1990s, the Arctic Oscillation was in a persistent positive phase, helping to transport a large amount of thick, multiyear ice out of the Arctic through Fram Strait and leaving behind thinner ice that more easily melted the following summers.
A new study looks at the impact of a different mode of large-scale atmospheric variability, the Madden-Julian Oscillation, which appears to impact the ice cover on a shorter 30- to 90-day time scale. The Madden-Julian Oscillation is primarily driven by convection in the tropics, but causes changes in atmospheric circulation that impact the high latitudes. The impact on sea ice was found to be stronger during the winter season than in summer. It affected both the Atlantic and Pacific sectors and was confined to the marginal ice zone. The impact on sea ice also varies regionally, often showing opposing effects, such as between the Barents and Greenland seas in winter.
Large Antarctic sea ice variability

Figure 5. This image compares Antarctic sea ice extent for September 2014 (blue line) with extent for September 1964 (red line) and August 1966 (black line). The dotted ellipse marked A shows the eastern Weddell Sea and the dotted ellipse marked B shows the eastern Ross Sea.
Credit: National Snow and Ice Data Center
High-resolution image
After reaching a new record maximum extent this September, Antarctic sea ice extent has quickly declined, and is now back to levels seen in 2013 at this time of year. While almost the entire perimeter of Antarctica’s sea ice retreated slightly, two regions showed a larger retreat after the maximum: the eastern Weddell Sea (dotted ellipse marked A in Figure 5) and the eastern Ross Sea (dotted ellipse marked B in Figure 5). Both were areas of unusually extensive sea ice cover, and they contributed significantly to the record-setting level of ice extent in September. Weather patterns thirty days after the maximum changed markedly, with persistent warm northerly winds in these areas. Along the continent’s Pacific coast (Ross Ice Shelf and northern West Antarctic Ice Sheet) air temperatures at the 925 hPa level were 4 to 6 degrees Celsius (7 to 11 degrees Fahrenheit) above average. In the eastern Weddell Sea south of Africa, temperatures were 1 to 2 degrees Celsius (2 to 4 degrees Fahrenheit) higher than average. Moreover, a series of intense storms in the first half of October dispersed an area of sea ice near the Amery Ice Shelf and the southern Indian Ocean.
We noted earlier that estimates from early satellites, such as Nimbus I and II, show some brief instances of very extensive and very reduced Antarctic sea ice. For example, in September 1964 ice extent was greater in most of the Southern Ocean than this year, the exception being the Ross Sea. Two years later, in 1966, the August extent shrank to a level smaller than any for that month in the modern satellite record. As seen in Figure 5, the largest variations between this early record and today occur around 180 degrees East in the South Pacific. This area is particularly sensitive to impacts of increased westerly winds and the Amundsen Sea Low, an atmospheric pressure pattern that tends to spread the sea ice cover northward in the Ross Sea. The change in winds and the Amundsen Sea Low over the past thirty-five years is well documented.
Reference
Henderson, G. R., B. S. Barrett, and D. M. Lafleur. Arctic sea ice and the Madden-Julian Oscillation (MJO). Climate Dynamics , October 2014, Vol. 43, Issue 7-8, pp 2185-2196.

