On September 17, Arctic sea ice reached its likely minimum extent for 2014. This is now the sixth lowest extent in the satellite record and reinforces the long-term downward trend in Arctic ice extent. Sea ice extent will now begin its seasonal increase through autumn and winter. Meanwhile, sea ice in the Antarctic has surpassed the previous record maximum extent set in 2013 and is now more than 20 million square kilometers (7.72 million square miles) for the first time in the past thirty-five years. It is too soon to determine if Antarctic sea ice has reached its annual maximum.
Please note that this is a preliminary announcement. Changing winds in the Arctic could still push ice floes together, reducing Arctic ice extent below the current yearly minimum. NSIDC scientists will release a full analysis of the Arctic melt season, and discuss the Antarctic winter sea ice growth, in early October.
Overview of conditions

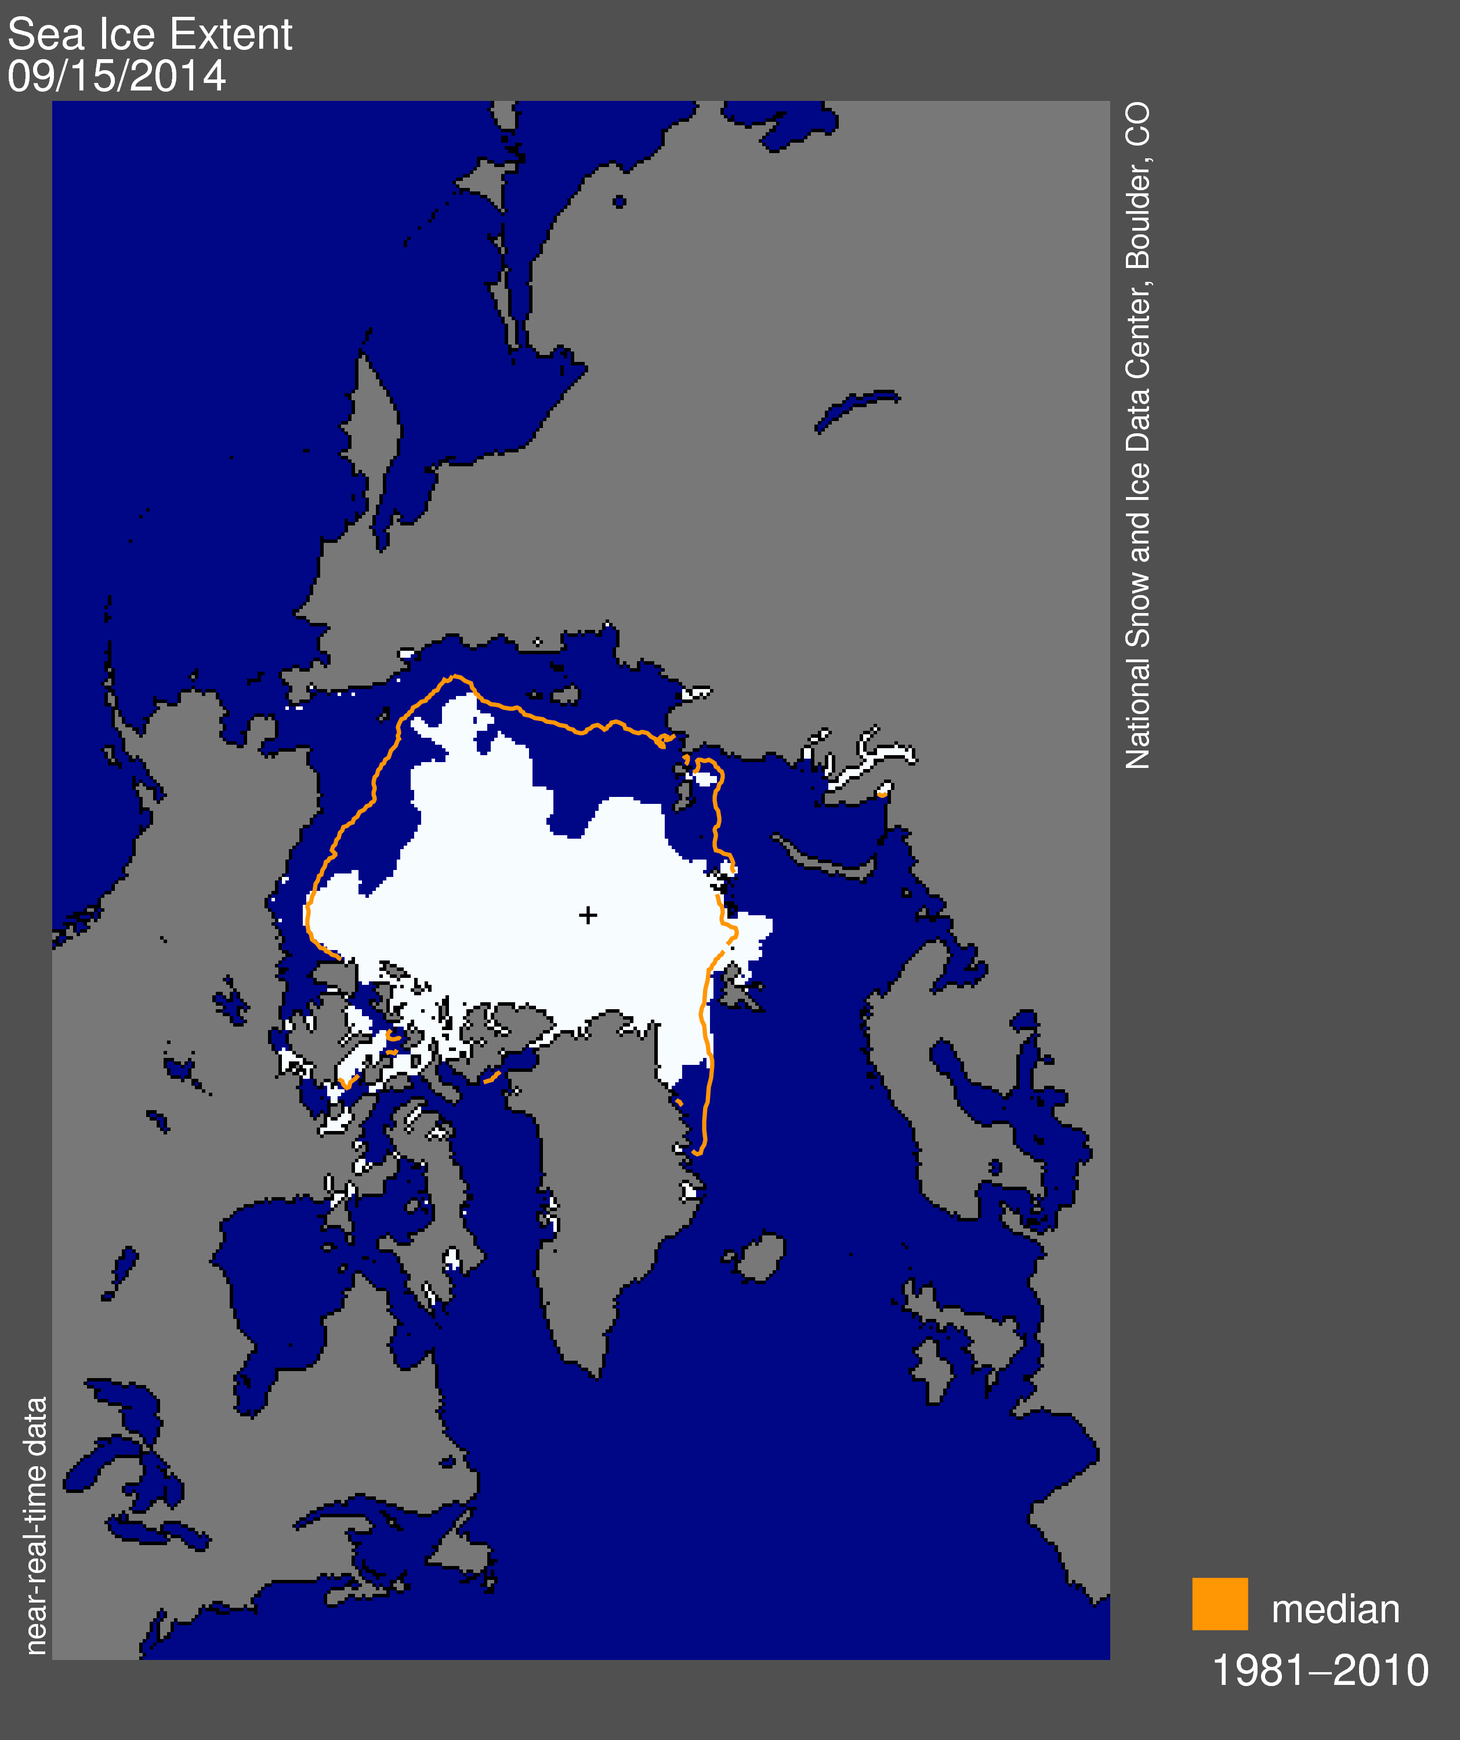
Figure 1. Arctic sea ice extent for September 17, 2014 was 5.02 million square kilometers (1.94 million square miles). The orange line shows the 1981 to 2010 average extent for that day. The black cross indicates the geographic North Pole. Sea Ice Index data. About the data
Credit: National Snow and Ice Data Center
High-resolution image
On September 17, 2014, sea ice extent dropped to 5.02 million square kilometers (1.94 million square miles). This appears to have been the lowest extent of the year. In response to the setting sun and falling temperatures, ice extent will now climb through autumn and winter. However, a shift in wind patterns or a period of late season melt could still push the ice extent lower. The minimum extent was reached two days later than the 1981 to 2010 average minimum date of September 15.
Conditions in context

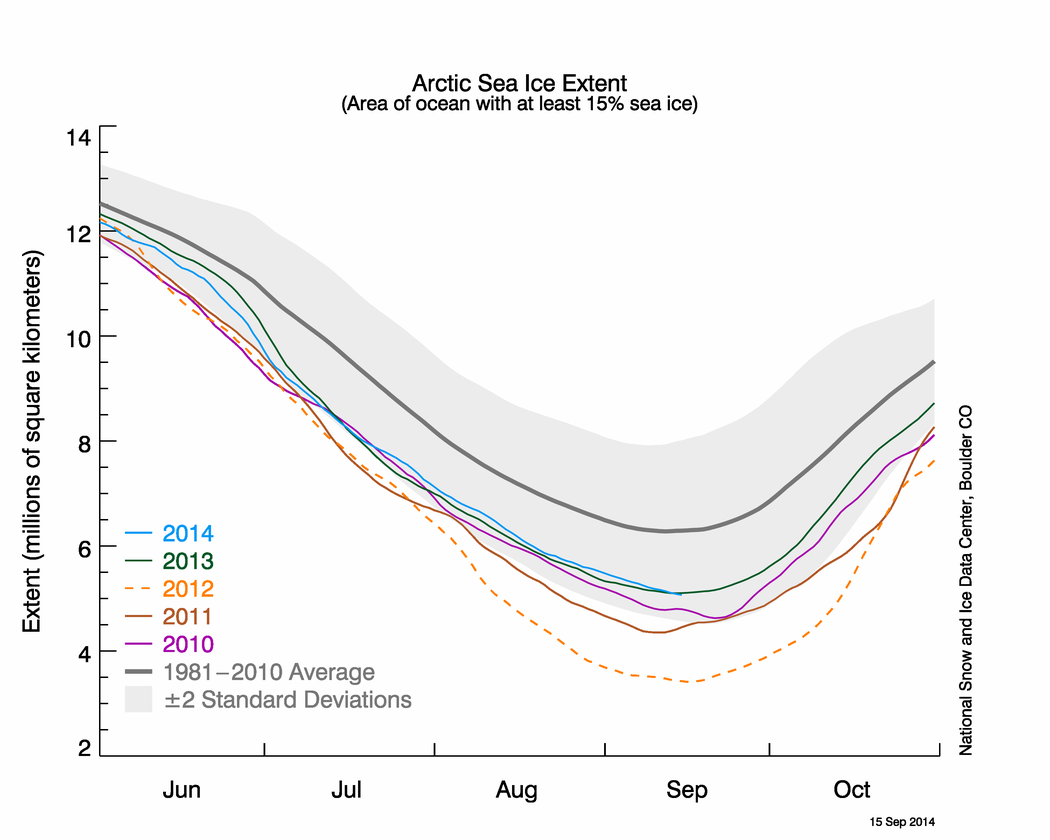
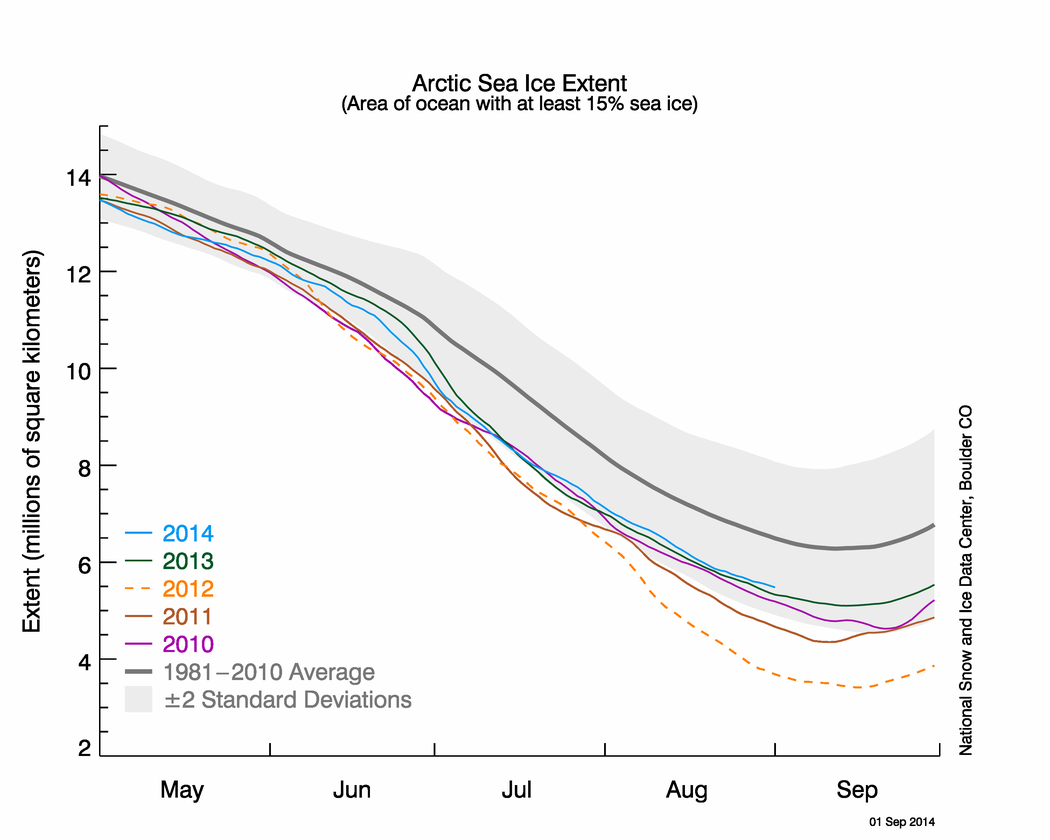
Figure 2. The graph above shows Arctic sea ice extent as of September 17, 2014, along with daily ice extent data for four previous years. 2014 is shown in blue, 2013 in green, 2012 in orange, 2011 in brown, and 2010 in purple. The 1981 to 2010 average is in dark gray. The gray area around the average line shows the two standard deviation range of the data. Sea Ice Index data.
Credit: National Snow and Ice Data Center
High-resolution image
This year’s minimum was 1.61 million square kilometers (622,000 square miles) above the record minimum extent in the satellite era, which occurred on September 16, 2012, and 1.20 million square kilometers (463,000 square miles) below the 1981 to 2010 average minimum.
Varying distribution of ice in 2014 versus 2013
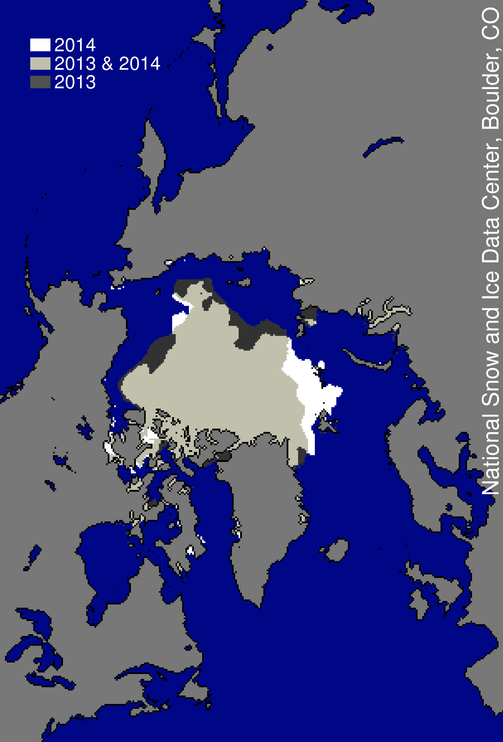
Figure 3. This image compares differences in ice-covered areas between September 17, 2014, the date of this year’s minimum, and last year’s minimum, September 13, 2013. Light gray shading indicates the region where ice occurred in both 2014 and 2013, while white and dark gray areas show ice cover unique to 2014 and to 2013, respectively. Sea Ice Index data. About the data
Credit: National Snow and Ice Data Center
High-resolution image
This year, the ice cover remained more extensive over the Barents and Kara seas compared to last year. The most notable feature was the lack of ice north of the Laptev Sea that at one point in the melt season extended beyond 85 degrees North latitude, within 550 kilometers (342 miles) of the North Pole. This year was also unusual compared to recent years in that the Northwest Passage remained closed. On the other side of the Arctic, the Northern Sea Route or Northeast Passage opened with little ice near most of the shipping route along the coast of Siberia.
Antarctic overview and conditions

Figure 4. Antarctic sea ice extent for September 20, 2014 was 20.07 million square kilometers (7.75 million square miles). The orange line shows the 1981 to 2010 average extent for that day. The black cross indicates the geographic South Pole. Sea Ice Index data. About the data
Credit: National Snow and Ice Data Center
High-resolution image
While it is too soon to tell if sea ice around Antarctica has reached its annual maximum for the winter, it remained at record high daily levels for most of the year. On September 19, the five-day average ice extent surpassed 20 million square kilometers (7.72 million square miles) for the first time in the satellite record. Ice extent is above average in almost all sections of the Antarctic, particularly in the northern Ross Sea and Indian Ocean sectors. Near-average ice extent occurs south of South America in the northern Bellingshausen Sea and in a small region south of Australia.
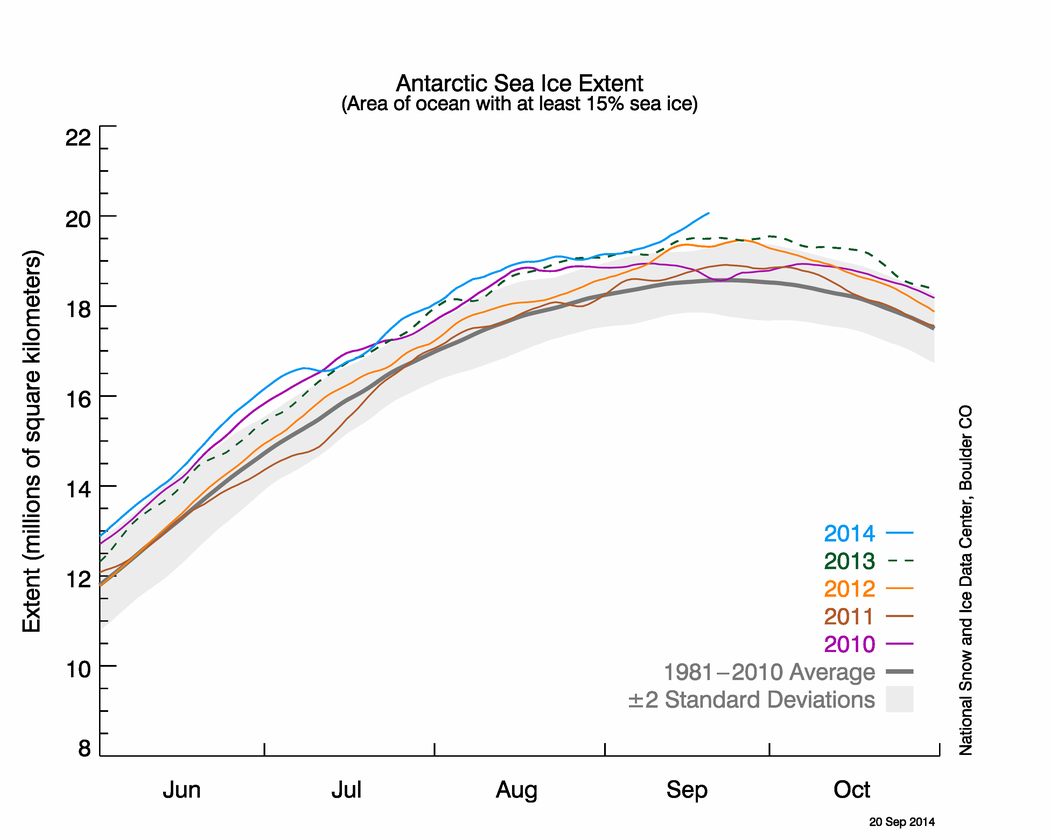
Figure 5. The graph above shows Antarctic sea ice extent as of September 20, 2014, along with daily ice extent data for four previous years. 2014 is shown in blue, 2013 in green, 2012 in orange, 2011 in brown, and 2010 in purple. The 1981 to 2010 average is in dark gray. The gray area around the average line shows the two standard deviation range of the data. Sea Ice Index data.
Credit: National Snow and Ice Data Center
High-resolution image
Previous minimum Arctic sea ice extents
| YEAR | MINIMUM ICE EXTENT | DATE | |
|---|---|---|---|
| IN MILLIONS OF SQUARE KILOMETERS | IN MILLIONS OF SQUARE MILES | ||
| 2007 | 4.17 | 1.61 | September 18 |
| 2008 | 4.59 | 1.77 | September 20 |
| 2009 | 5.13 | 1.98 | September 13 |
| 2010 | 4.63 | 1.79 | September 21 |
| 2011 | 4.33 | 1.67 | September 11 |
| 2012 | 3.41 | 1.32 | September 16 |
| 2013 | 5.10 | 1.97 | September 13 |
| 2014 | 5.02 | 1.94 | September 17 |
| 1979 to 2000 average | 6.70 | 2.59 | September 13 |
| 1981 to 2010 average | 6.22 | 2.40 | September 15 |