Since reaching its annual maximum extent on March 21, Arctic sea ice extent has declined somewhat unevenly, but has consistently been well below its average 1981 to 2010 extent. While the rate of Arctic-wide retreat was rapid through the first half of April, it has subsequently slowed down. However, ice breakup was quite early in the Bering Sea, presenting difficulties for gold dredging operations and seal hunters in the region. In the Antarctic, sea ice continued to reach record high extents.
Overview of conditions

Figure 1. Arctic sea ice extent for April 2014 was 14.14 million square kilometers (5.46 million square miles). The magenta line shows the 1981 to 2010 median extent for that month. The black cross indicates the geographic North Pole. Sea Ice Index data. About the data
Credit: National Snow and Ice Data Center
High-resolution image
Arctic sea ice extent for April 2014 averaged 14.14 million square kilometers (5.46 million square miles). This is 610,000 square kilometers (236,000 square miles) below the 1981 to 2010 average extent, and 270,000 square kilometers (104,000 square miles) above the record April monthly low, which occurred in 2007. While the rate of ice loss was rapid through the first half of April, it subsequently slowed down. The rate of ice loss averaged for the month was 30,300 square kilometers per day (11,700 square miles per day), which is slower than the average rate of 38,400 square kilometers per day (14,800 square miles per day) over the period 1981 to 2010. As of May 4, 2014, extent was below average in the Barents Sea, Sea of Okhotsk, and the Bering Sea, and slightly above average in Baffin Bay.
Conditions in context
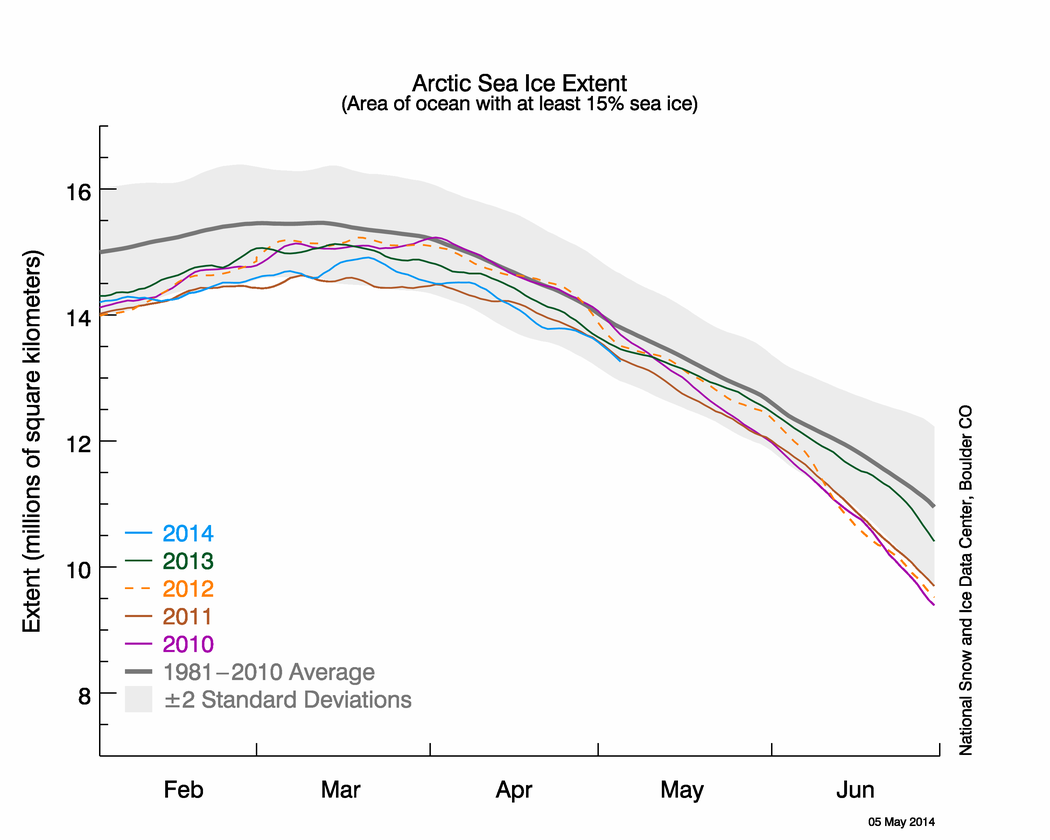
Figure 2. The graph above shows Arctic sea ice extent as of May 5, 2014, along with daily ice extent data for four previous years. 2014 is shown in blue, 2013 in green, 2012 in orange, 2011 in brown, and 2010 in purple. The 1981 to 2010 average is in dark gray. Sea Ice Index data.
Credit: National Snow and Ice Data Center
High-resolution image
Air temperatures at the 925 hPa level (roughly 3,000 feet above the surface) were from 1 to 3 degrees Celsius (2 to 5 degrees Fahrenheit) above the 1981 to 2010 average over most of the Arctic Ocean, most notably over the East Siberian Sea and in the Bering Strait region. This contrasts with the region centered over Svalbard, where temperatures were up to about 2 degrees Celsius (4 degrees Fahrenheit) below average. The atmospheric circulation pattern as averaged over the month was somewhat unusual, featuring a large area of low sea level pressure centered over the Laptev and Barents seas. Pressures in this region were up to 16 hPa below the 1981 to 2010 average. The transport of warm air from the south along the eastern side of the low pressure area is consistent with the above average temperatures over the East Siberian Sea. The Arctic Oscillation (AO) was in its positive phase through the first three weeks of April, and then regressed to a modestly negative phase.
April 2014 compared to previous years

Figure 3. Monthly April ice extent for 1979 to 2014 shows a decline of 2.4% per decade relative to the 1981 to 2010 average.
Credit: National Snow and Ice Data Center
High-resolution image
Average ice extent for April 2014 was the fifth lowest for the month in the satellite record. Through 2014, the linear rate of decline for April ice extent is -2.4% per decade relative to the 1981 to 2010 average.
Early breakup in the Bering Sea
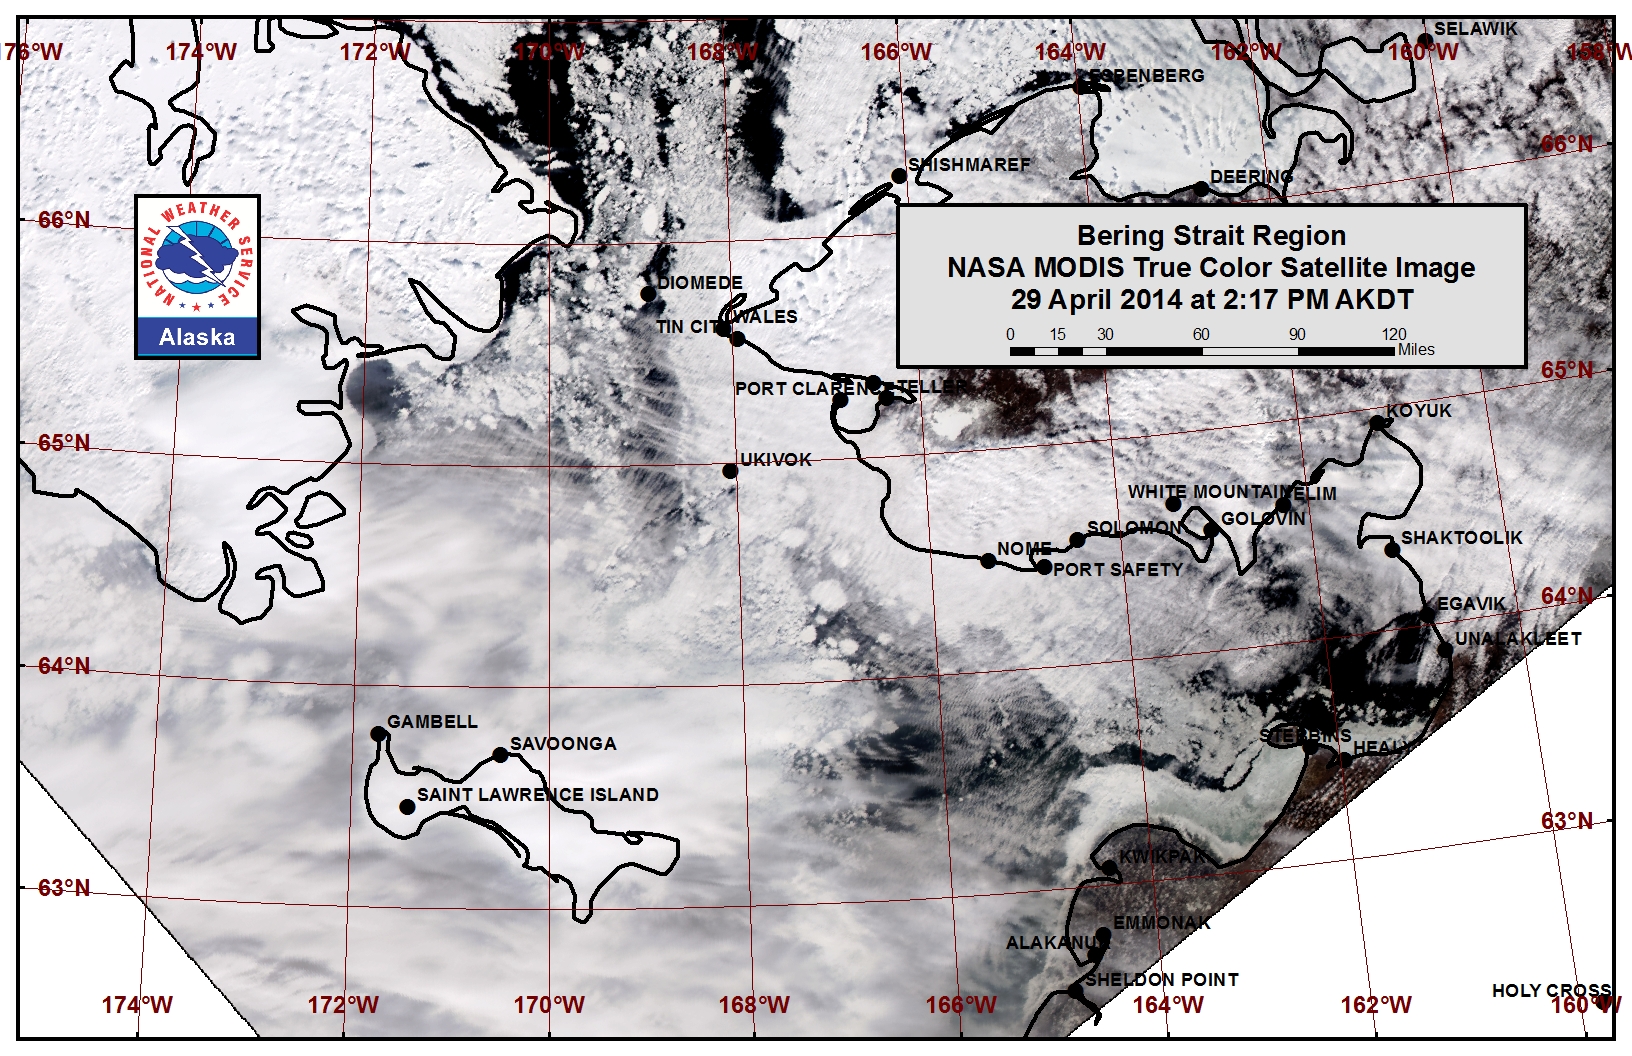
Figure 4. This image of the Bering Strait, taken by the NASA Moderate Resolution Imaging Spectroradiometer (MODIS) on April 29, shows the sea ice pack breaking up in the Bering Strait.
Credit: Sea Ice for Walrus Outlook/Land Atmosphere Near-Real Time Capability for EOS (LANCE) System, NASA/GSFC
High-resolution image
The anomalously low sea ice conditions in the Bering Sea are partially a result of low winter ice cover (see our March 3, 2014 post) and an unusually early breakup of sea ice. The Fairbanks Daily News Miner reported that the unusually early breakup of ice in the Bering Sea forced several gold dredging operations to act quickly to get their equipment off the coastal sea ice, which is used as a platform to work shallow seabed gold deposits. Seal hunters were also impacted by the early breakup, in some cases abandoning their snowmobiles on the ice as it became unstable or impassable. The snowmobiles were later recovered by boat. The SEARCH Sea Ice for Walrus Outlook provides weekly updates on sea ice conditions within the Bering Sea region for hunters, local communities and others interested in local ice conditions.
Importance of spring melt ponds
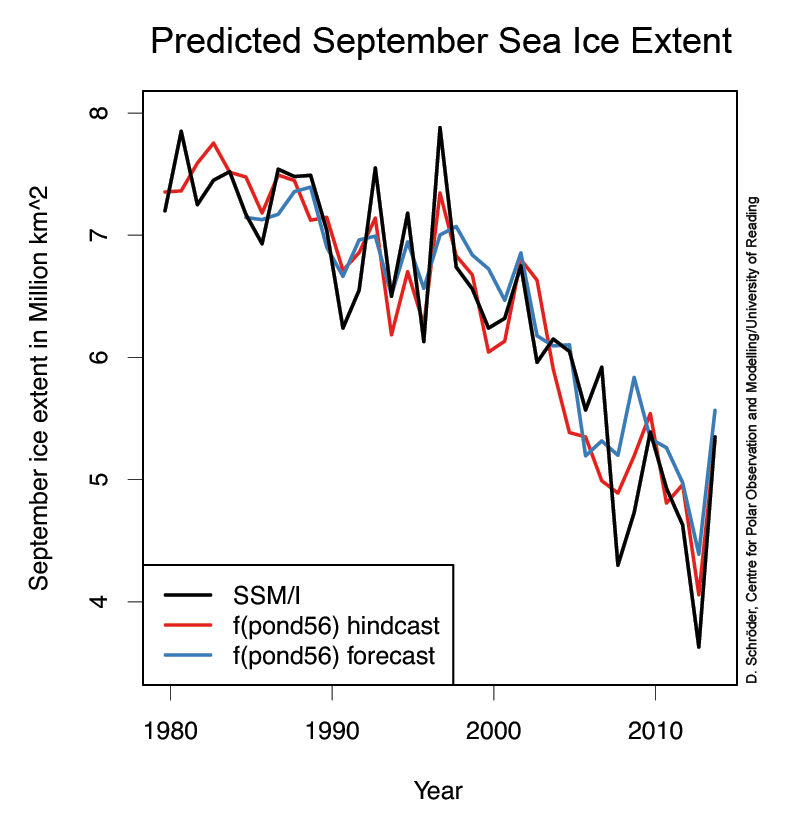
Figure 5. This graph compares actual September sea ice extent to predictions of sea ice extent based on melt pond fraction, integrated over the period 1 May – 25 June. Predicted ice extent is verified by use of SSM/I data for the period 1979–2013. Prediction error is 0.36 million square kilometers for hindcasts and 0.44 million square kilometers for forecasts.
Credit: D. Schröder et al., Nature Climate Change
High-resolution image
In spring, snow covers the sea ice on the Arctic Ocean and the albedo, or surface reflectivity, is high. As air temperatures increase, this snow begins to melt and collect on top of the sea ice. Dark melt ponds form, absorbing more energy from the sun than the adjacent bright snow and ice surfaces. A paper recently published in Nature Climate Change by Schröder et al. suggests that the fraction of melt ponds during May plays an important role in how much ice will be left at the end of the melt season in September. Melt ponds enhance the absorption of the sun’s energy by the sea ice pack, melting more snow and ice and further increasing the melt pond fraction. If melt ponds are widespread across the Arctic Ocean by mid-June and into July, under the 24-hour Arctic summer sunlight, then their effect is increased.
The size and number of melt ponds on sea ice are in part governed by the sea ice topography. First-year sea ice is smoother than multiyear ice, and the melt ponds tend to be shallower and more spread out over the first-year ice. While the melt pond fraction in May makes up about 1% of the total summer melt pond fraction, the shift to a predominantly first-year ice pack has helped to increase the number of melt ponds in spring and provides useful input into predictions for September sea ice extent.
Antarctic sea ice at record extent
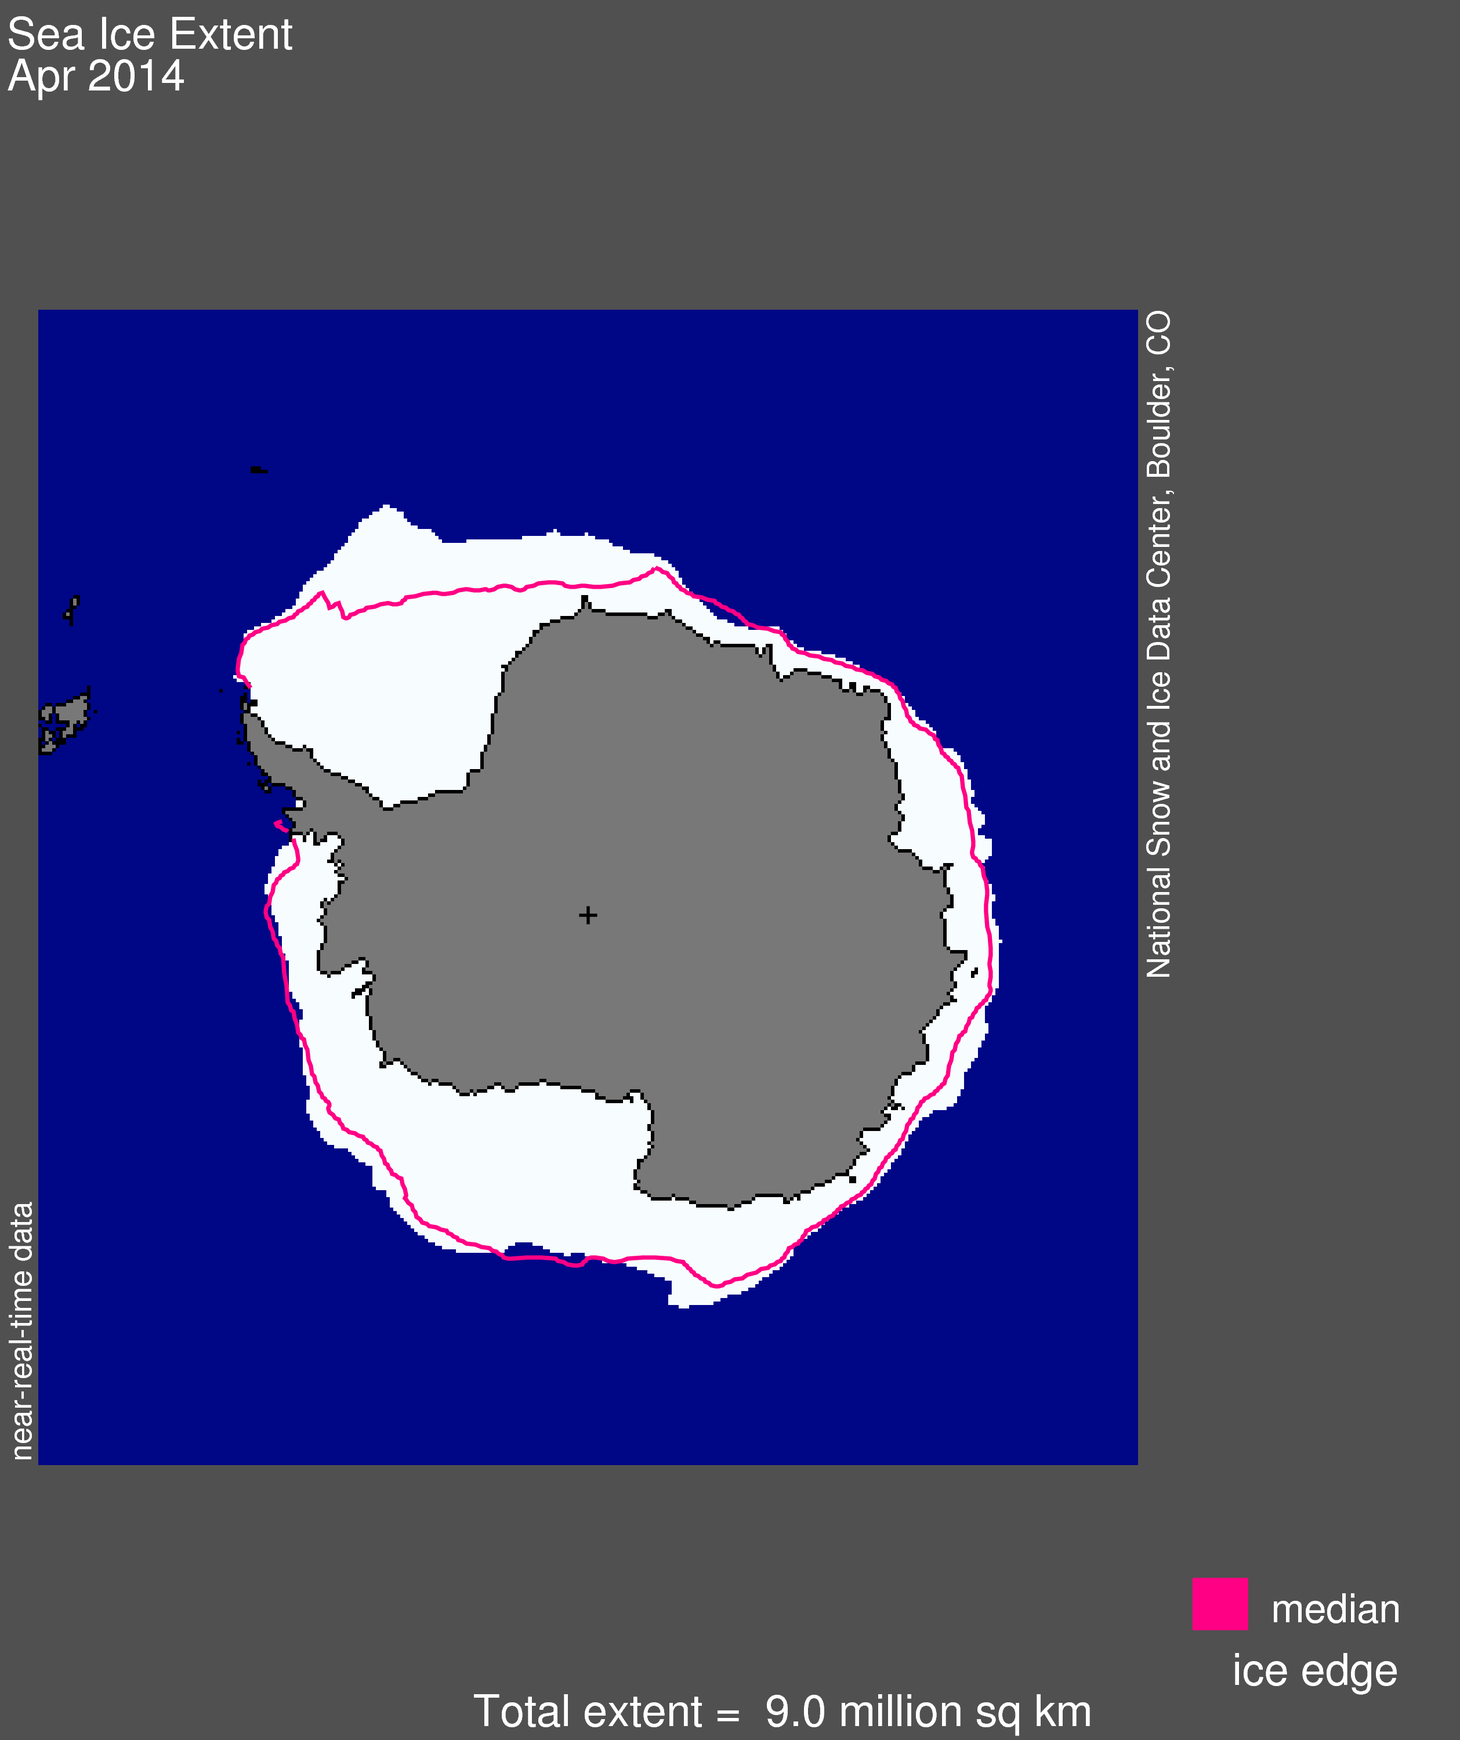
Figure 6a. Antarctic sea ice extent for April 2014 was 9.0 million square kilometers (3.5 million square miles). The magenta line shows the 1981 to 2010 median extent for that month. The black cross indicates the geographic South Pole. Sea Ice Index data. About the data
Credit: National Snow and Ice Data Center
High-resolution image
In the Southern Hemisphere, autumn is well underway, and sea ice extent is growing rapidly. Antarctic sea ice extent for April 2014 reached 9.00 million square kilometers (3.47 million square miles), the largest ice extent on record by a significant margin. This exceeds the past record for the satellite era by about 320,000 square kilometers (124,000 square miles), which was set in April 2008.
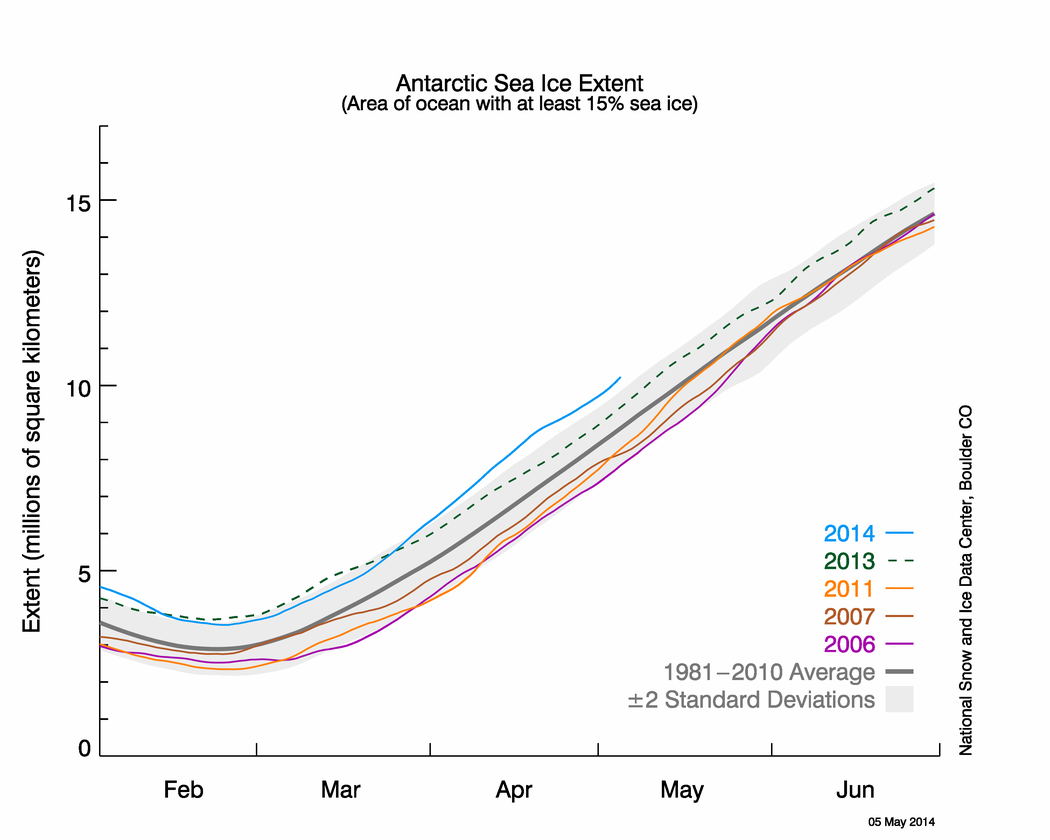
Figure 6b. The graph above shows Antarctic sea ice extent as of May 5, 2014, along with daily ice extent data for four previous years. 2014 is shown in blue, 2013 in green, 2011 in orange, 2007 in brown, and 2006 in purple. The 1981 to 2010 average is in dark gray. Sea Ice Index data.
Credit: National Snow and Ice Data Center
High-resolution image
Following near-record levels in March, a slightly higher-than-average rate of increase led to a record April ice extent, compared to the satellite record since 1978. During April, ice extent increased by an average of 112,600 square kilometers (43,500 square miles) per day. Ice extent on April 30 was a record for that day; record levels continue to be set in early May.
Sea ice extent anomalies are highest in the eastern Weddell Sea (south of the South Atlantic Ocean near longitudes 45°W to 10°E) and along a long stretch of coastline south of Australia and the southeastern Indian Ocean (spanning 40°E to 170°E longitude). These areas of unusual ice extent are following similar anomalies seen in March. April also saw significant ice growth in the Bellingshausen and Amundsen Seas, one of the few regions with lower-than-average ice extents in March. Antarctic sea ice has now been significantly above the satellite average level for 16 consecutive months.
The increased extent in the Weddell Sea region appears to be associated with a broad area of persistent easterly winds in March and April, and lower-than-average temperatures (1 to 2 degrees Celsius, or 2 to 4 degrees Fahrenheit cooler than the 1981-2010 average). A separate region of cool conditions extends over the southern Indian Ocean coastline, with temperatures as much as 2 to 3 degrees Celsius (4 to 5 degrees Fahrenheit) cooler than average. However, across much of the far Southern Hemisphere, temperatures have been above average: for example, in the southern Antarctic Peninsula, temperatures have been 1 to 2 degrees Celsius (2 to 4 degrees Fahrenheit) above average; in the southern South Pacific, temperatures have been 1.5 to 2.5 degrees Celsius (3 to 4 degrees Fahrenheit) above average, and up to 4 degrees Celsius (7 degrees Fahrenheit) above average in the area near the South Pole.
References
Schröder D., D. L. Feltham, D. Flocco, M. Tsamados. 2014. September Arctic sea-ice minimum predicted by spring melt-pond fraction. Nature Clim. Change, DOI: 10.1038/NCLIMATE2203.

