Arctic sea ice extent declined at a near-average rate through May, but overall it remained below average compared to the 1979 to 2000 average. The Arctic Oscillation (AO) varied through the month between modest positive and negative phases. Winds from the north and northwest and persistent snow cover over central Alaska made much of the month unusually cold there. The last part of the month saw much higher temperatures.
Overview of conditions
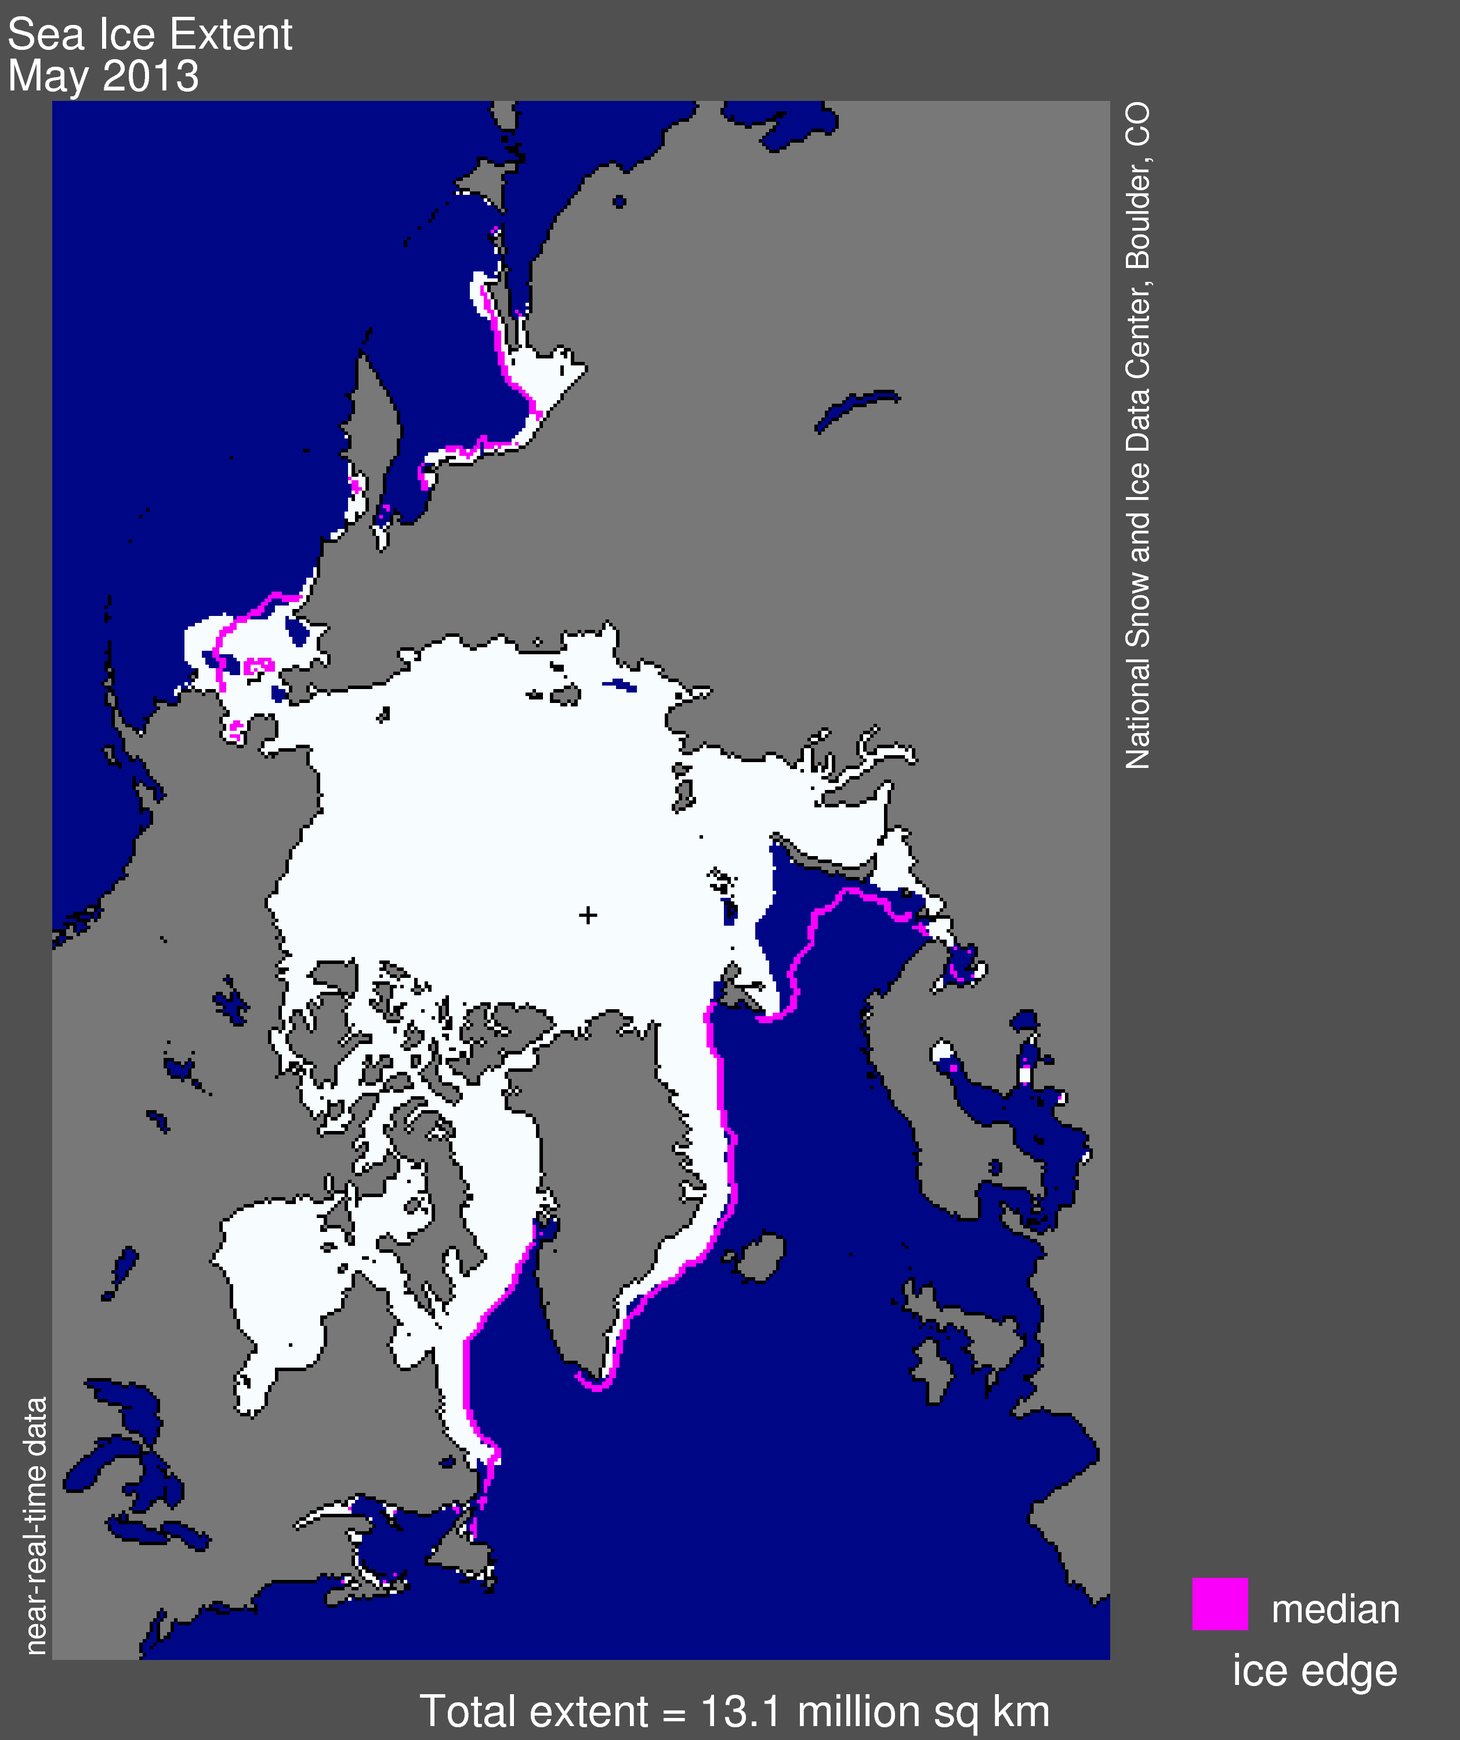
Figure 1. Arctic sea ice extent for May 2013 was 13.10 million square kilometers (5.06 million square miles). The magenta line shows the 1979 to 2000 median extent for that month. The black cross indicates the geographic North Pole. Sea Ice Index data. About the data
Credit: National Snow and Ice Data Center
High-resolution image
Sea ice extent in May 2013 averaged 13.10 million square kilometers (5.06 million square miles). This is 500,000 square kilometers (193,000 square miles) below the 1979 to 2000 average for the month. As has been the case for the past several years, ice extent was below average in the Barents Sea on the Atlantic side of the Arctic. Greater than average ice extent prevailed on the Pacific side of the Arctic in the Bering Sea and Sea of Okhotsk.
Conditions in context
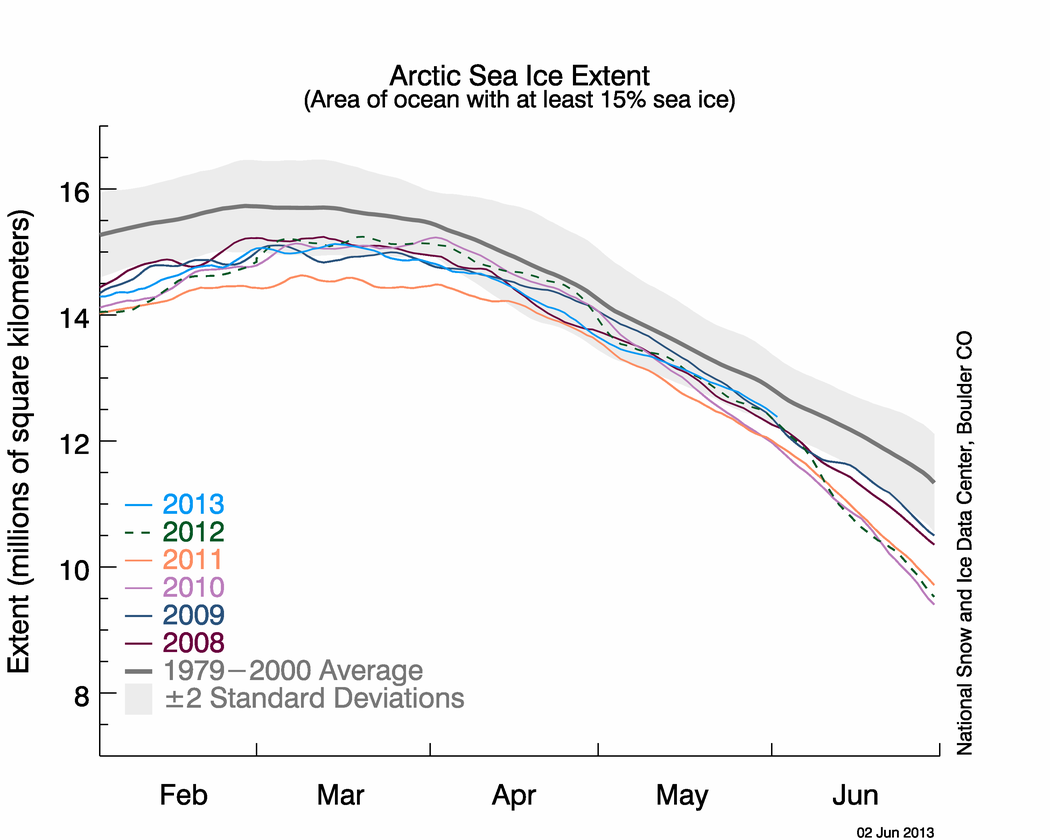
Figure 2. The graph above shows Arctic sea ice extent as of June 2, 2013, along with daily ice extent data for five previous years. 2013 is shown in blue, 2012 in green, 2011 in orange, 2010 in pink, 2009 in navy, and 2008 in purple. The 1979 to 2000 average is in dark gray. The gray area around this average line shows the two standard deviation range of the data. Note: 2011 was inadvertently omitted from this graph; corrected June 17. Sea Ice Index data.
Credit: National Snow and Ice Data. High resolution image
The AO varied through the month between modest positive and negative phases. However, May was characterized by a broad region of unusually low pressure covering much of the western Arctic, namely the Beaufort, Chukchi, and East Siberian seas. Earlier large-scale fracturing of the sea ice off the northeast coast of Alaska and north of the Canadian Archipelago mentioned in our past post was linked to a pattern of high pressure over the Arctic and a strongly negative phase of the AO.
There are several open water areas, or polynyas, along the Arctic coast, as is typical for this time of year. Small patches of open water are present along the Laptev Sea coast north of Russia, and at the northern end of Baffin Bay. These will expand as summer melting and warmer conditions progress in the Arctic.
May 2013 compared to previous years

Figure 3. Monthly May ice extent for 1979 to 2013 shows a decline of -2.24 percent per decade.
Credit: National Snow and Ice Data Center
High-resolution image
May 2013 was the tenth lowest May in the satellite record, 390,000 square kilometers (151,000 square miles) above the record low of 12.58 million square kilometers (4.86 million square kilometers) in 2004.*
Through the month of May this year, extent declined at an average rate of 36,400 square kilometers (14,100 square miles) per day, slower than the 1979 to 2000 average of 44,100 square kilometers (17,000 square miles) per day.
*Note: We originally stated that the record low had occurred in May 2011. After reviewing the data, we corrected this statement. See the Sea Ice Index for data on past May ice extent.
Snow cover update
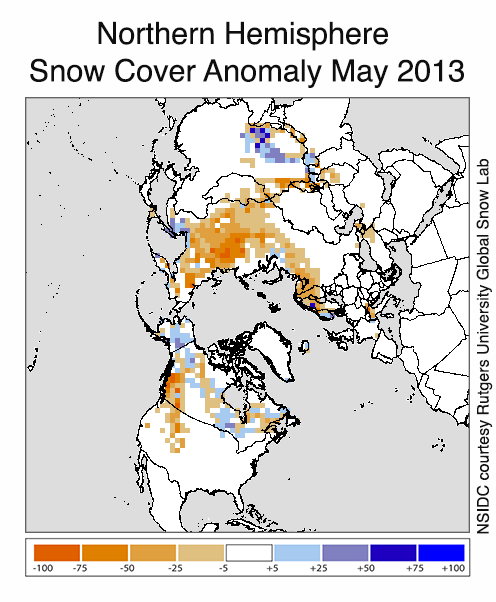
Figure 4. This snow cover anomaly map shows the difference between snow cover for May 2013, compared with average snow cover for May from 1971 to 2000. Areas in orange and red indicate lower than usual snow cover, while regions in blue had more snow than normal.
Credit: National Snow and Ice Data Center, courtesy Rutgers University Global Snow Lab
High-resolution image
Monthly snow cover anomaly data from the Rutgers University Global Snow Lab show that snow cover for the month of May was significantly low in eastern Siberia, northern Europe, and the Rocky Mountains in North America. Data also show a few greater-than-average regions in Alaska—contributing to the lower temperatures there—and on the Tibetan Plateau.
Weekly and daily data from the Global Snow Lab show that May began with greater-than-average snow cover in Tibet and the Great Plains of Canada and the United States. By the end of the month, however, snow extent was near average to lower than average throughout the Northern Hemisphere, and much lower than average in northeastern Siberia. Overall, snow cover in May 2013 was the lowest on record in forty-seven years of data for Eurasia, and third lowest overall for the Northern Hemisphere, trailing only 2012 and 2010.
Chilly in Alaska

Figure 5. This image shows air temperature anomalies at the 925 hPa level averaged for May 2013, compared to averages over the period 1981 to 2010. Temperatures were lower than average over Alaska, while temperatures across much of Siberia were above average.
Credit: NSIDC courtesy NOAA Earth System Research Laboratory Physical Sciences Division
High-resolution image
Lower than average temperatures were the rule this past month for both Greenland and Alaska, while temperatures across much of Siberia were above average. Temperatures over central Alaska at the 925 hPa level were 4 to 5 degrees Celsius (7 to 9 degrees Fahrenheit) colder than usual, making this one of the coldest springs on record for cities like Fairbanks. These low temperatures can be linked to winds from the north and northwest over central Alaska and persistent snow cover. However, the end of the month saw much higher temperatures, reaching more than 80 degrees Fahrenheit (27 degrees Celsius) in Fairbanks.
Because of the low temperatures, ice on the Tanana River, which runs through Fairbanks, Alaska, broke up on May 20 at 2:41 p.m.—the latest date and time on a record which extends for nearly a century. Ice break-up has been carefully recorded at the town of Nenana, about 70 kilometers (44 miles) downstream on the Tanana River from Fairbanks, by timing the tipping of a large tripod erected on the river ice. This is a matter of some importance for Alaskans, as there is a large statewide lottery based on picking the exact time of ice break-up. In most years, winning this lottery requires picking the time to the precise minute of tipping. Congratulations to Warren and Yvonne Snow, for your excellent climate forecasting (and on having a wonderful last name)!

