Arctic sea ice reached its annual maximum extent on March 18, after reaching an initial peak early in the month and declining briefly. Ice extent for the month as a whole was higher than in recent years, but still below average.
As the melt season begins, researchers look at a variety of factors that may contribute to summer ice melt. While the maximum extent occurred slightly later than average, the new ice growth is very thin and likely to melt quickly. Ice age data indicate that despite the higher extent compared to recent years, the winter sea ice continues to be dominated by younger and thinner sea ice.
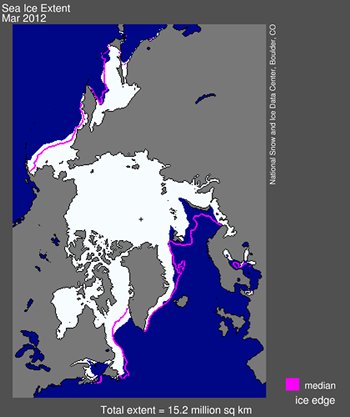
Figure 1. Arctic sea ice extent for March 2012 was 15. 21 million square kilometers (5.87 million square miles). The magenta line shows the 1979 to 2000 median extent for that month. The black cross indicates the geographic North Pole. Sea Ice Index data. About the data
Credit: National Snow and Ice Data Center
High-resolution image
Overview of Conditions
Arctic sea ice extent in March 2012 averaged 15.21 million square kilometers (5.87 million square miles). Ice extent this March ranked ninth lowest out of the 34 years of satellite data for the month, but it was the highest March average ice extent since 2008 and one of the higher March extents in the past decade. Ice extent was 530,000 kilometers (205,000 square miles) below the 1979 to 2000 average extent, and 780,000 square kilometers (301,000 square miles) above the record low for the month, which happened in 2006.
Ice cover remained extensive in the Bering Sea, where it has been above average all winter. Ice extent was also higher than average in Baffin Bay, between Greenland and Canada, and the Sea of Okhotsk, east of Russia. These conditions stemmed from a combination of wind patterns and low temperatures. Air temperatures were 6 to 8 degrees Celsius (11 to 14 degrees Fahrenheit) below average over the Bering Sea, Baffin Bay, and parts of the Sea of Okhotsk, at the 925 millibar level (about 3,000 feet above sea level). View a map of Arctic regions.
In the Kara Sea, where ice extent had been below average during January and February, ice extent rebounded to near-average levels in March. Winds that had been pushing the ice cover back shifted, allowing areas of open water in the Kara Sea to freeze over and the ice to spread out. Ice extent in the Barents Sea remained well below normal. In both the Barents and Kara seas, temperatures remained above normal by 4 to 6 degrees Celsius (7 to 11 degrees Fahrenheit).
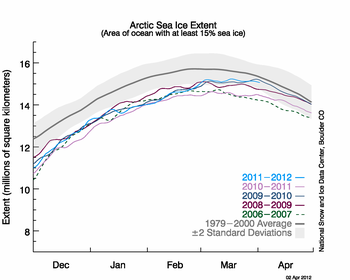
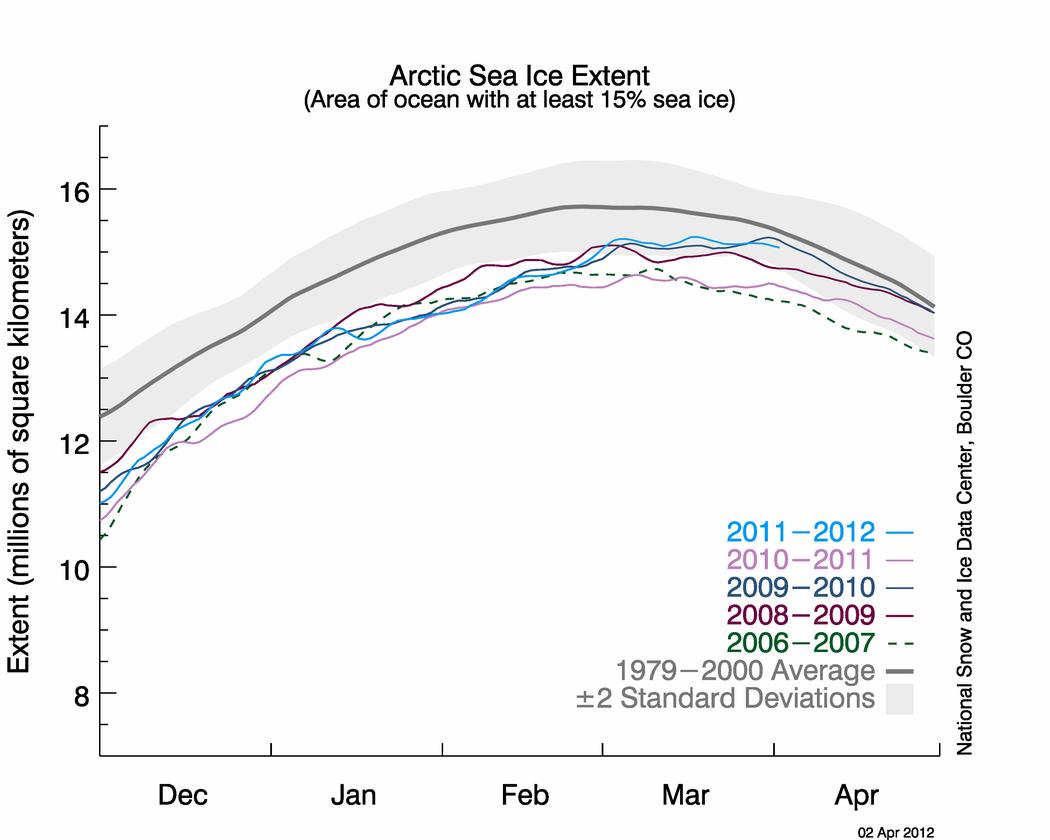
Figure 2. The graph above shows daily Arctic sea ice extent as of April 2, 2012, along with the ice extents for the previous four years. The current year is shown in light blue, 2010-11 is in pink, 2009-10 in dark blue, 2008-09 is in purple, and 2006-2007, the year with the record low minimum, is dashed green. The gray area around the average line shows the two standard deviation range of the data.Sea Ice Index data.
Credit: National Snow and Ice Data Center
High-resolution image
Conditions in context
Overall, the Arctic gained 140,000 square kilometers (54,000 square miles) of ice during March. Typically, March has been a month of net ice loss (an average of 260,000 square kilometers [100,000 square miles] for 1979 to 2000), but the last three Marches have had net ice growth. At its maximum extent on March 18, Arctic sea ice extent was within two standard deviations of the average, a measure that scientists look at as an estimate of the natural range of variability for the data.
Over the past thirty years of satellite data, the day of the maximum has varied by over six weeks, occurring as early as mid-February and as late as the end of March. However, even with so much variability, there is a small trend towards later maximum ice extents. This year’s maximum ice extent continued that trend, occurring 12 days later than average.
It is not clear why the maximum ice extent would happen later, given that in general, ice extent is decreasing. One possibility is that the lower winter ice extents might make it easier for ice to continue growing later in the season. With lower winter extents, a late cold snap or northerly wind could spread ice southward over ocean that would normally be ice-covered at that point. Researchers do not expect the late maximum ice extent to strongly influence summer melt. The ice that grew late this winter is quite thin, and will melt rapidly as the sun rises higher in the sky and the air and water get warmer.
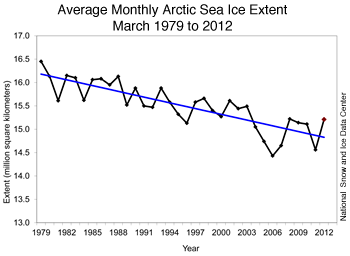
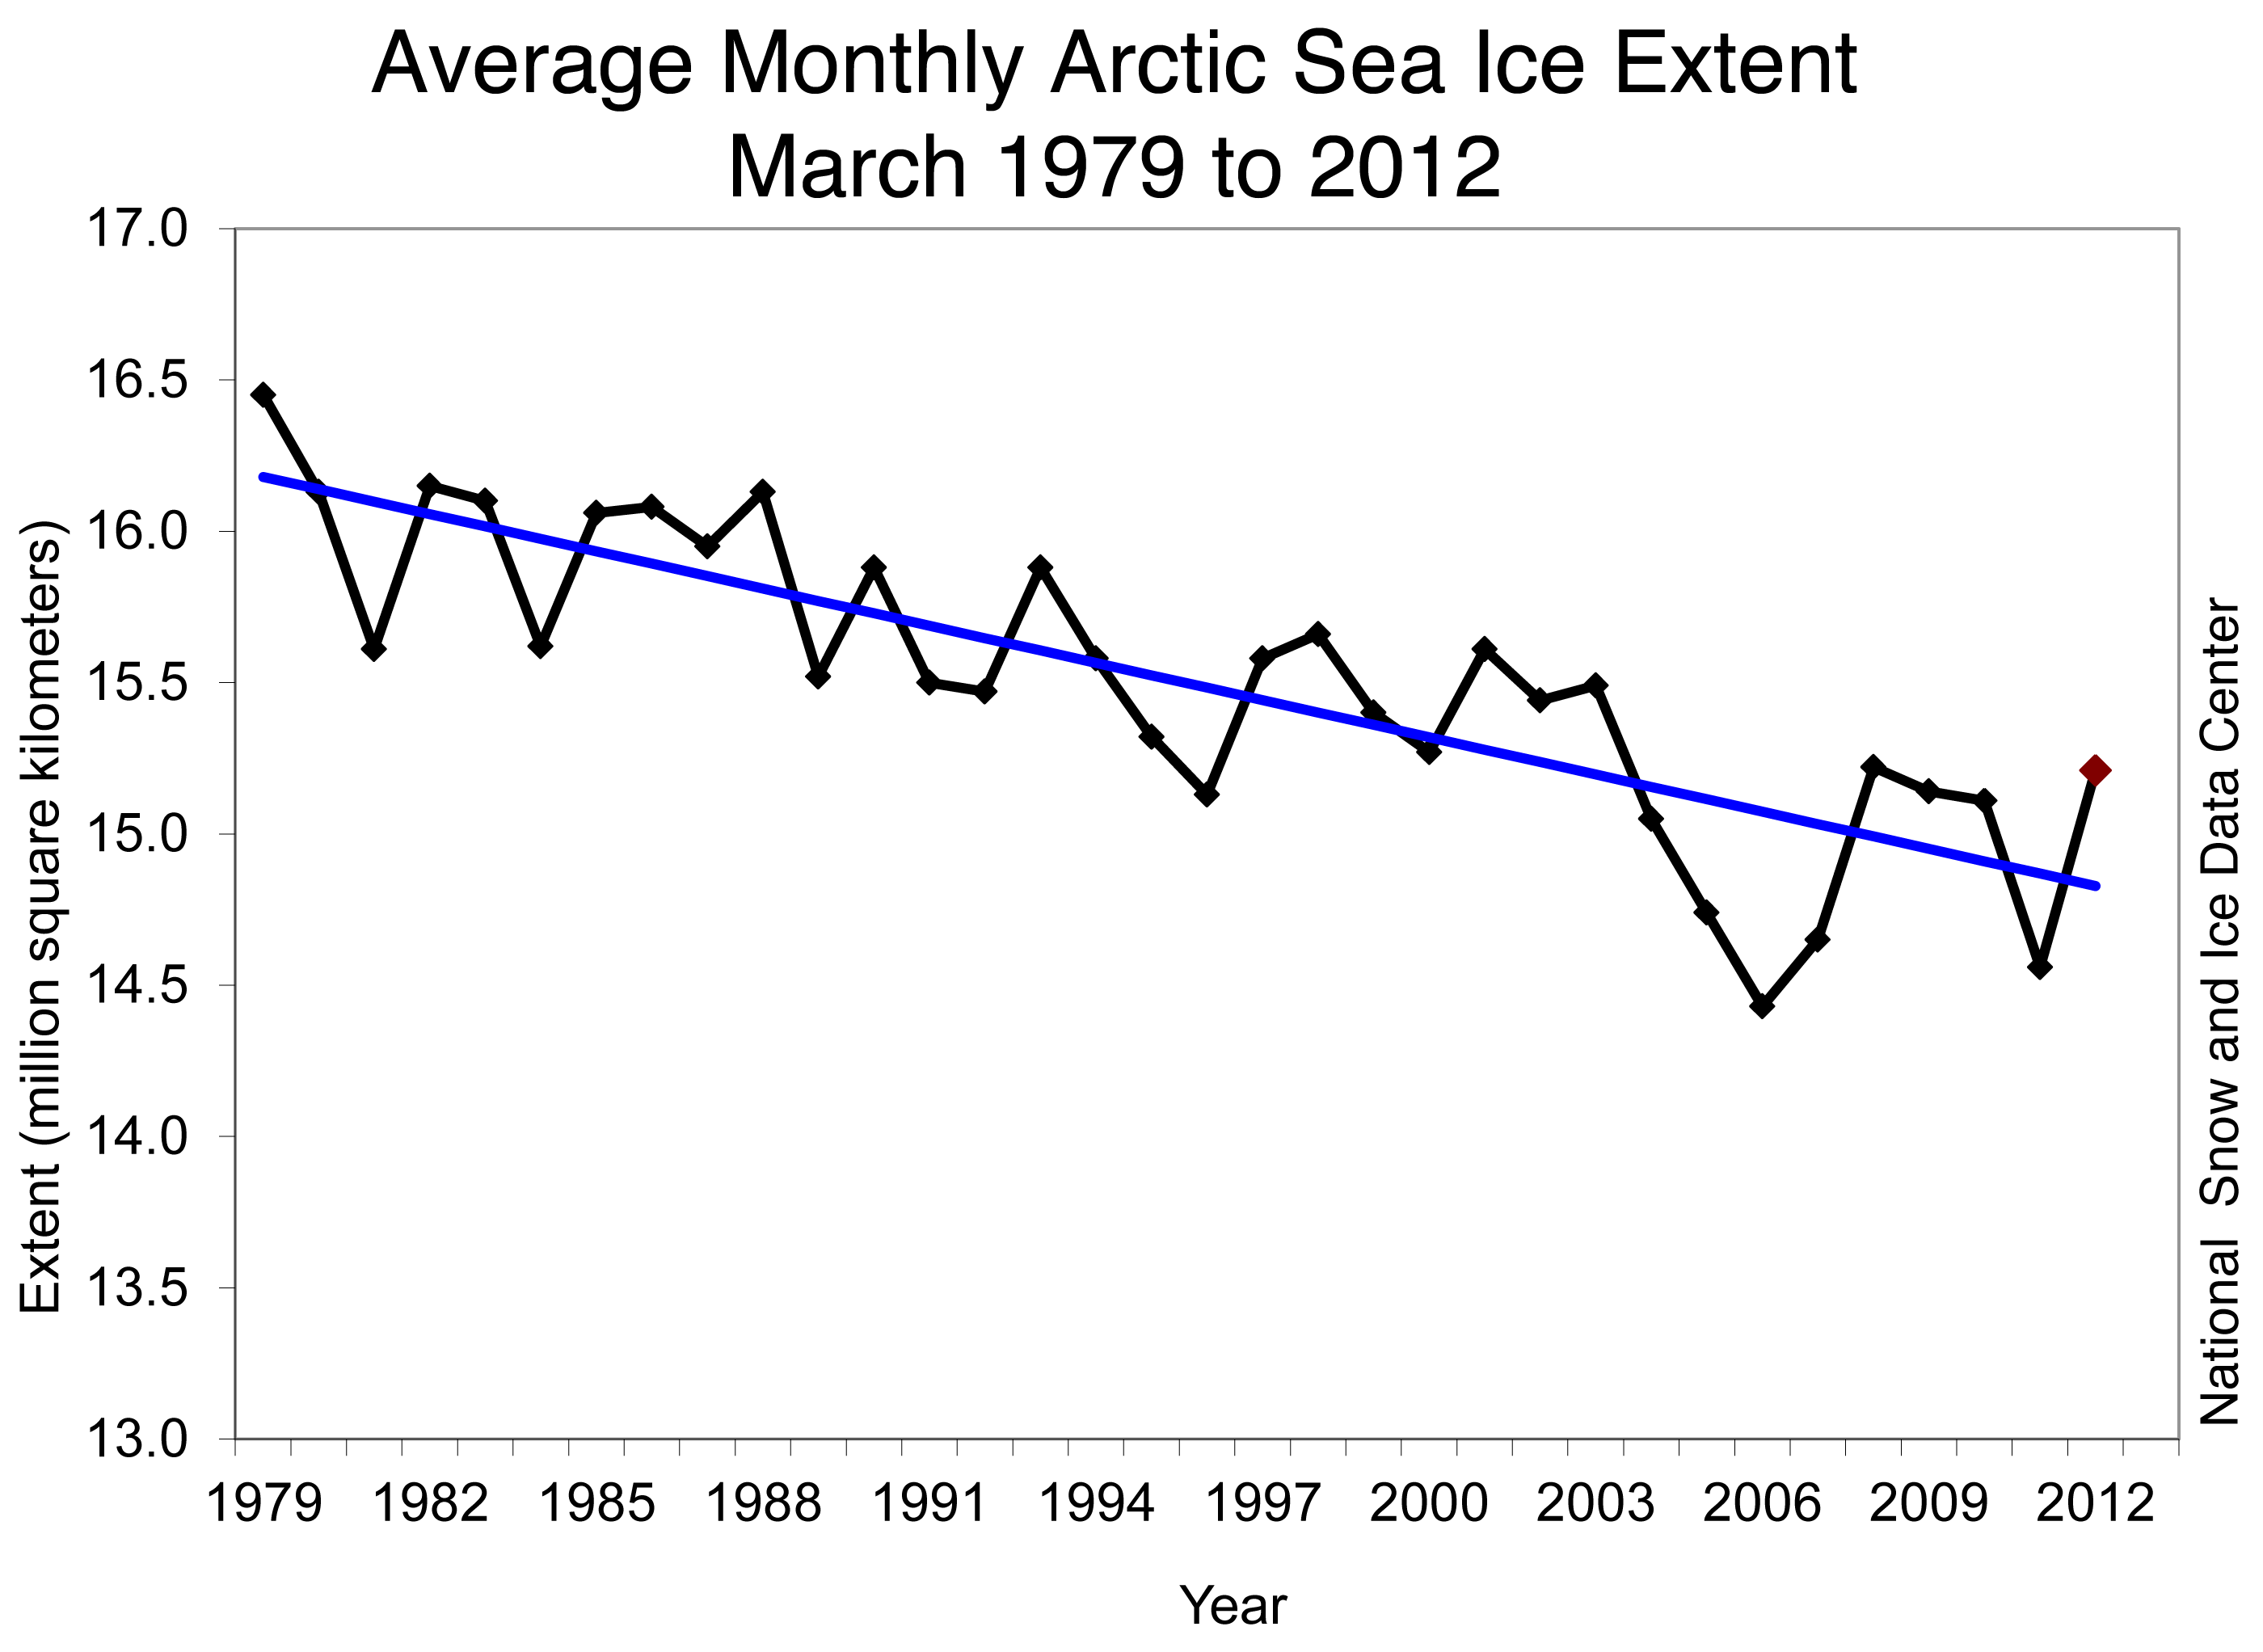
Figure 3. Monthly March ice extent for 1979 to 2012 shows a decline of 2.6% per decade.
Credit: National Snow and Ice Data Center
High-resolution image
March 2012 compared to past years
Arctic sea ice extent for March 2012 was the 9th lowest in the satellite record, but the highest since 2008 and one of the highest March extents in the past decade. Including the year 2012, the linear rate of decline for March ice extent over the satellite record is 2.6% per decade.
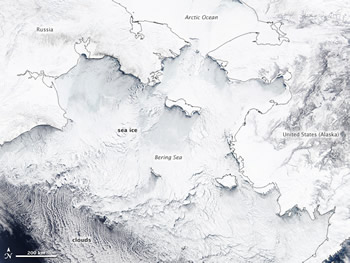
Figure 4. This image, from the NASA Moderate Resolution Imaging Spectroradiometer (MODIS), shows extensive sea ice cover in the Bering Sea on March 18, 2012. For more details and a full-resolution image, visit the NASA Earth Observatory Web site.
Credit:NASA image by Rob Simmon based on data from Jeff Schmaltz, NASA GSFC.
High-resolution image
High ice extent in the Bering Sea
In the Bering Sea, off Alaska, ice extent reached a record high for the month of March. Persistent winds pushed the sea ice southward and froze more seawater into ice.
As winds from the north pushed Arctic ice southward through the Bering Strait, the ice locked together and formed a structurally continuous band known as an ice arch, which acts a bit like a keystone arch in a building. The ice arch temporarily held back the ice behind it, but as the winds continued, the arch failed along its southern edge, and ice cascaded south through the strait into the Bering Sea. Sea ice also piled up on the northern coast of St. Lawrence Island, streaming southward on either side of it.
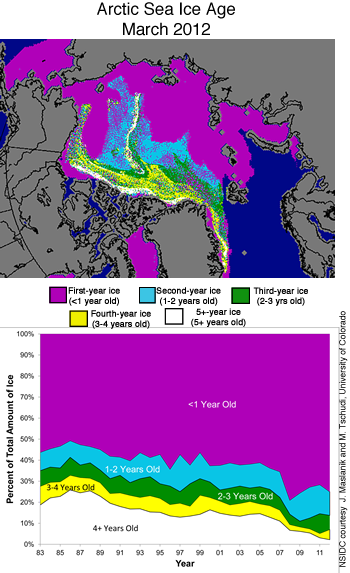
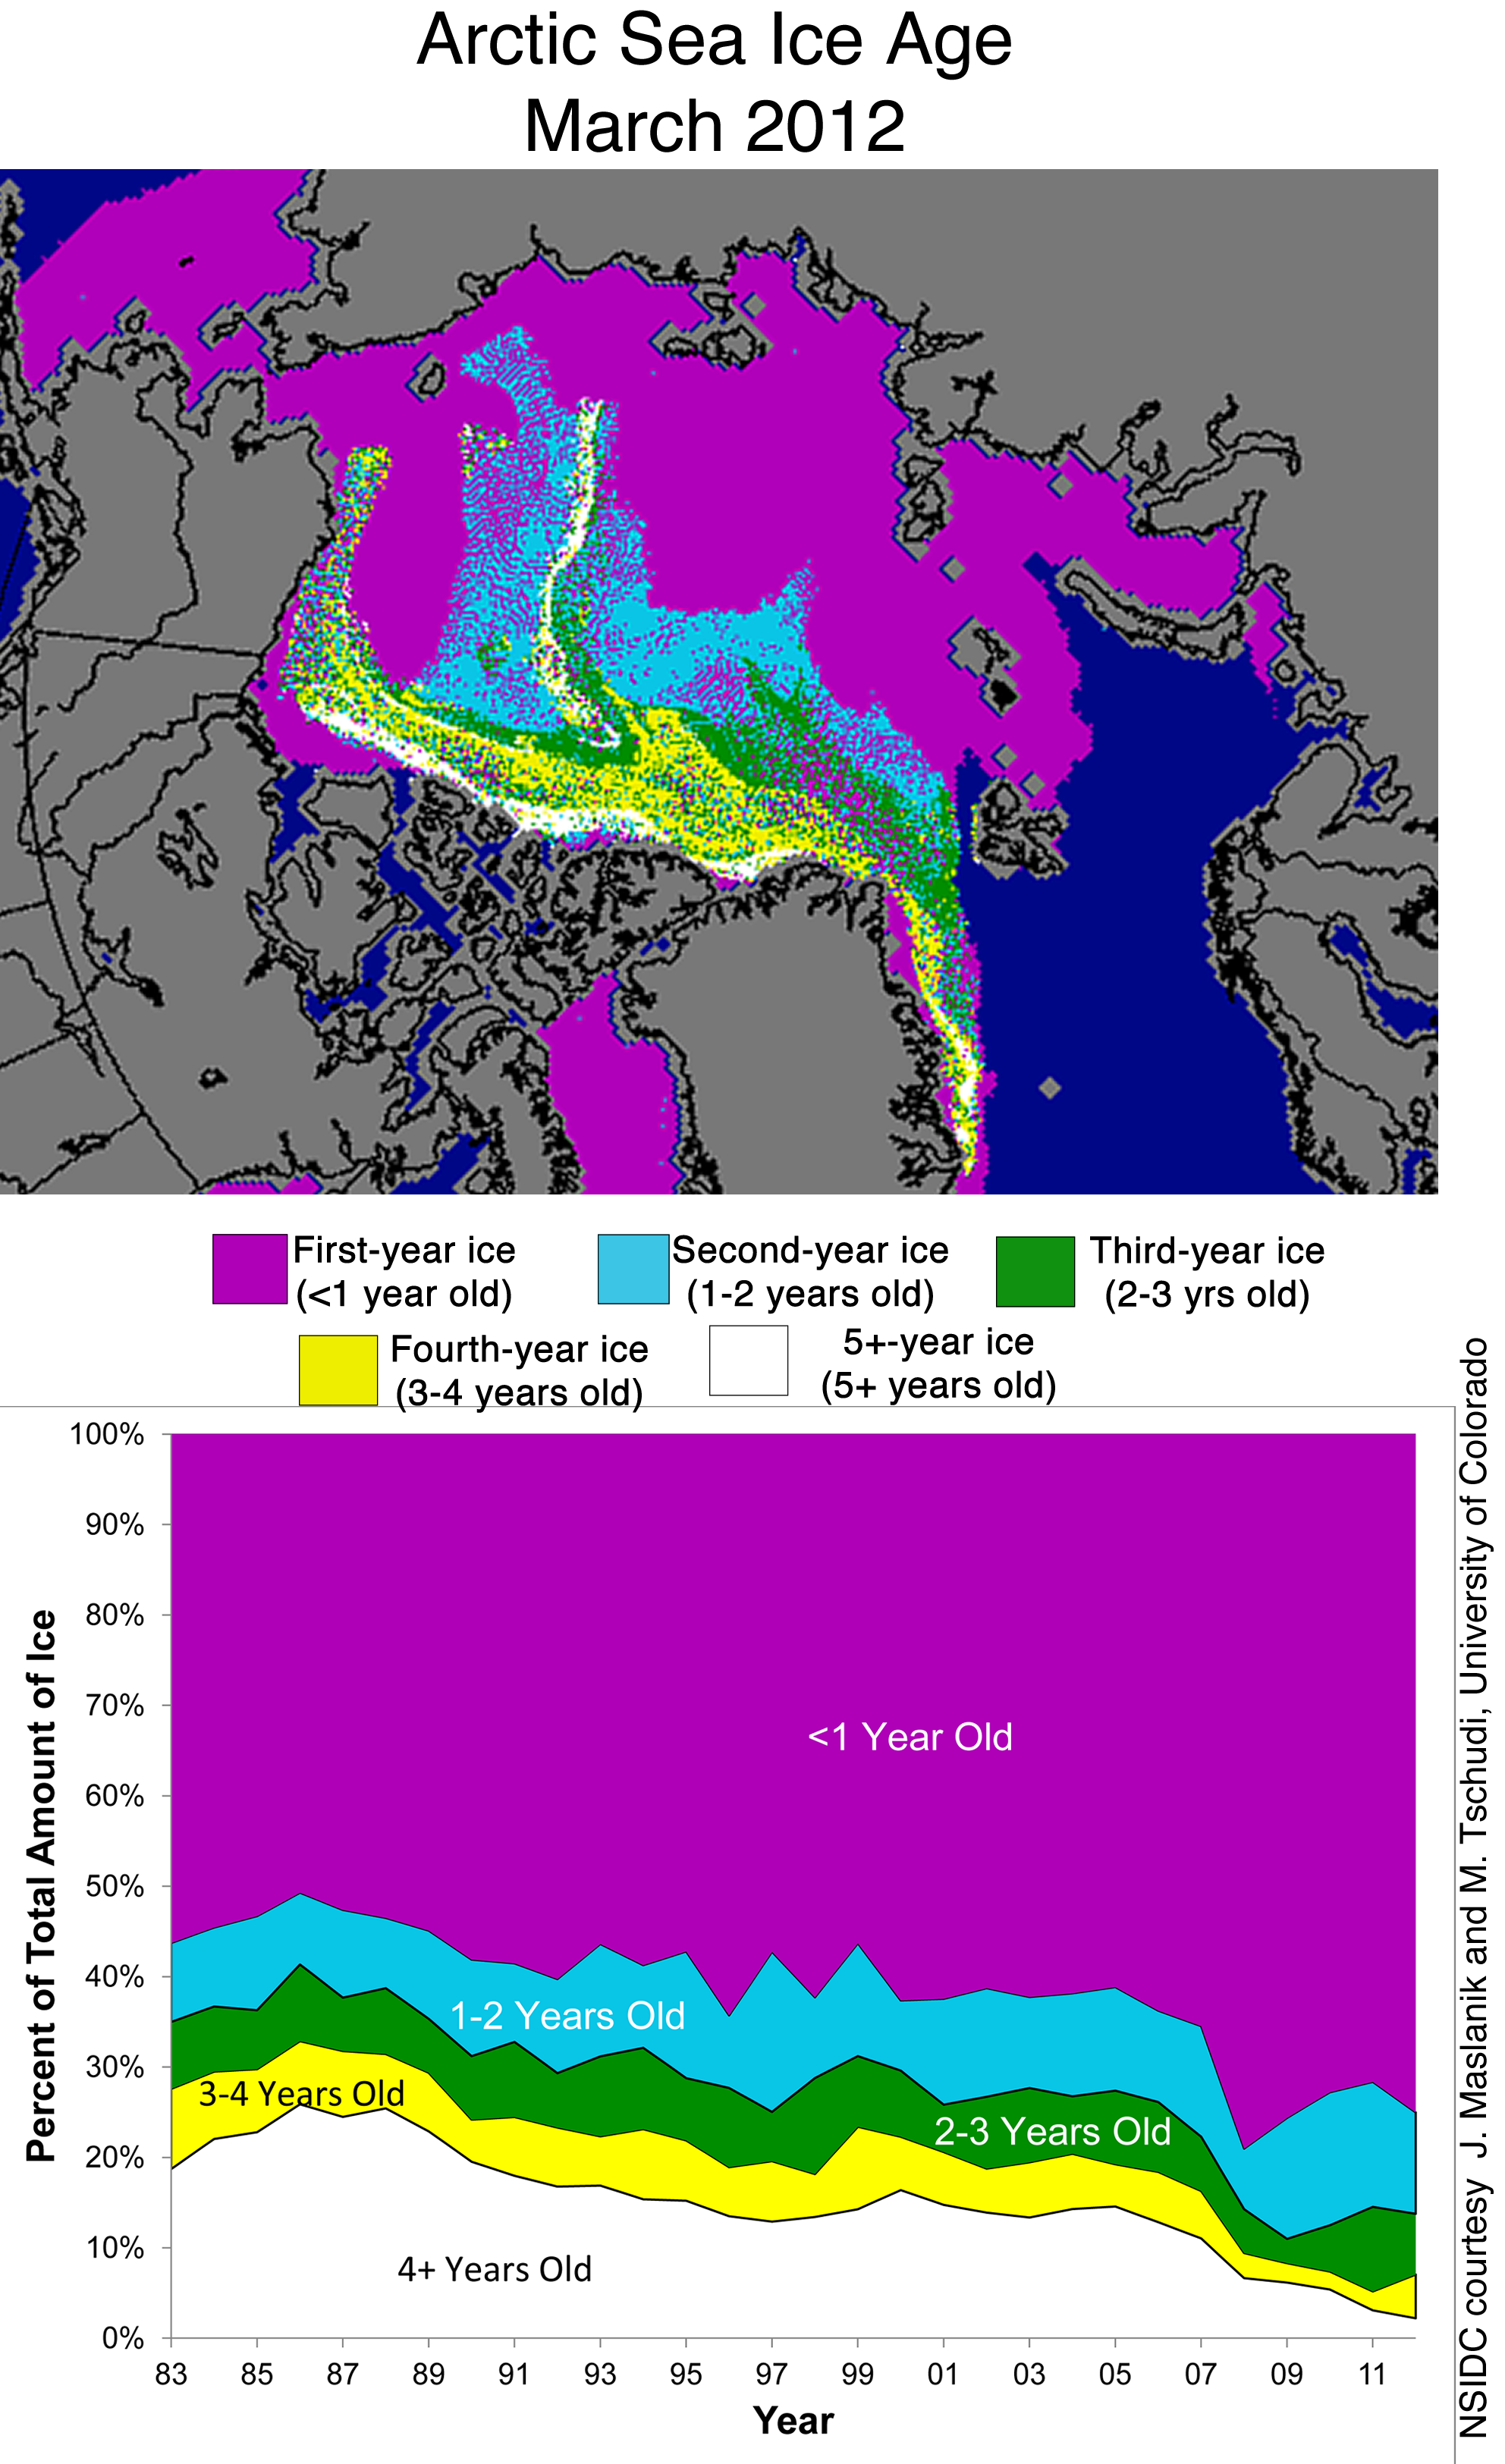
Figure 5. Ice age data show that first-year ice made up 75% of the Arctic sea ice cover this March. Thicker multiyear ice used to make up around a quarter of the Arctic sea ice cover. Now it constitutes only 2%.
Credit: NSIDC courtesy J. Maslanik and M. Tschudi, University of Colorado
High-resolution image
Ice age data shows thin ice cover
One key predictor for summer ice melt is the amount of old, thick ice in the Arctic at the end of the winter. Some ice thickness data are available from satellites, but these records are short and discontinuous. Data from the NASA ICESat satellite covers only 2003 to 2009, and the new European Space Agency CryoSat satellite began collecting data in 2011. So researchers look at ice age data as one indicator of Arctic sea ice thickness. Older ice that has survived multiple melt seasons tends to be thicker than newly formed ice.
Ice age data this year show that the ice cover remains much thinner than it was in the past, with a high proportion of first-year ice, which is thin and vulnerable to summer melt. After the record low minimum of 2007 the Arctic lost a significant amount of older, thicker ice, both from melting and from movement of ice out of the Arctic the following winter. In the last few years, the melt and export of old ice was less extreme than in 2007 and 2008, and multiyear ice started to regrow, with second and third-year ice increasing over the last three years.
After the near-record melt last summer, second-year ice declined again, but some of the ice that had survived the previous few summers made it through another year, increasing the proportion of third- and fourth-year ice. However the oldest, thickest ice, more than four years old, continued to decline. Ice older than four years used to make up about a quarter of the winter sea ice cover, but now constitutes only 2%. First-year ice (0 to 1 years old) this year makes up 75% of the total ice cover, the third highest at this time of year in the satellite record. In 2008 the proportion of first-year ice was 79%, and in 2009 it was 76%.
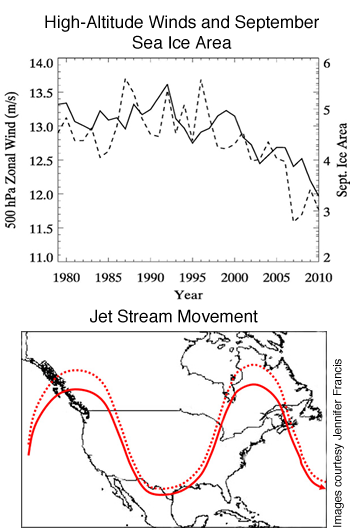
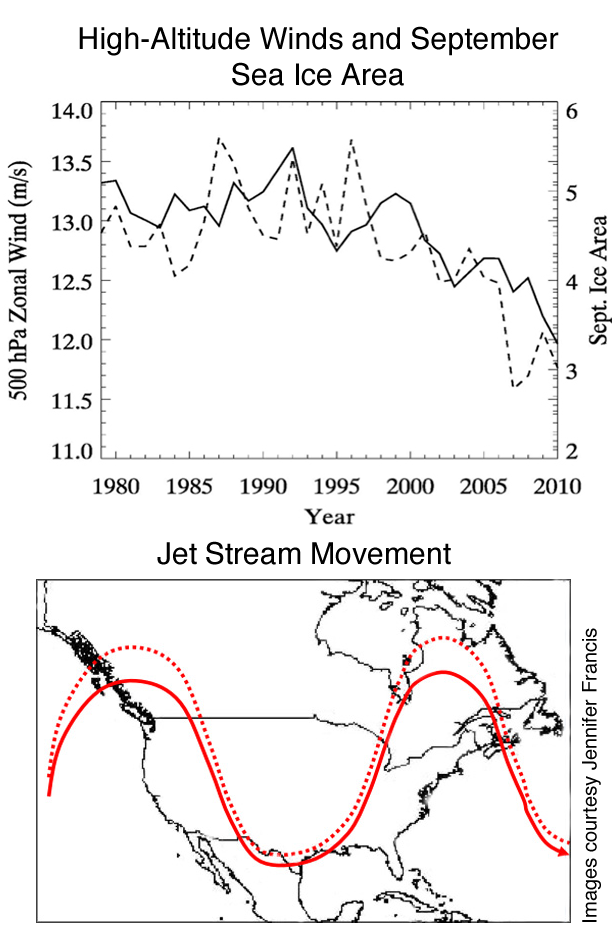
Figure 6. The top image shows a decline in upper-atmosphere winds (solid line) over the last 30 years that mirrors the decline in sea ice over the same time period (dashed line). The bottom image shows the expected change in trajectory of the jet stream (dotted line) compared to the current jet stream trajectory (solid line).
Credit: Jennifer Francis, Rutgers University
High-resolution image
Rapid Arctic warming and mid-latitude weather
The Arctic has warmed about twice as fast as the rest of the Northern Hemisphere in recent decades. Summer Arctic sea ice has declined by 40%, and snow is melting earlier in spring on the surrounding land. This dramatic change in the climate system is expected to affect weather patterns well beyond the confines of the Arctic—but researchers are working to understand exactly how those changes are affecting other regions.
New research by Jennifer Francis of Rutgers University and Steve Vavrus of the University of Wisconsin suggests that warming in the Arctic is causing weather patterns in mid-latitudes to become more persistent. This persistence can lead to conditions like heat waves, cold spells, drought, flooding, and heavy snows. The researchers found that as temperatures in the Arctic warm and become closer to temperatures in lower latitudes, the waves of the jet stream tend to spread out, and west-to-east winds slow down in the upper level of the atmosphere (where storm tracks form). Both of these effects tend to slow the progression of weather patterns, which means that a weather pattern, whether hot or cold, is more likely to stick around.
References
Francis, J.A. and S.J. Vavrus. 2012. Evidence linking Arctic amplification to extreme weather in mid-latitudes. Geophysical Research Letters, 39, L06801, doi:10.1029/2012GL051000.
Francis, J.A. 2012. Linking weird weather to rapid warming of the Arctic. Yale Environment 360, http://e360.yale.edu/feature/linking_weird_weather_to_rapid_warming_of_the_arctic/2501/
Kwok, R., T. Pederson, P. Gudmandsen, S. Pang. 2010. Large sea ice outflow in the Nares Strait in 2007. Geophysical Research Letters, 37, L03502, doi:10.1029/2009GL041872.
Sodhi, D. S. 1977. Ice arching and the drift of pack ice through restricted channels, Rep. 77‐18, Cold Reg. Res. and Eng. Lab., Hanover, N. H.