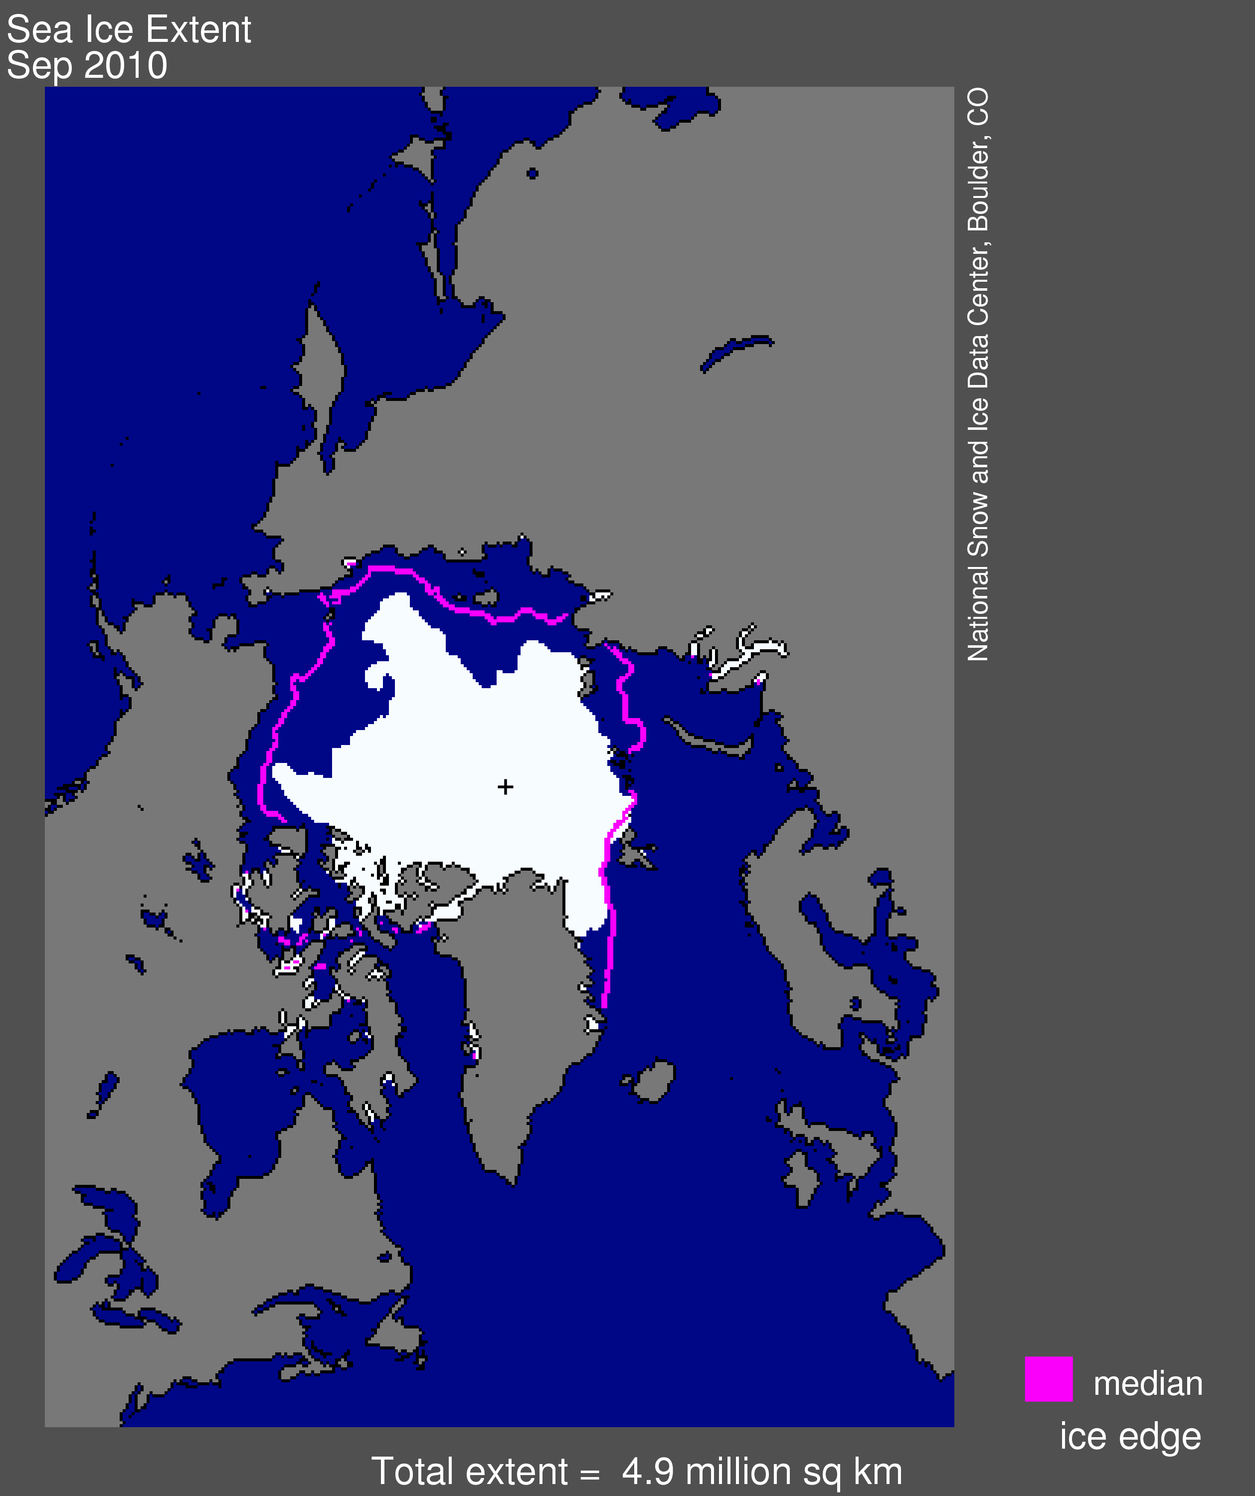
 Figure 1. Arctic sea ice extent for September 2010 was 4.90 million square kilometers (1.89 million square miles). The magenta line shows the 1979 to 2000 median extent for that month. The black cross indicates the geographic North Pole. Sea Ice Index data. About the data. —Credit: National Snow and Ice Data Center
High-resolution image
Overview of conditions
Average ice extent for September 2010 was 4.90 million square kilometers (1.89 million square miles), 2.14 million square kilometers (830,000 square miles) below the 1979 to 2000 average, but 600,000 square kilometers (230,000 square miles) above the average for September 2007, the lowest monthly extent in the satellite record. Ice extent was below the 1979 to 2000 average everywhere except in the East Greenland Sea near Svalbard.
The U.S. National Ice Center declared both the Northwest Passage and the Northern Sea Route open for a period during September. Stephen Howell of Environment Canada reported a record early melt-out and low extent in the western Parry Channel region of the Northwest Passage, based on analyses of the Canadian Ice Service. Two sailing expeditions, one Norwegian and one Russian, successfully navigated both passages and are nearing their goal of circumnavigating the Arctic.
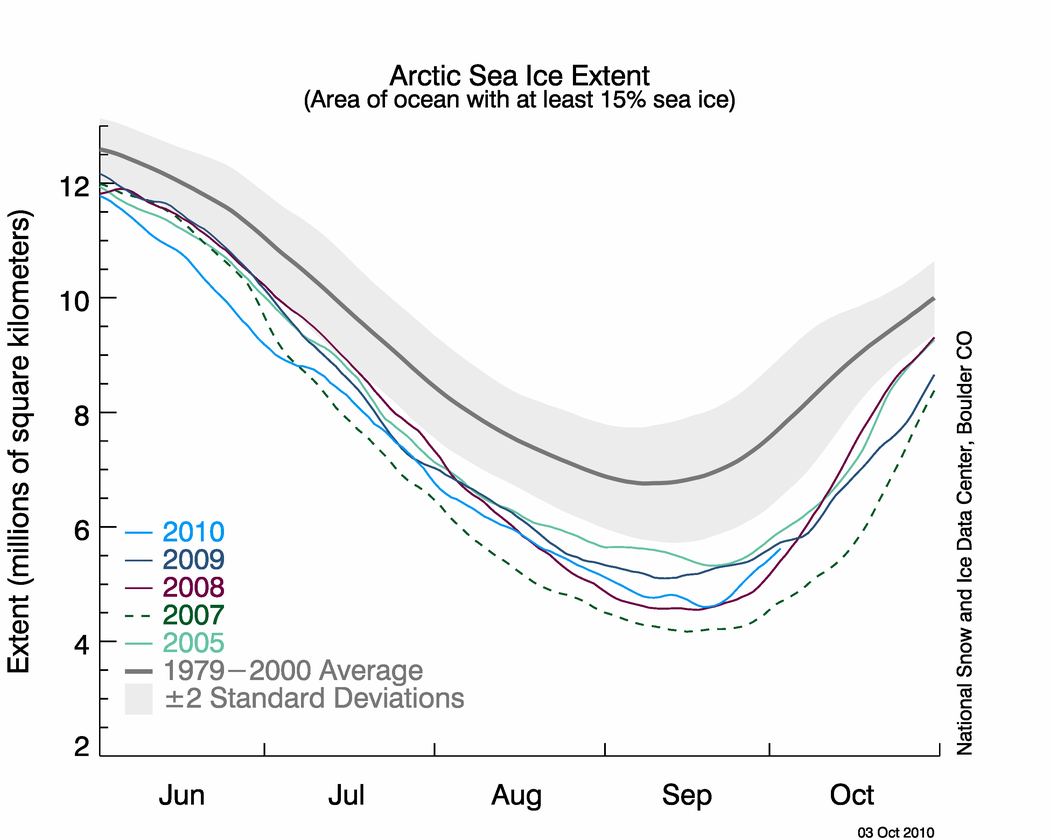 Figure 2. The graph above shows daily Arctic sea ice extent as of October 3, 2010, along with daily ice extents for years wtih the previous four lowest minimum extents. The solid light blue line indicates 2010; dark blue shows 2009, purple shows 2008; dashed green shows 2007; light green shows 2005; and solid gray indicates average extent from 1979 to 2000. The gray area around the average line shows the two standard deviation range of the data. Sea Ice Index data.
—Credit: National Snow and Ice Data Center
High-resolution image
Conditions in context
After the minimum extent of 4.60 million square kilometers (1.78 million square kilometers) on September 19, 2010, a rapid freeze-up has begun. On October 1, the 5-day average ice extent was 5.44 million square kilometers (2.10 million square miles).
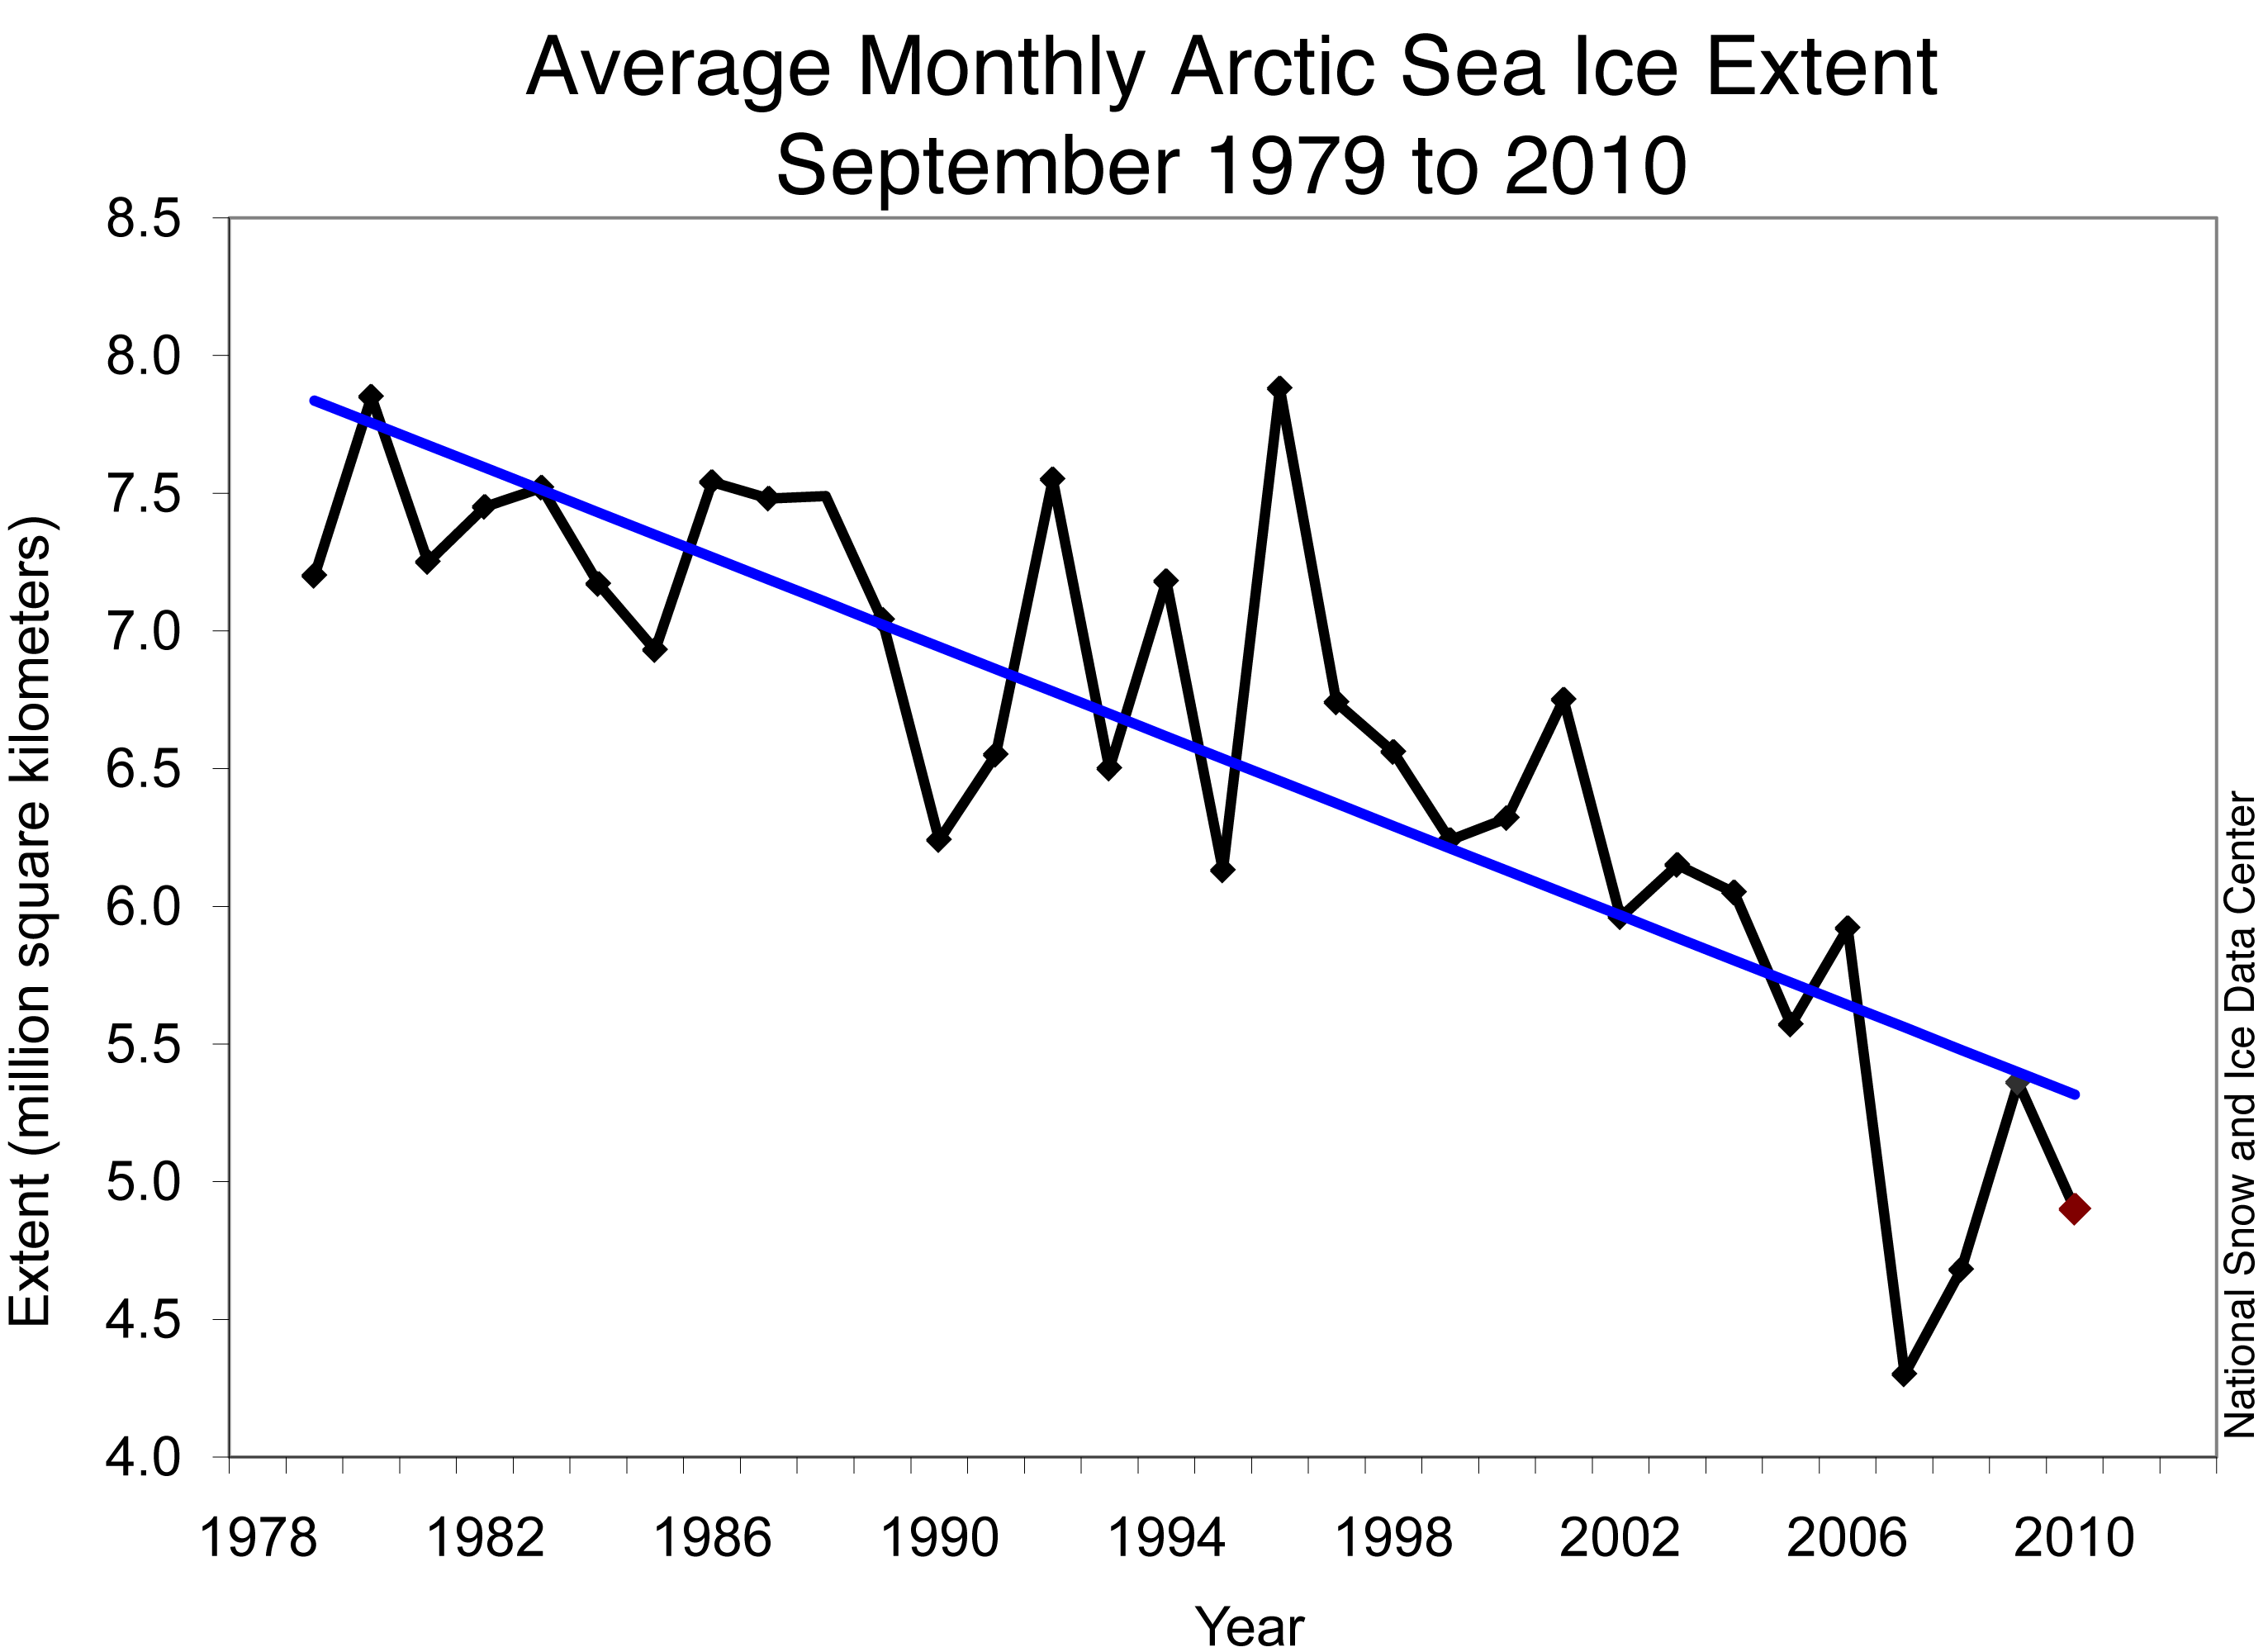
Figure 3. Monthly September ice extent for 1979 to 2010 shows a decline of 11.5% per decade.
—Credit: National Snow and Ice Data Center
High-resolution image
September 2010 compared to past years
Ice extent for September 2010 was the third lowest in the satellite record for the month, behind 2007 (lowest) and 2008 (second lowest). The linear rate of decline of September ice extent over the period 1979 to 2010 is now 81,400 square kilometers (31,400 square miles) per year, or 11.5% per decade relative to the 1979 to 2000 average. Sea ice extent at the end of the melt season is shaped by conditions in the atmosphere and ocean, as well as the condition of the ice cover itself.

Figure 4. These maps of sea level pressure for late summer show atmospheric conditions during August 2010 (left), and September 2010 (right). In August, high pressure over the Beaufort was paired with low pressure over Siberia. This pattern persisted through the first week of September, then broke down. —Credit: NSIDC courtesy NOAA/ESRL PSD
High-resolution image
The atmosphere
During the summer of 2010, atmospheric conditions shifted between warm conditions that favored melt, and stormy conditions that slowed the melt rate but helped break up the ice. The net effects of atmospheric conditions this season contributed to the low ice extent.
At the beginning of the melt season, ice extent was relatively high after a long winter dominated by an extreme negative phase of the Arctic Oscillation. Historically, these winter conditions would favor retention of ice through the summer. But in June, a combination of high pressure over the central Arctic Ocean and unusually low pressure over Siberia gave rise to warm conditions over much of the Arctic Ocean and strong westward ice motion off the Siberian Coast, favoring rapid ice melt. In contrast, a series of low-pressure systems moved into the central Arctic Ocean in July. While slowing the melt rate, the stormy conditions helped to break up the sea ice cover. August saw a return to the basic pattern seen in June, although not as prominent. This pattern persisted through the first week of September, helping to drive the sea ice toward what appeared to be its seasonal minimum on September 10. After ice extent started to climb, a change in atmospheric conditions caused it to fall again, to reach its final value of 4.60 million square kilometers (1.78 million square miles) on September 19.
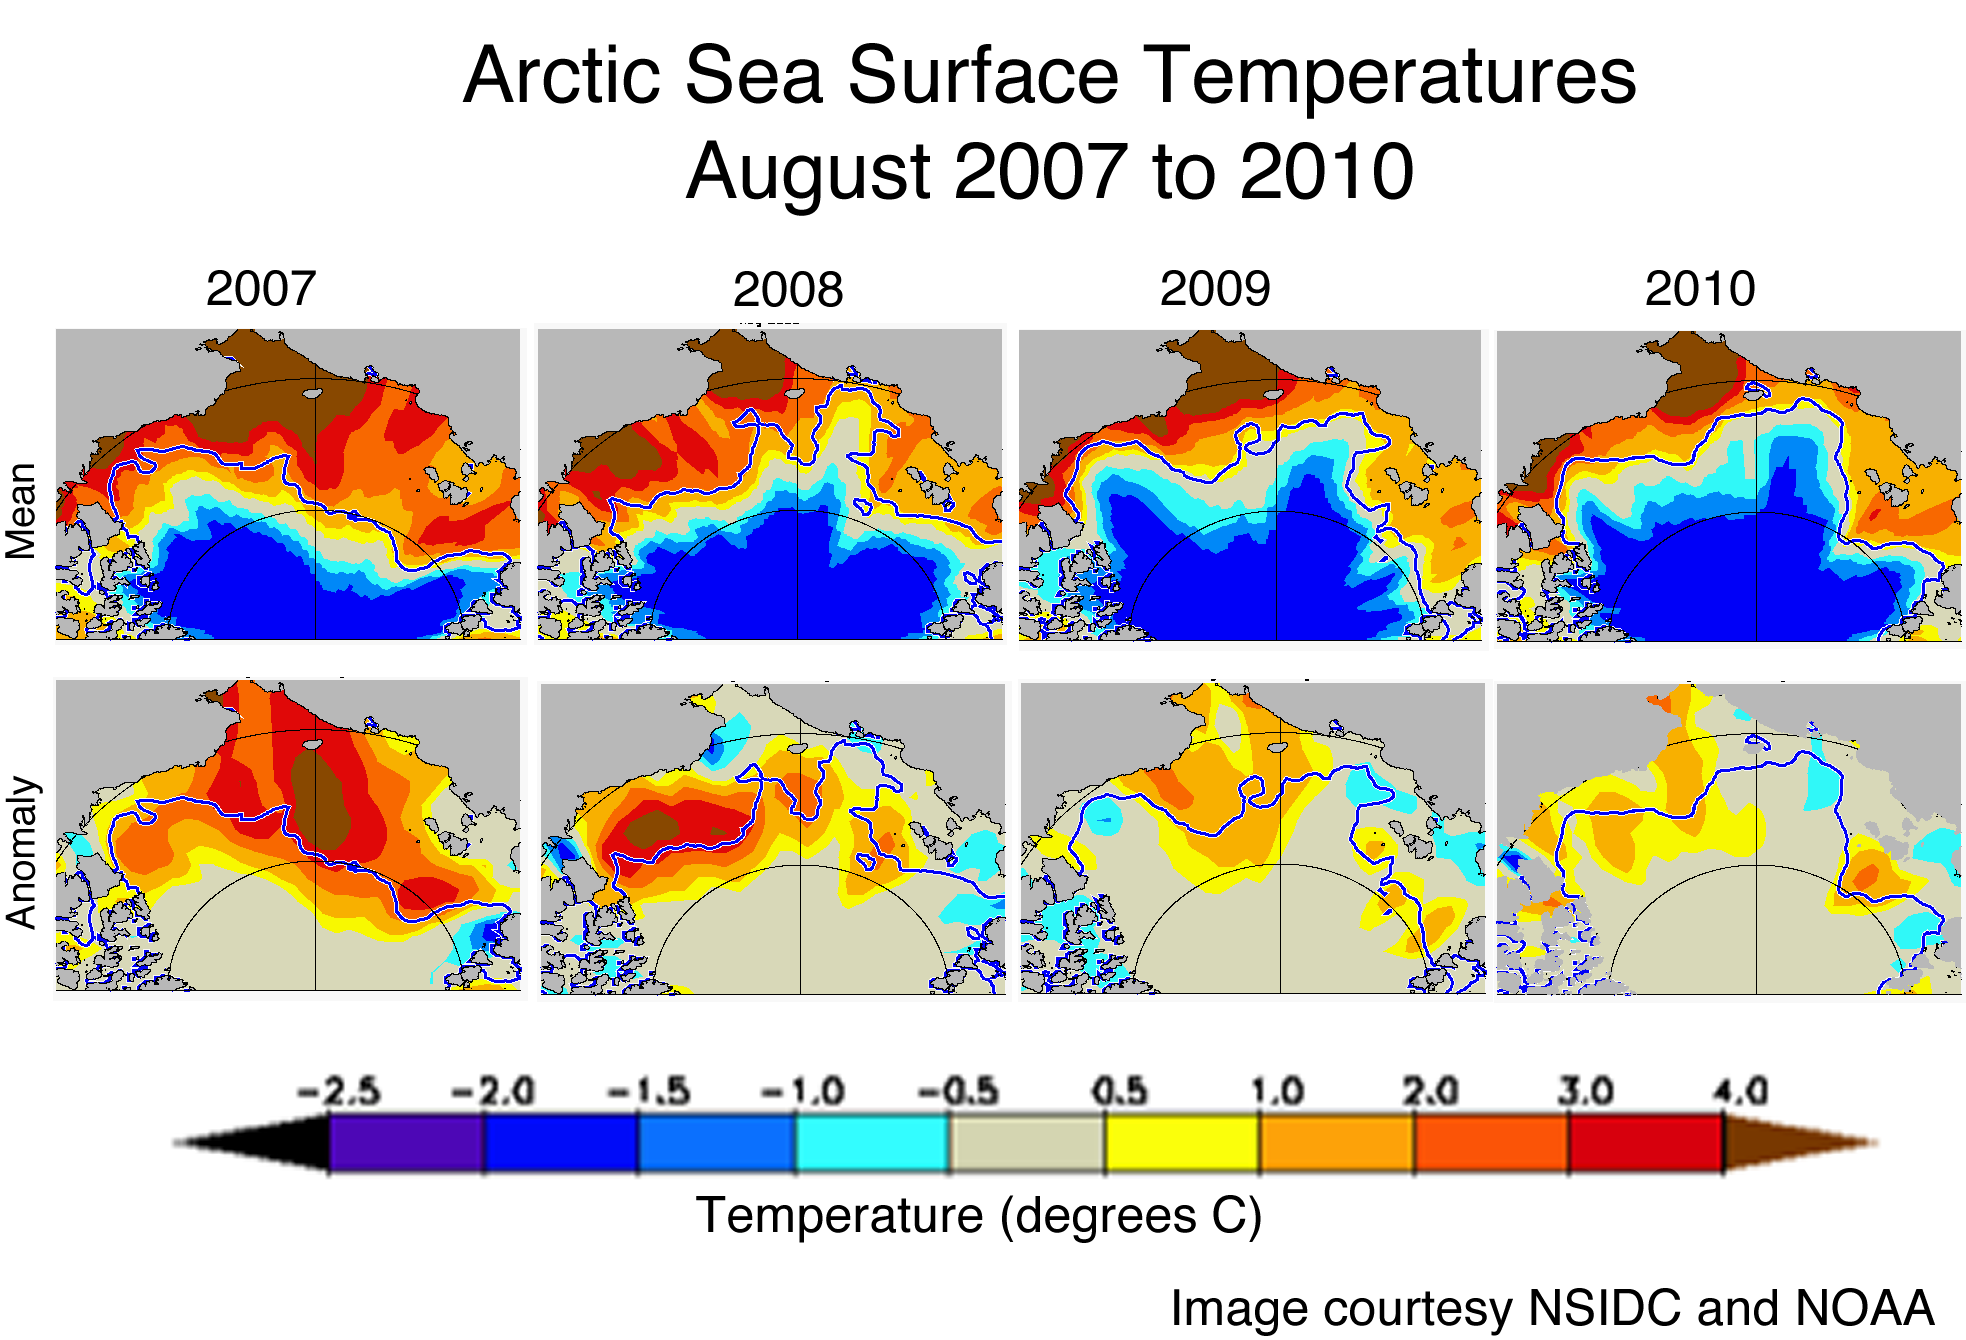
Figure 5. This summer, sea surface temperatures were higher than average, but lower than in the last three years. The maps above show average sea surface temperatures and anomalies for August 2007 to 2010.—Credit: National Snow and Ice Data Center courtesy M. Steele, University of Washington
High-resolution image
The ocean
As in recent years, sea surface temperatures this summer were higher than normal in much of the Arctic Ocean, according to researchers at the University of Washington. Mike Steele, Wendy Ermold, and Ignatius Rigor found that temperatures in the Beaufort/Chukchi Seas and the region north of the Laptev Sea were particularly high. The high sea surrface temperatures resulted largely from the loss of sea ice: dark open water areas absorb more solar radiation than reflective ice. The warmer water in turn helps to melt more sea ice. This positive feedback likely contributed to the ice loss through summer 2010, especially late in the season when surface melt had largely ceased.
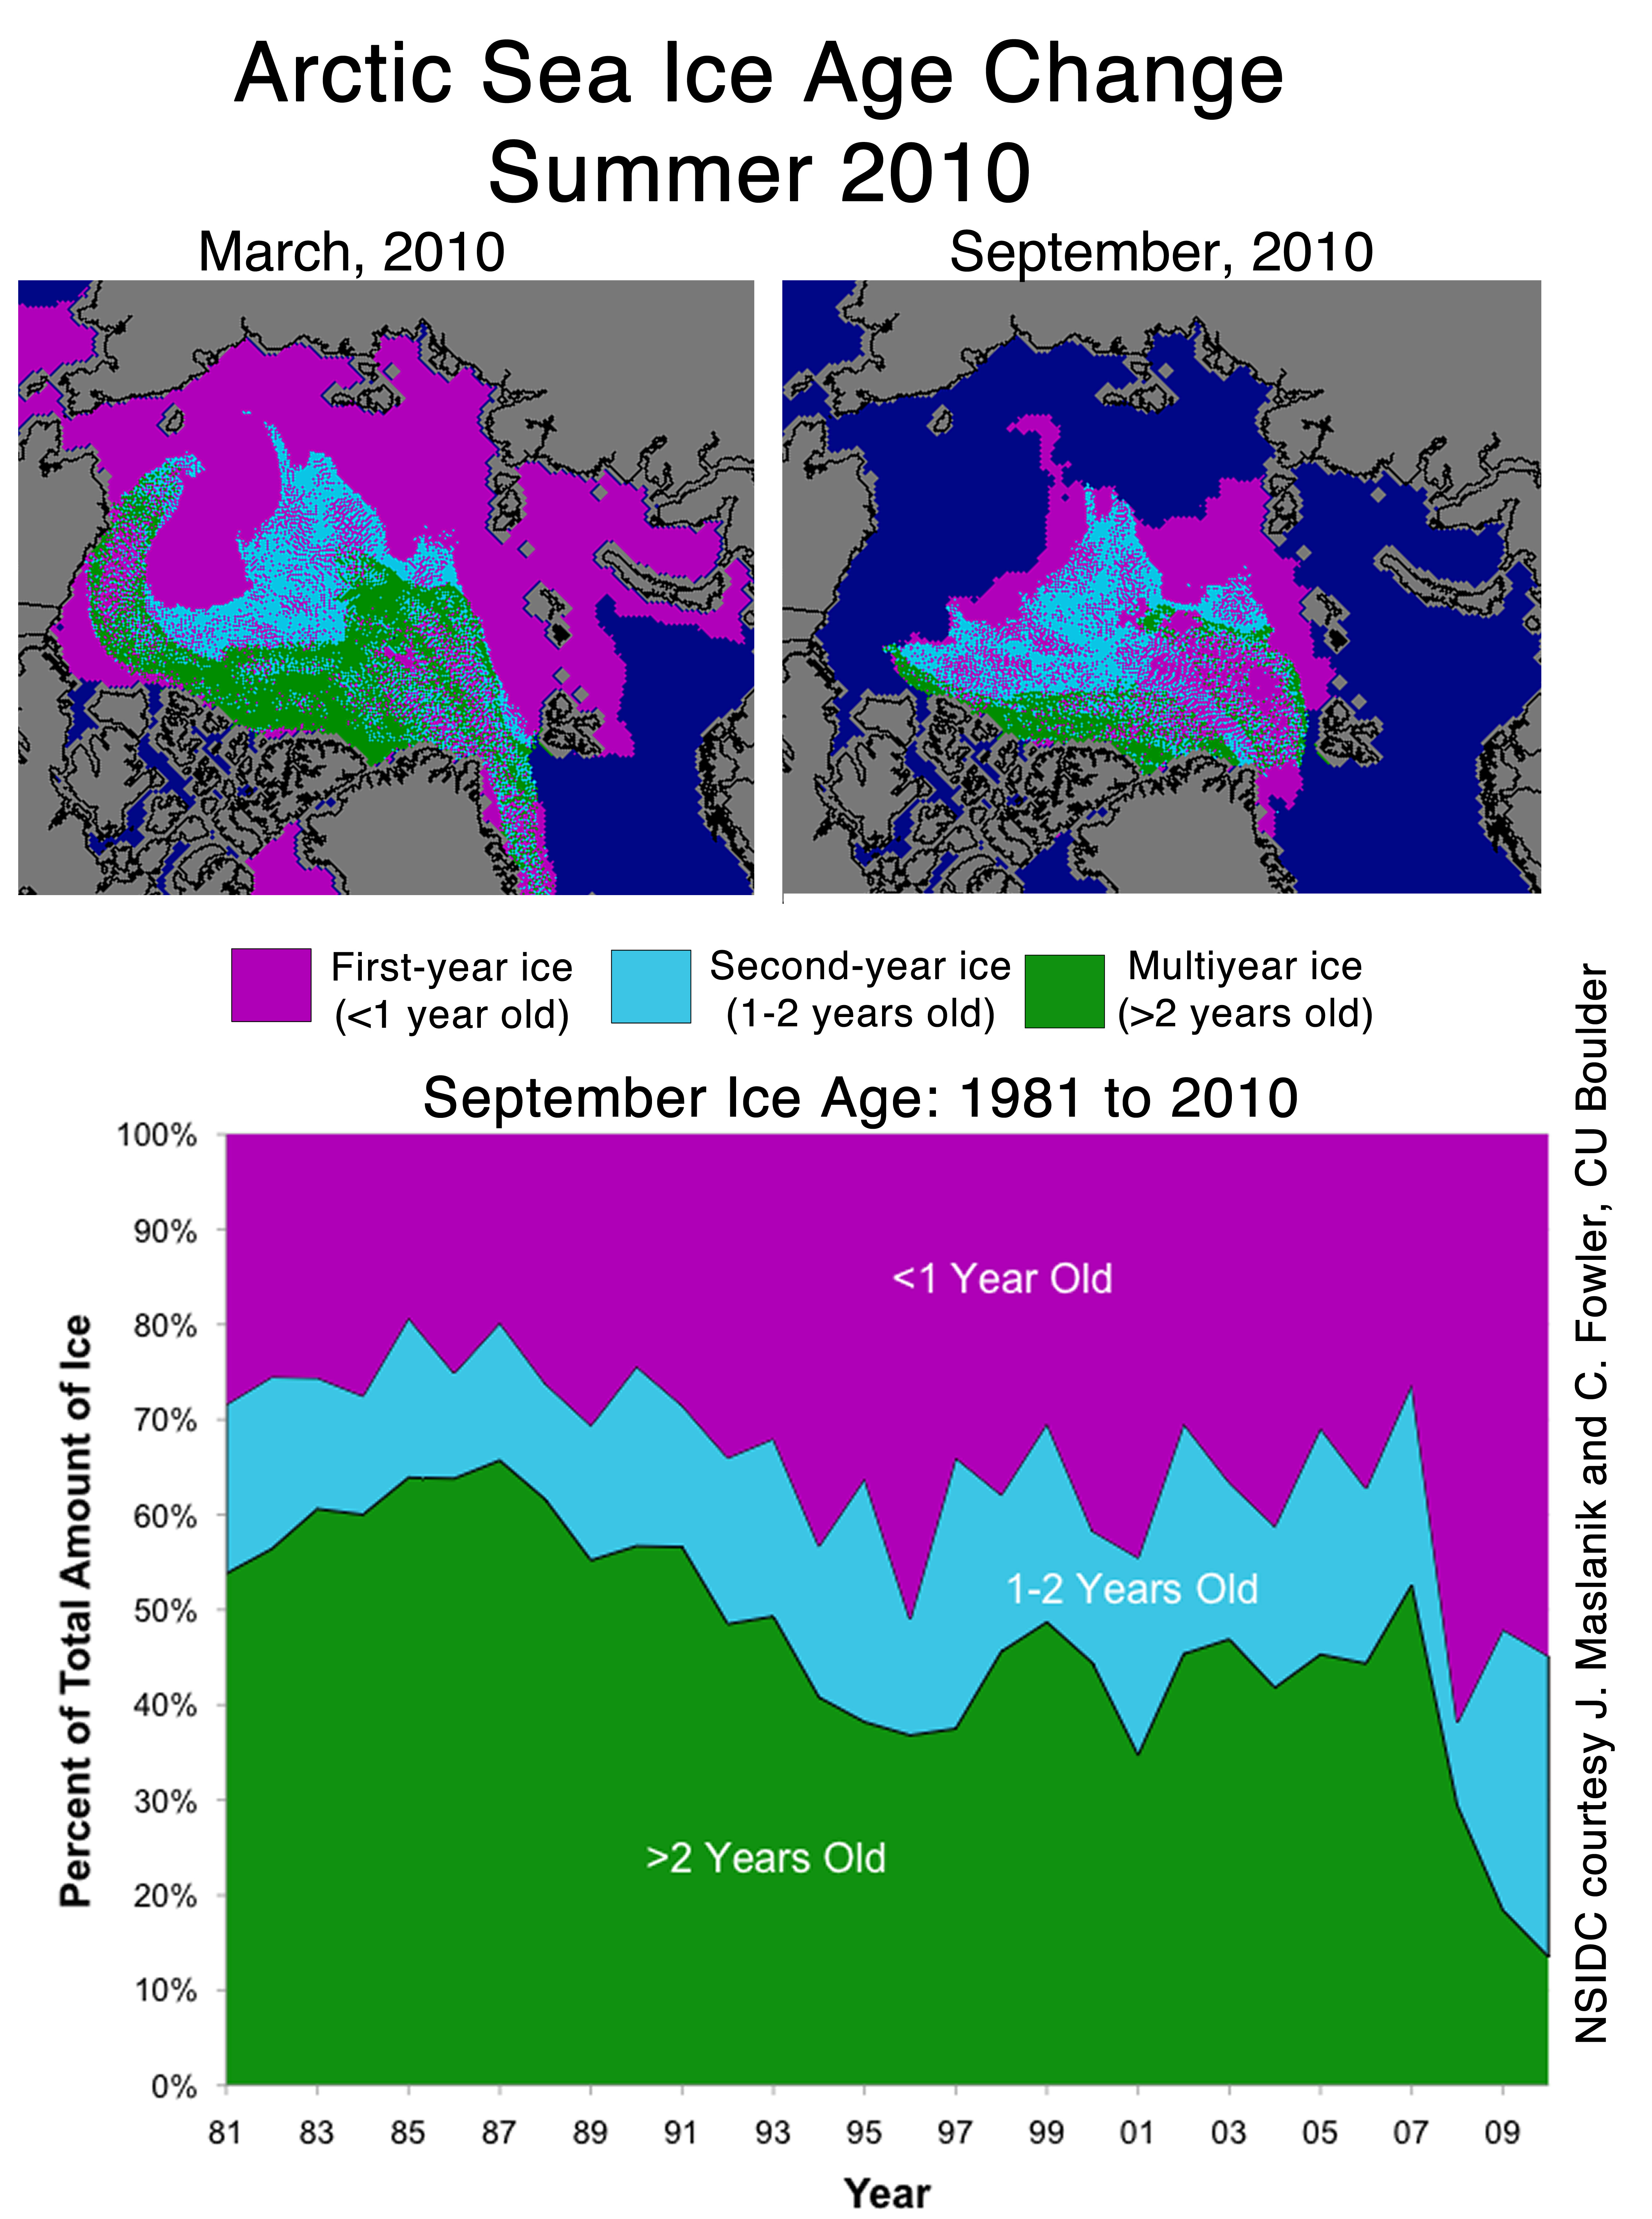
Figure 6. These images show the change in ice age from spring 2010 to fall 2010. The negative phase of the Arctic Oscillation this winter slowed the export of older ice out of the Arctic in the winter, but a large amount of older ice melted out during the summer.—Credit: National Snow and Ice Data Center ourtesy C. Fowler and J. Maslanik, CU Boulder
High-resolution image
The ice
Researchers often look at ice age as a way to estimate ice thickness. Older ice tends to be thicker than younger, one- or two-year-old ice. Last winter, the wind patterns associated with the negative phase of the Arctic Oscillation transported a great deal of multiyear ice from the coast of the Canadian Arctic into the Beaufort and Chukchi seas. Scientists speculated that much of this ice, some five years or older, would survive the summer melt period. Instead, it mostly melted away. At the end of the summer 2010, under 15% of the ice remaining the Arctic was more than two years old, compared to 50 to 60% during the 1980s. There is virtually none of the oldest (at least five years old) ice remaining in the Arctic (less than 60,000 square kilometers [23,000 square miles] compared to 2 million square kilometers [722,000 square miles] during the 1980s).
Whether younger multiyear ice (two or three years old) in the Arctic Ocean will continue to age and thicken depends on two things: first, how much of that ice stays in the Arctic instead of exiting into the North Atlantic through Fram Strait; and second, whether the ice survives its transit across the Beaufort and Chukchi Seas or instead melts away.
Further Reading
National Ice Center: Northwest Passage Opening
Borge Ousland: Northern Passage Expedition blog
Voice of Russia, 1 October 2010: Russian yacht circumnavigates North Pole
NSIDC Announcement: Arctic sea ice extent falls to third-lowest extent, downward trend persists
For previous analyses, please see the drop-down menu under Archives in the right navigation at the top of this page.

