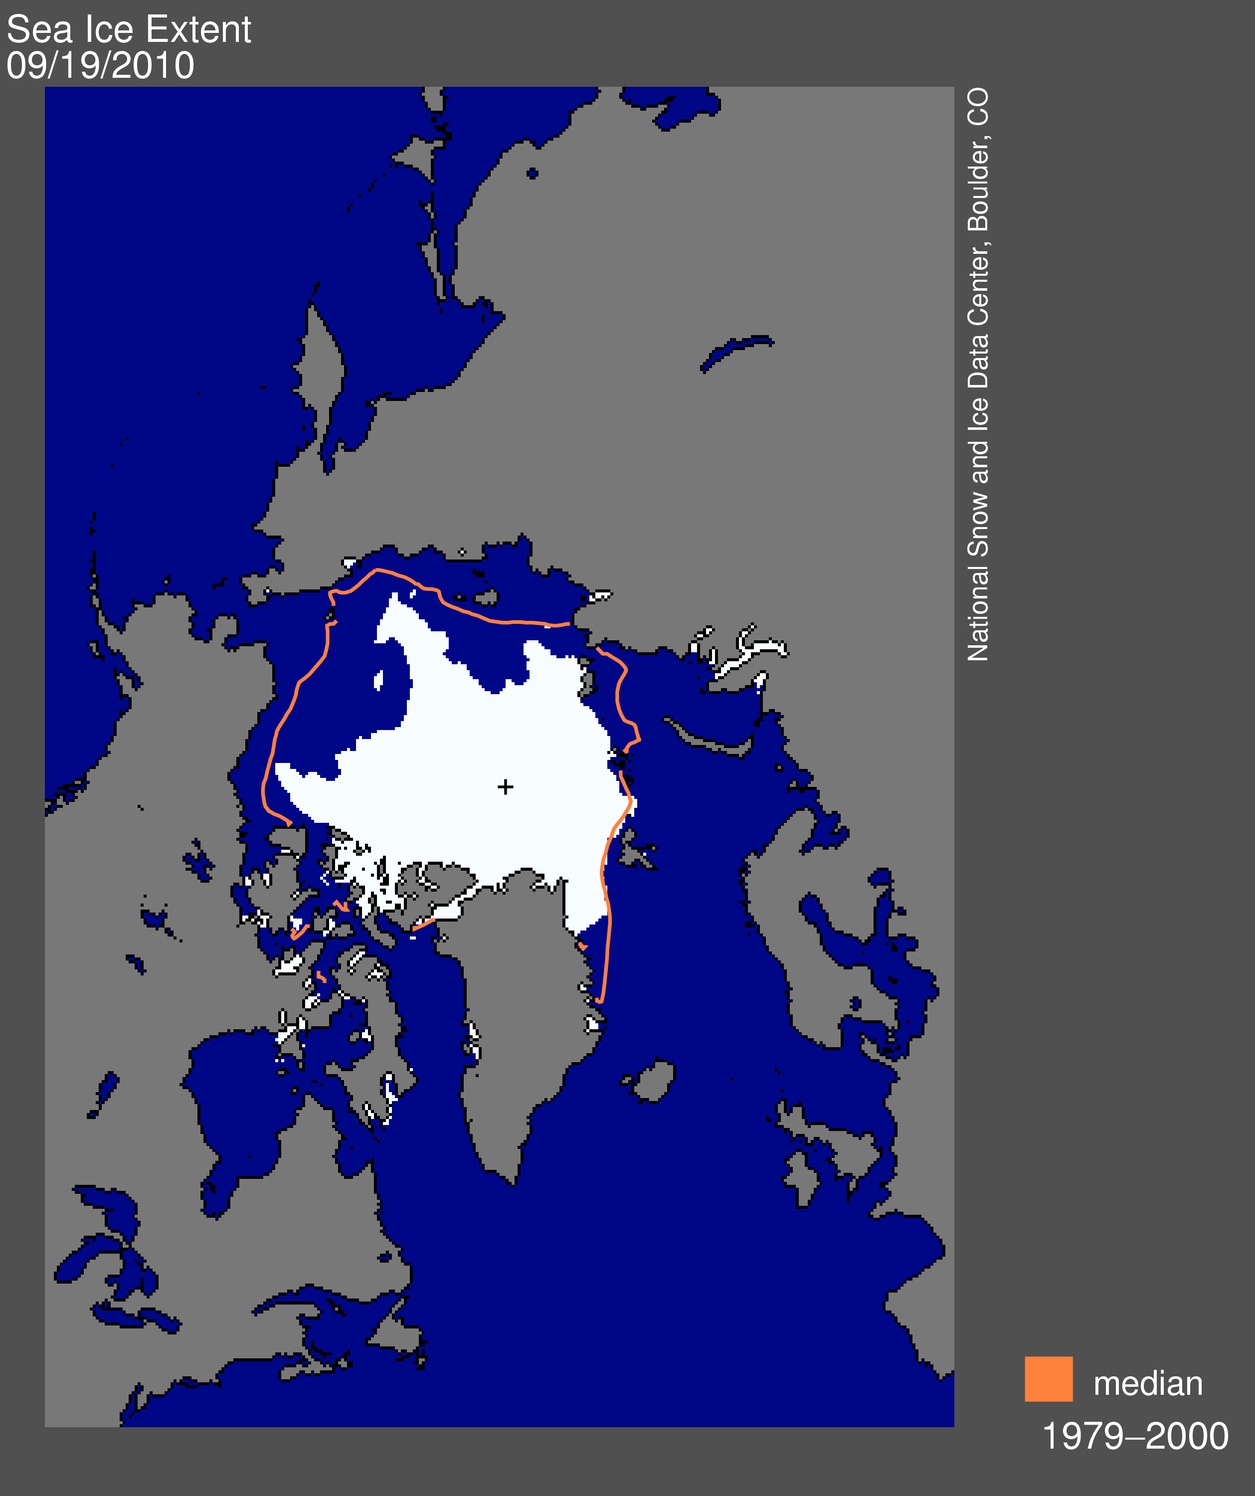
 Figure 1. Daily Arctic sea ice extent on September 19, 2010 was 4.60 million square kilometers (1.78 million square miles). The orange line shows the 1979 to 2000 median extent for that day. The black cross indicates the geographic North Pole. Sea Ice Index data. About the data. —Credit: National Snow and Ice Data Center
High-resolution image
Overview of conditions
After appearing to reach a low point on September 10, sea ice extent rose for three days and then began a second decline. Ice extent dropped to its lowest extent for the year on September 19, at 4.60 million square kilometers (1.78 million square miles) .
The 2010 minimum ice extent was the third-lowest recorded since 1979. The 2010 minimum ice extent was 37,000 square kilometers (14,000 square miles) above 2008; 470,000 square kilometers (181,000 square miles) above the record minimum in 2007; and 500,000 square kilometers (193,000 square miles) below 2009, previously the third lowest extent since 1979. The 2010 minimum ice extent was 2.11 million square kilometers (815,000 square miles) below the 1979 to 2000 average and 1.74 million square kilometers (672,000 square miles) below the 1979 to 2009 average.
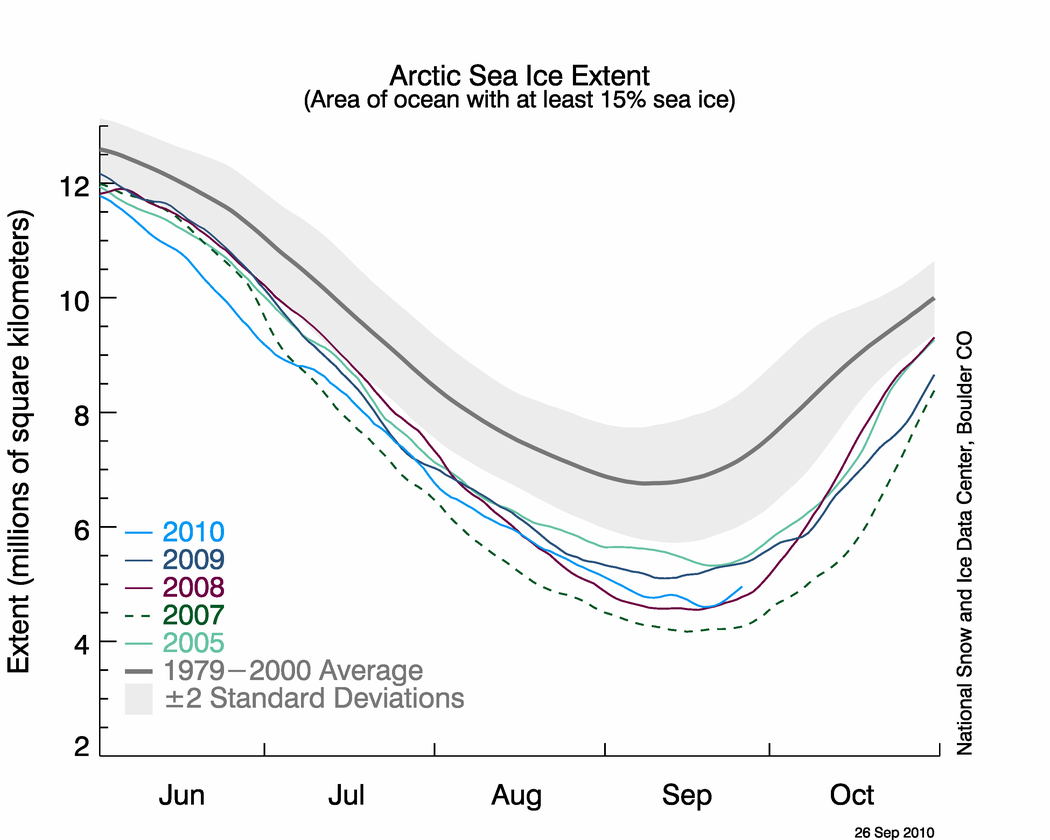 Figure 2. The graph above shows daily Arctic sea ice extent as of September 26, 2010, along with daily ice extents for years wtih the previous four lowest minimum extents. The solid light blue line indicates 2010; orange shows 2009, pink shows 2008; dashed green shows 2007; light green shows 2005; and solid gray indicates average extent from 1979 to 2000. The gray area around the average line shows the two standard deviation range of the data. Sea Ice Index data. —Credit: National Snow and Ice Data Center
High-resolution image
Conditions in context
The revised minimum ice extent on September 19 occurred ten days later than the average date of the minimum ice extent for the period 1979 to 2000, and 8 days later than the 1979 to 2009 average. With the additional days of ice loss, 2010 is no longer the shortest period of summer ice loss since 1979.
 Figure 3. This image compares differences in ice-covered areas between September 19, 2010, the date of this year’s minimum, and September 16, 2007, the record low minimum extent. Light gray shading indicates the region where ice occurred in both 2007 and 2010, while white and dark gray areas show ice cover unique to 2010 and to 2007, respectively. Sea Ice Index data. —Credit: National Snow and Ice Data Center
High-resolution image
2010 minimum ice extent compared to 2007
Compared to the 2007 seasonal minimum, the 2010 minimum had less ice in the northern Beaufort Sea region, the East Greenland Sea and the western Laptev Sea. However, there was much more ice in the East Siberian Sea this year compared to 2007.
Final analysis pending
In the beginning of October, NSIDC will issue a formal announcement with a full analysis of the melt season, and graphics comparing this year to the long-term record. We will also announce the monthly average September sea ice extent, the measure scientists rely on for accurate analysis and comparison over the long term.
We will continue to post analyses of sea ice conditions throughout the year, with frequency determined by sea ice conditions. The near-real-time daily image update will continue each day.

