Update: 21 September 2010
Although ice extent appeared to reach a minimum on September 10, rising afterwards for three straight days, it has subsequently declined even further. NSIDC scientists are closely monitoring the ice extent and will provide another update on the data, as conditions develop.
Our season-end announcement in October will provide the final numbers for the minimum extent, as well as the monthly data for September, which scientists use for establishing long-term trends.
Arctic sea ice appears to have reached its annual minimum extent on 10 September. The minimum ice extent was the third-lowest in the satellite record, after 2007 and 2008, and continues the trend of decreasing summer sea ice.
 Figure 1. Daily Arctic sea ice extent on September 10, 2010 was 4.76 million square kilometers (1.84 million square miles). The orange line shows the 1979 to 2000 median extent for that day. The black cross indicates the geographic North Pole. Sea Ice Index data. About the data. —Credit: National Snow and Ice Data Center
High-resolution image
Overview of conditions
On September 10, 2010 sea ice extent dropped to 4.76 million square kilometers (1.84 million square miles). This appears to have been the lowest extent of the year; sea ice has now begun its annual cycle of growth.
The 2010 minimum ice extent is the third-lowest recorded since 1979. The 2010 minimum extent is 240,000 square kilometers (93,000 square miles) above 2008 and 630,000 square kilometers (240,000 square miles) above the record low in 2007. This is 340,000 square kilometers (130,000 square miles) below 2009. The 2010 minimum is 1.95 million square kilometers (753,000 square miles) below the 1979 to 2000 average minimum and 1.62 million square kilometers (625,000 square miles) below the thirty-one-year 1979 to 2009 average minimum.
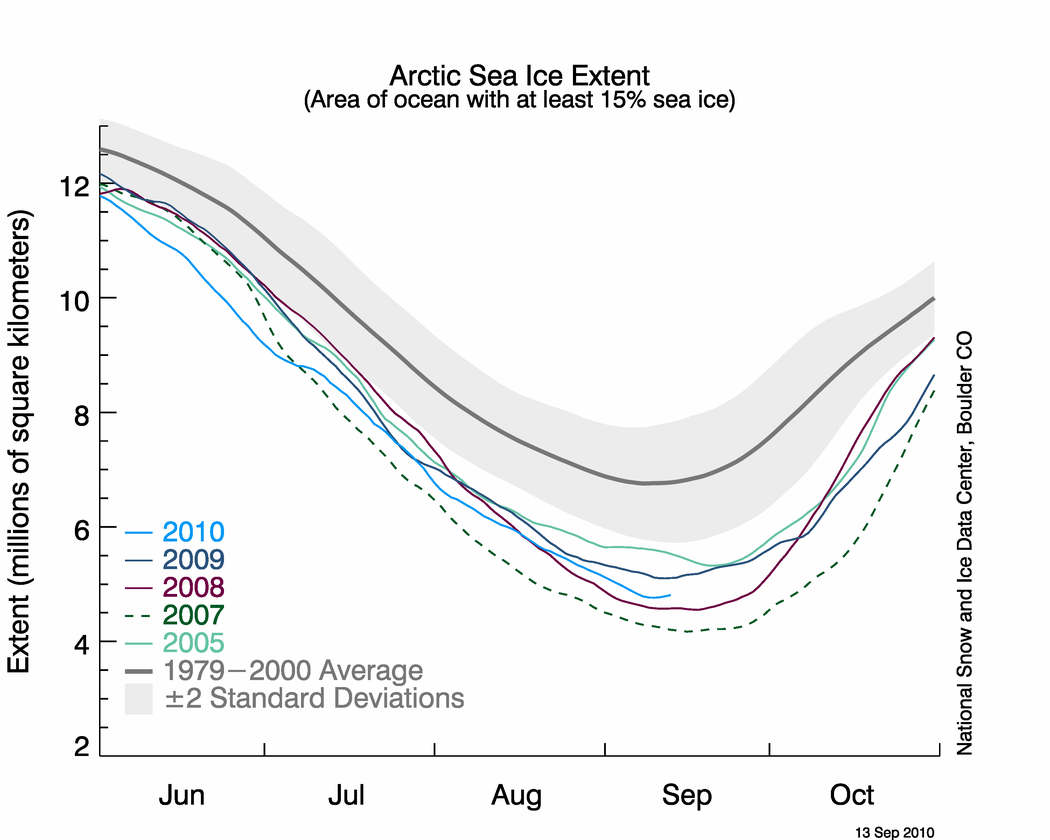 Figure 2. The graph above shows daily Arctic sea ice extent as of September 13, 2010, along with daily ice extents for years wtih the previous four lowest minimum extents. The solid light blue line indicates 2010; orange shows 2009, pink shows 2008; dashed green shows 2007; light green shows 2005; and solid gray indicates average extent from 1979 to 2000. The gray area around the average line shows the two standard deviation range of the data. Sea Ice Index data.
—Credit: National Snow and Ice Data Center
High-resolution image
Conditions in context
This is only the third time in the satellite record that ice extent has fallen below 5 million square kilometers (1.93 million square miles), and all those occurrences have been within the past four years. The minimum for 2009 was 5.10 million square kilometers (1.97 million square miles), fourth lowest in the satellite record.
Despite a late start to the melt season, the ice extent declined rapidly thereafter, with record daily average ice loss rates for the Arctic as a whole for May and June. Assuming that we have indeed reached the seasonal minimum extent, 2010 would have the shortest melt season in the satellite record, spanning 163 days between the seasonal maximum and minimum ice extents.
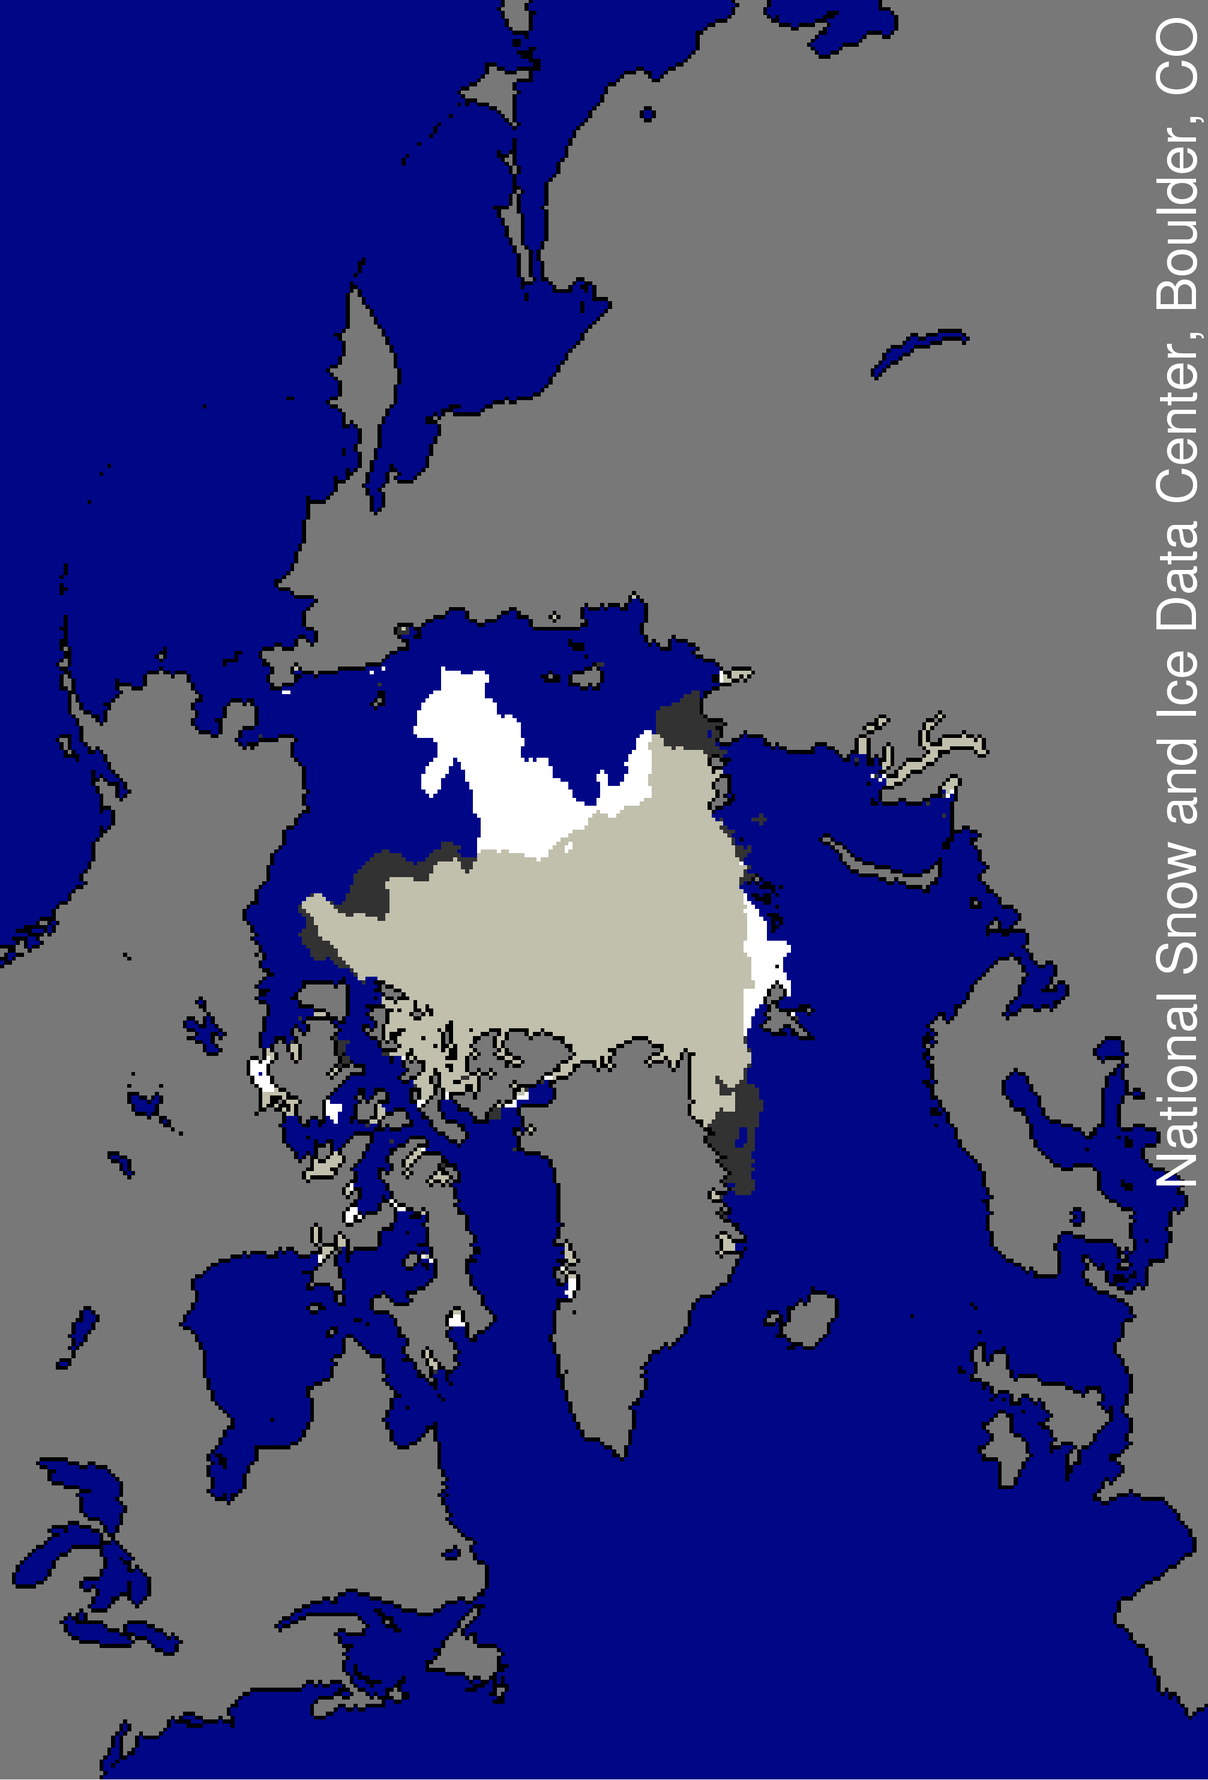
Figure 3. This image compares differences in ice-covered areas between September 10, 2010, the date of this year’s minimum, and September 16, 2007, the record low minimum extent. Light gray shading indicates the region where ice occurred in both 2007 and 2010, while white and dark gray areas show ice cover unique to 2010 and to 2007, respectively. Sea Ice Index data. About the data. —Credit: National Snow and Ice Data Center
High-resolution image
Comparison of the 2010 and 2007 September minima
At the 2010 seasonal minimum, ice remained fairly extensive in the East Siberian Sea, compared to 2007, when this area was ice free. 2010 ended up having less ice than 2007 in the Beaufort Sea and in the East Greenland Sea. Both the Northwest Passage and Northern Sea Route (along the shores of Eurasia) were open at the 2010 sea ice minimum, whereas in 2007, ice blocked part of the Northern Sea Route.
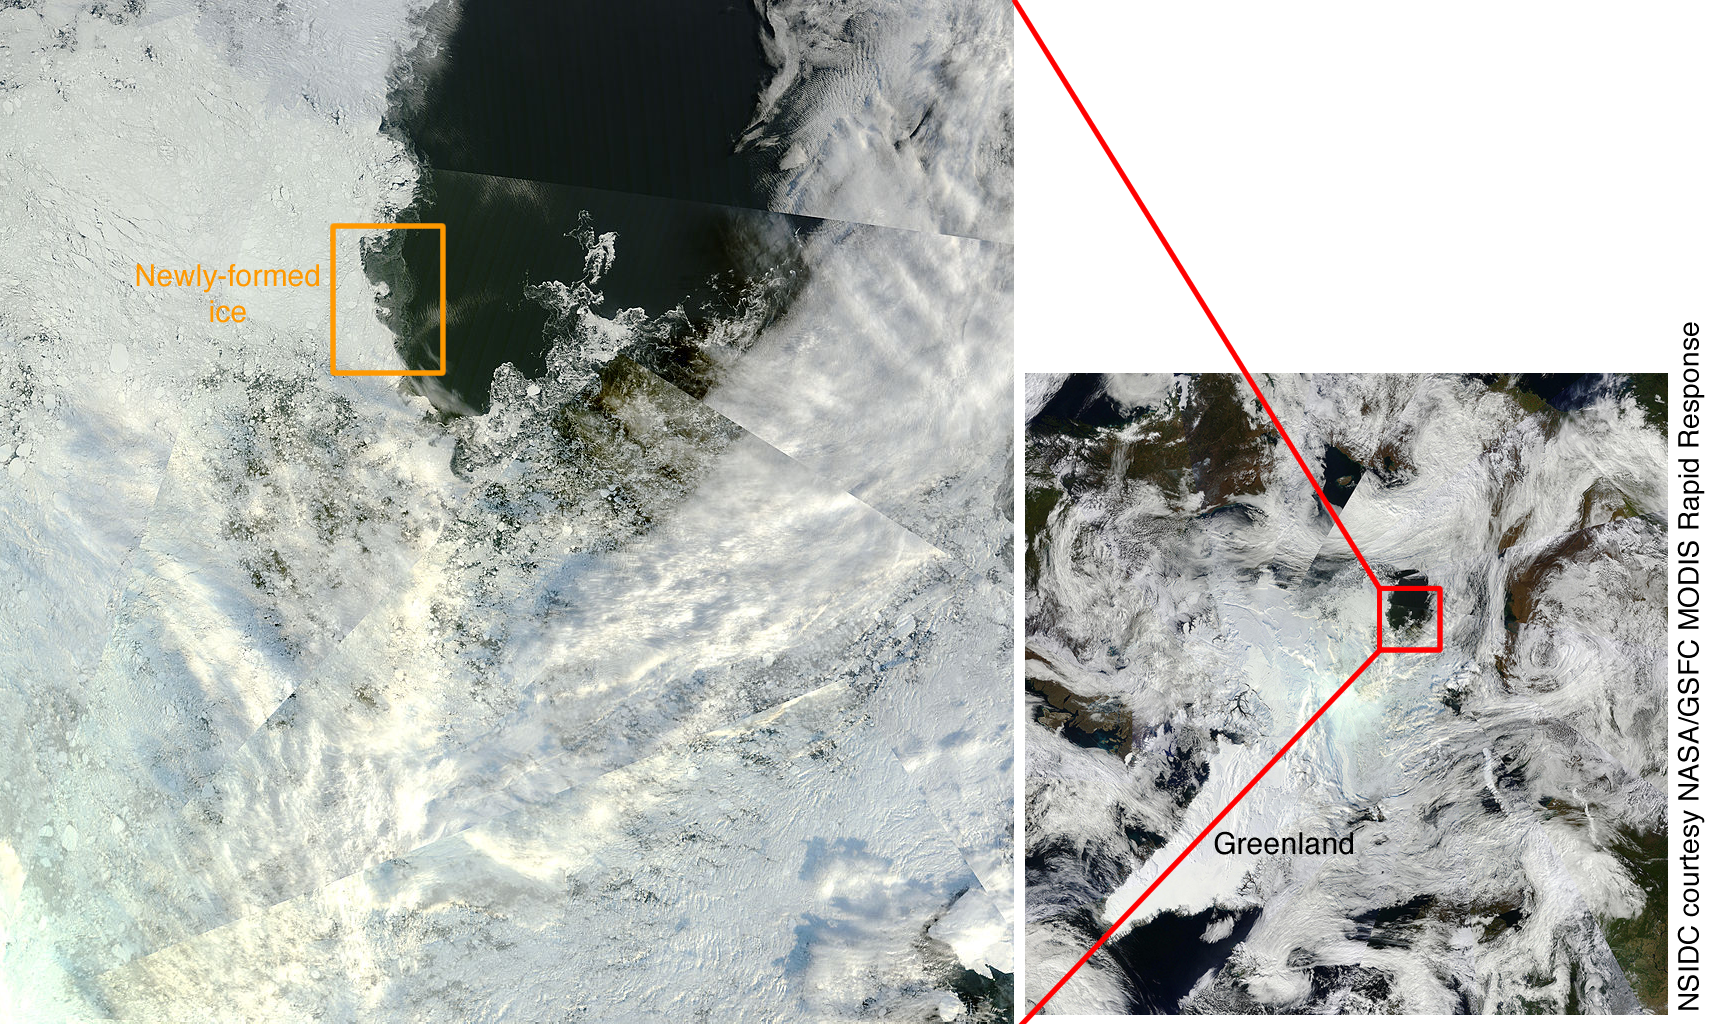
Figure 4. This image, from the NASA MODIS sensor on the Aqua satellite on September 14, shows new ice (dark gray region within circled area) is evident, growing outward from the remaining ice pack (white colored region) in the northwestern East Siberian Sea. The new ice appeared within the previous two days. —Credit: NSIDC courtesy NASA/GSFC MODIS Rapid Response
High-resolution image
Evidence of freeze onset
Visible imagery from the NASA Moderate Resolution Imaging Spectroradiometer (MODIS) confirms that freeze-up is starting in some parts of the Arctic. Growth of new ice is visible in the image from September 14, 2010 extending off the remaining ice pack in the northwestern part of the East Siberian Sea. The new ice formed within the past couple days. Extent may still be declining in other regions, primarily due to heat from ocean waters.
Because of the variability of sea ice at this time of year, the National Snow and Ice Data Center determines the minimum using a five-day running mean value. We have now seen four days of gains in extent. It is still possible that ice extent could fall slightly, because of either further melting or a contraction in the area of the pack due to the motion of the ice. For example, in 2005, the time series began to level out in early September, prompting speculation that we had reached the minimum. However, the sea ice contracted later in the season, again reducing sea ice extent and causing a further drop in the absolute minimum. When all the data for September are in, we will confirm the minimum ice extent for the season.
Final analysis pending
In the beginning of October, NSIDC will issue a formal announcement with a full analysis of the melt season, and graphics comparing this year to the long-term record. We will also announce the monthly average September sea ice extent, the measure scientists rely on for accurate analysis and comparison over the long term.
We will continue to post analyses of sea ice conditions throughout the year, with frequency determined by sea ice conditions. The near-real-time daily image update will continue each day.
For previous analyses, please see the drop-down menu under Archives in the right navigation at the top of this page.

