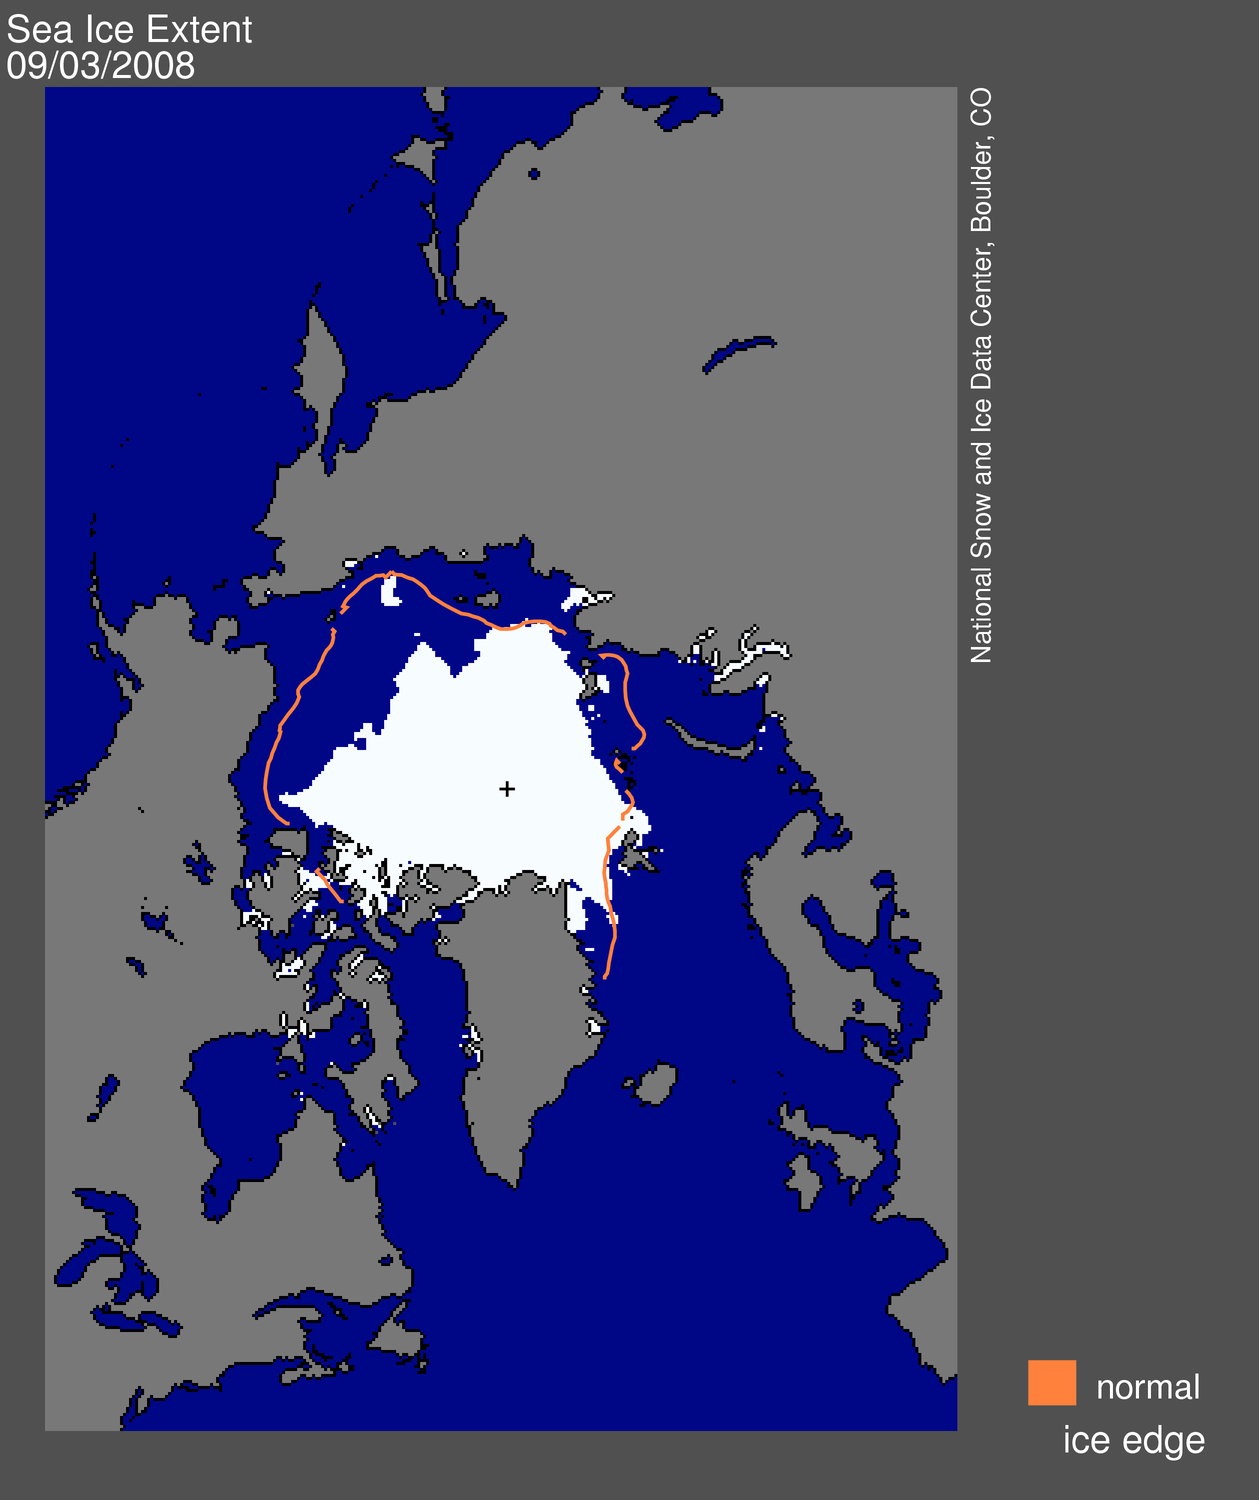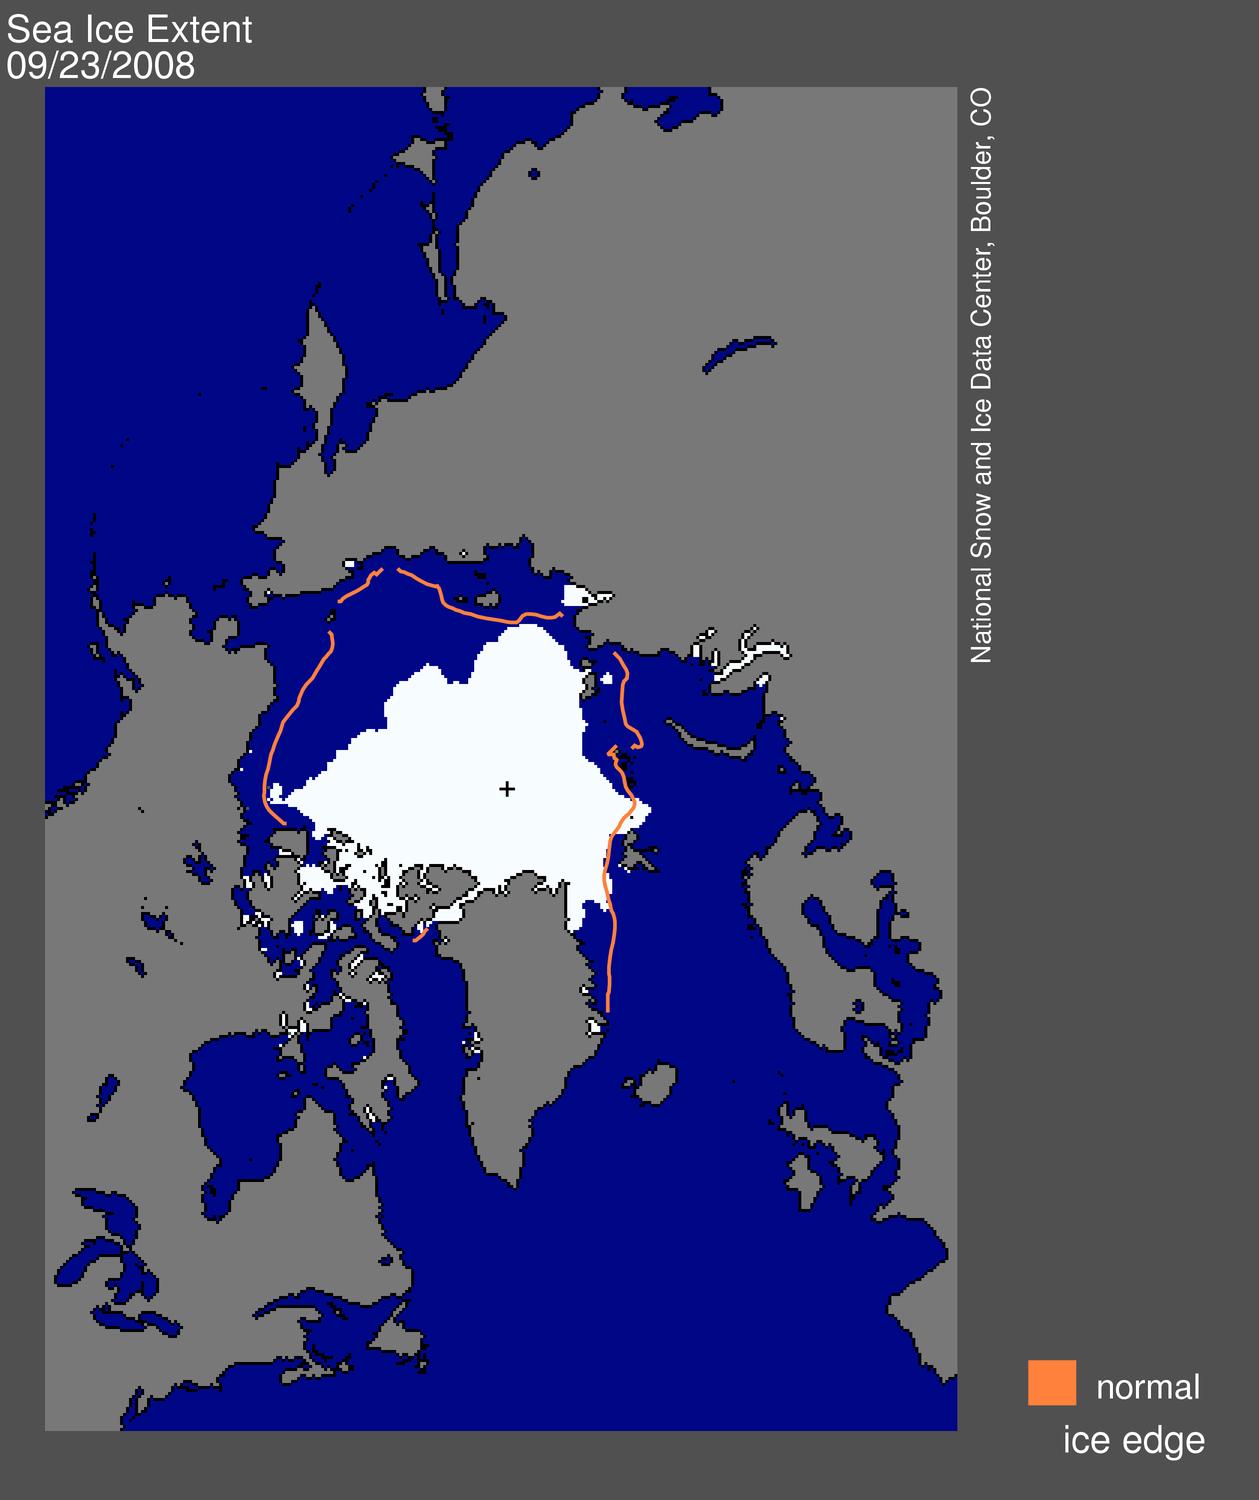
Figure 1. Daily Arctic sea ice extent for September 23, 2008, was 4.59 million square kilometers (1.77 million square miles). The orange line shows the 1979 to 2000 average extent for that day. The black cross indicates the geographic North Pole. Sea Ice Index data. About the data.
—Credit: National Snow and Ice Data Center
High-resolution image
Overview of conditions
Arctic sea ice extent on September 23, 2008, was 4.59 million square kilometers (1.77 million square miles), an increase of 77,000 square kilometers (30,000 square miles) above the minimum extent of 4.52 million square kilometers (1.74 million square miles) measured last week.
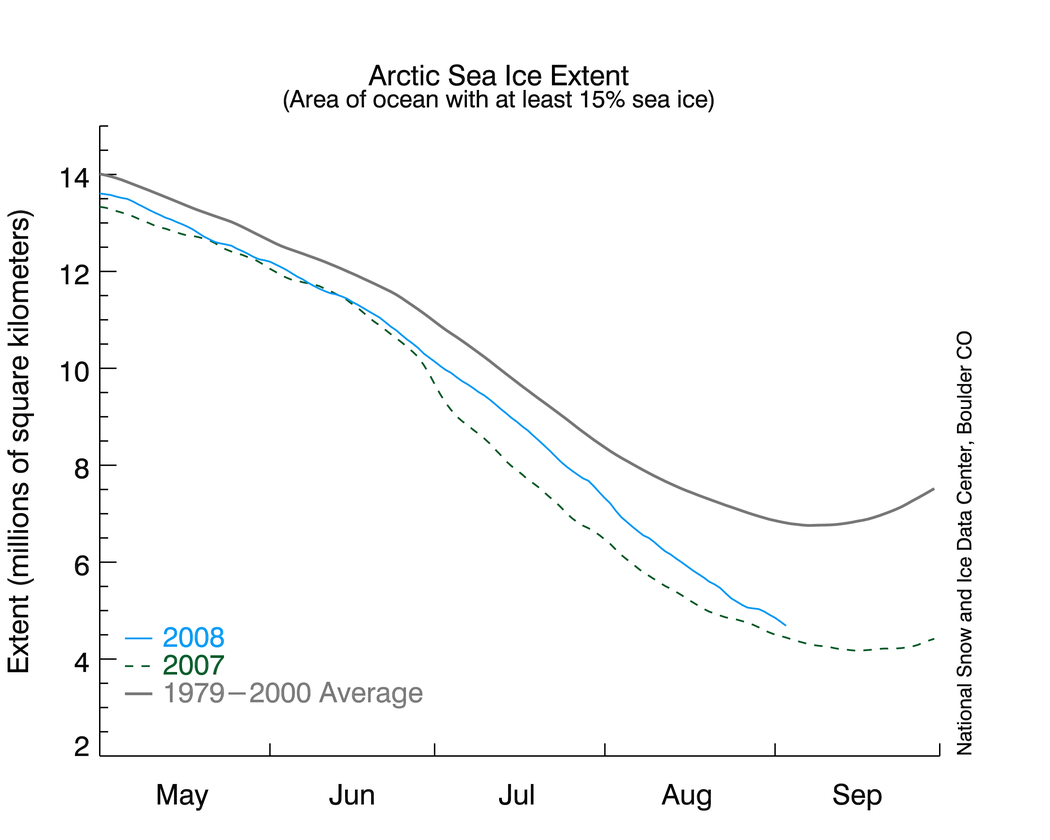
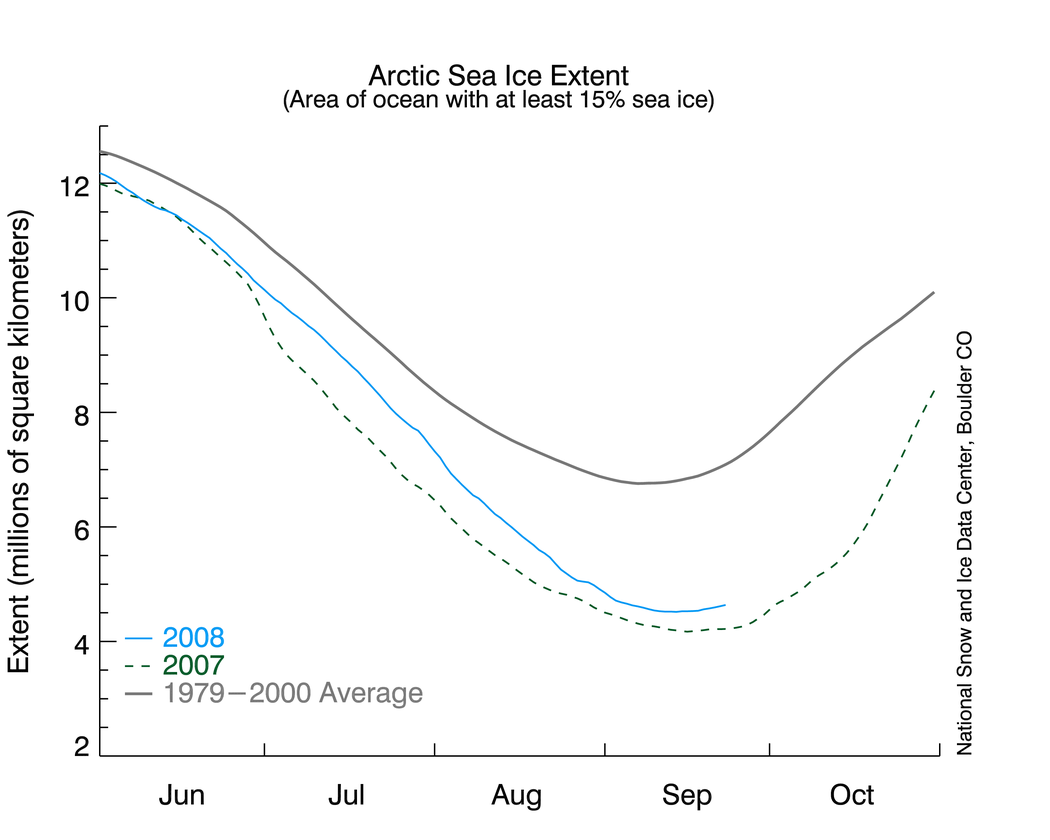 Figure 2. The graph above shows daily sea ice extent.The solid light blue line indicates 2008; the dashed green line shows 2007; and the solid gray line indicates average extent from 1979 to 2000. Sea Ice Index data.
—Credit: National Snow and Ice Data Center
High-resolution image
Conditions in context
Arctic sea ice extent, after reaching its seasonal minimum last week, has begun its annual cyclical increase in response to autumn cooling. The ice will grow over the cold, dark winter months and reach its maximum annual extent sometime next March.
During the intervening time, NSIDC will continue to provide updates on conditions. Also, note that as the season of ice growth progresses, NSIDC will slide the x-axis in Figure 2 to focus on the five-month window around the most current month. In our January entry, we will include a calendar-based full-year timeseries showing January 2008 through December 2008 extent compared to 2007 and to the 1979 to 2000 average.
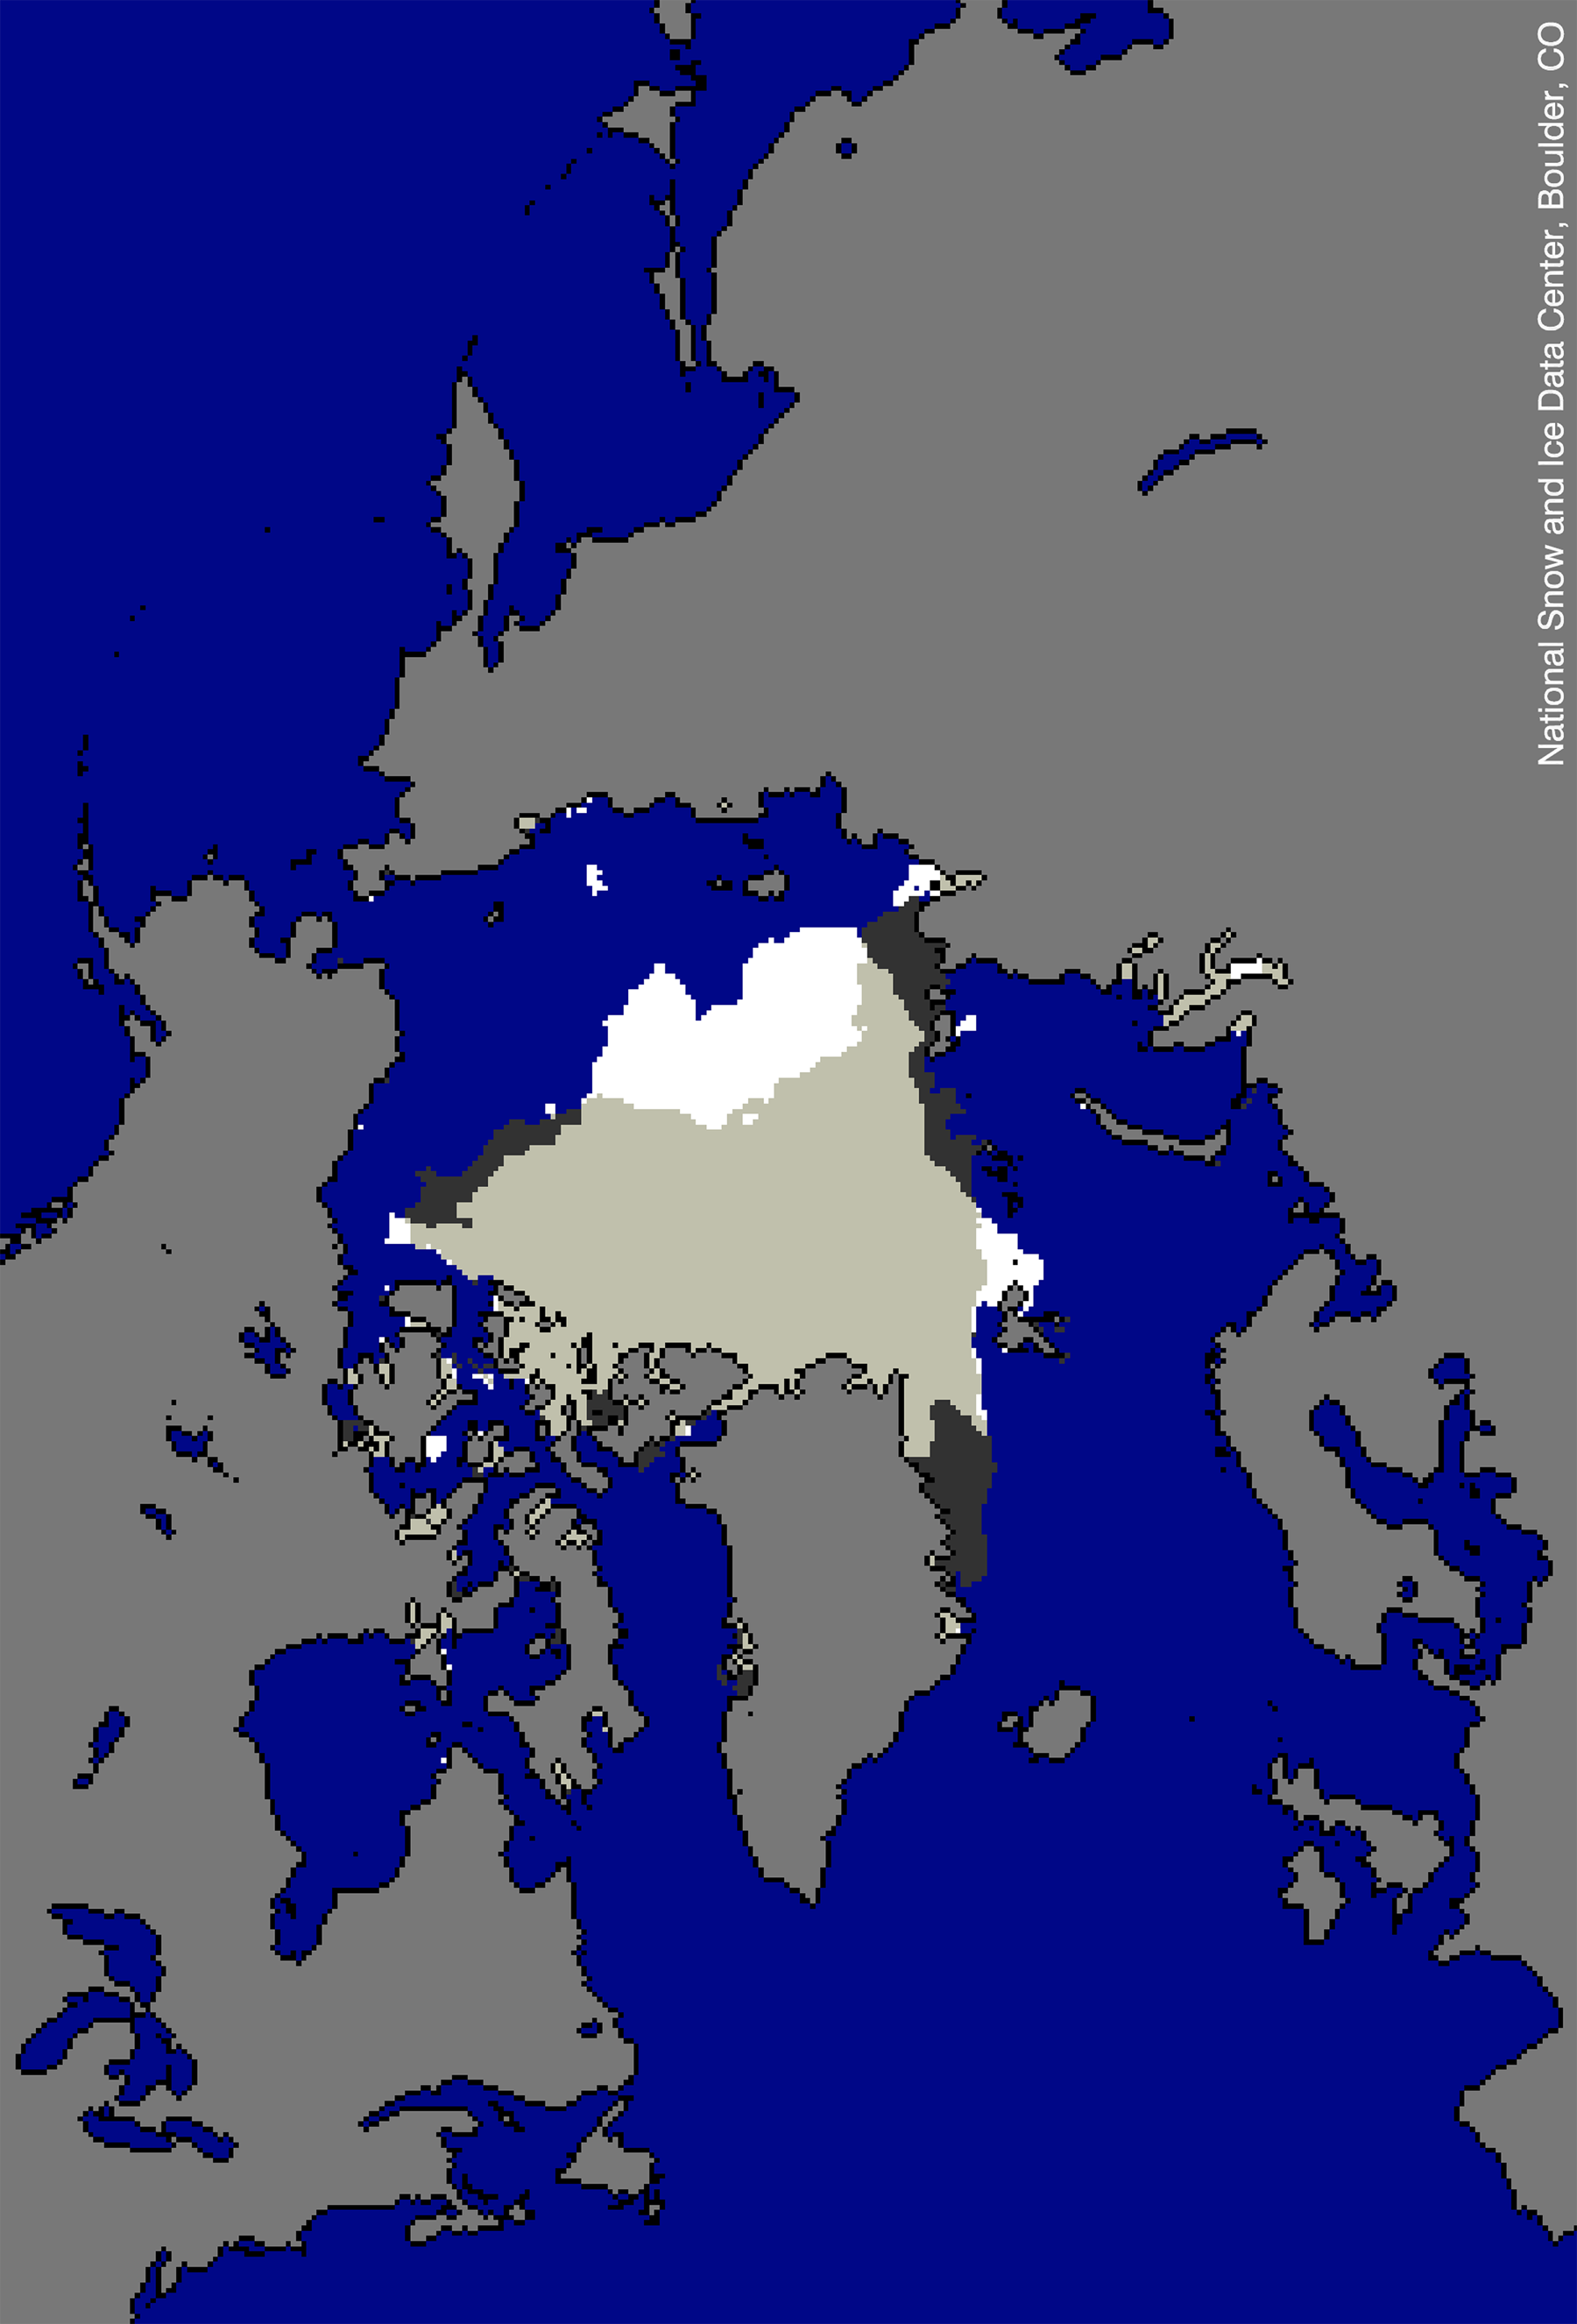
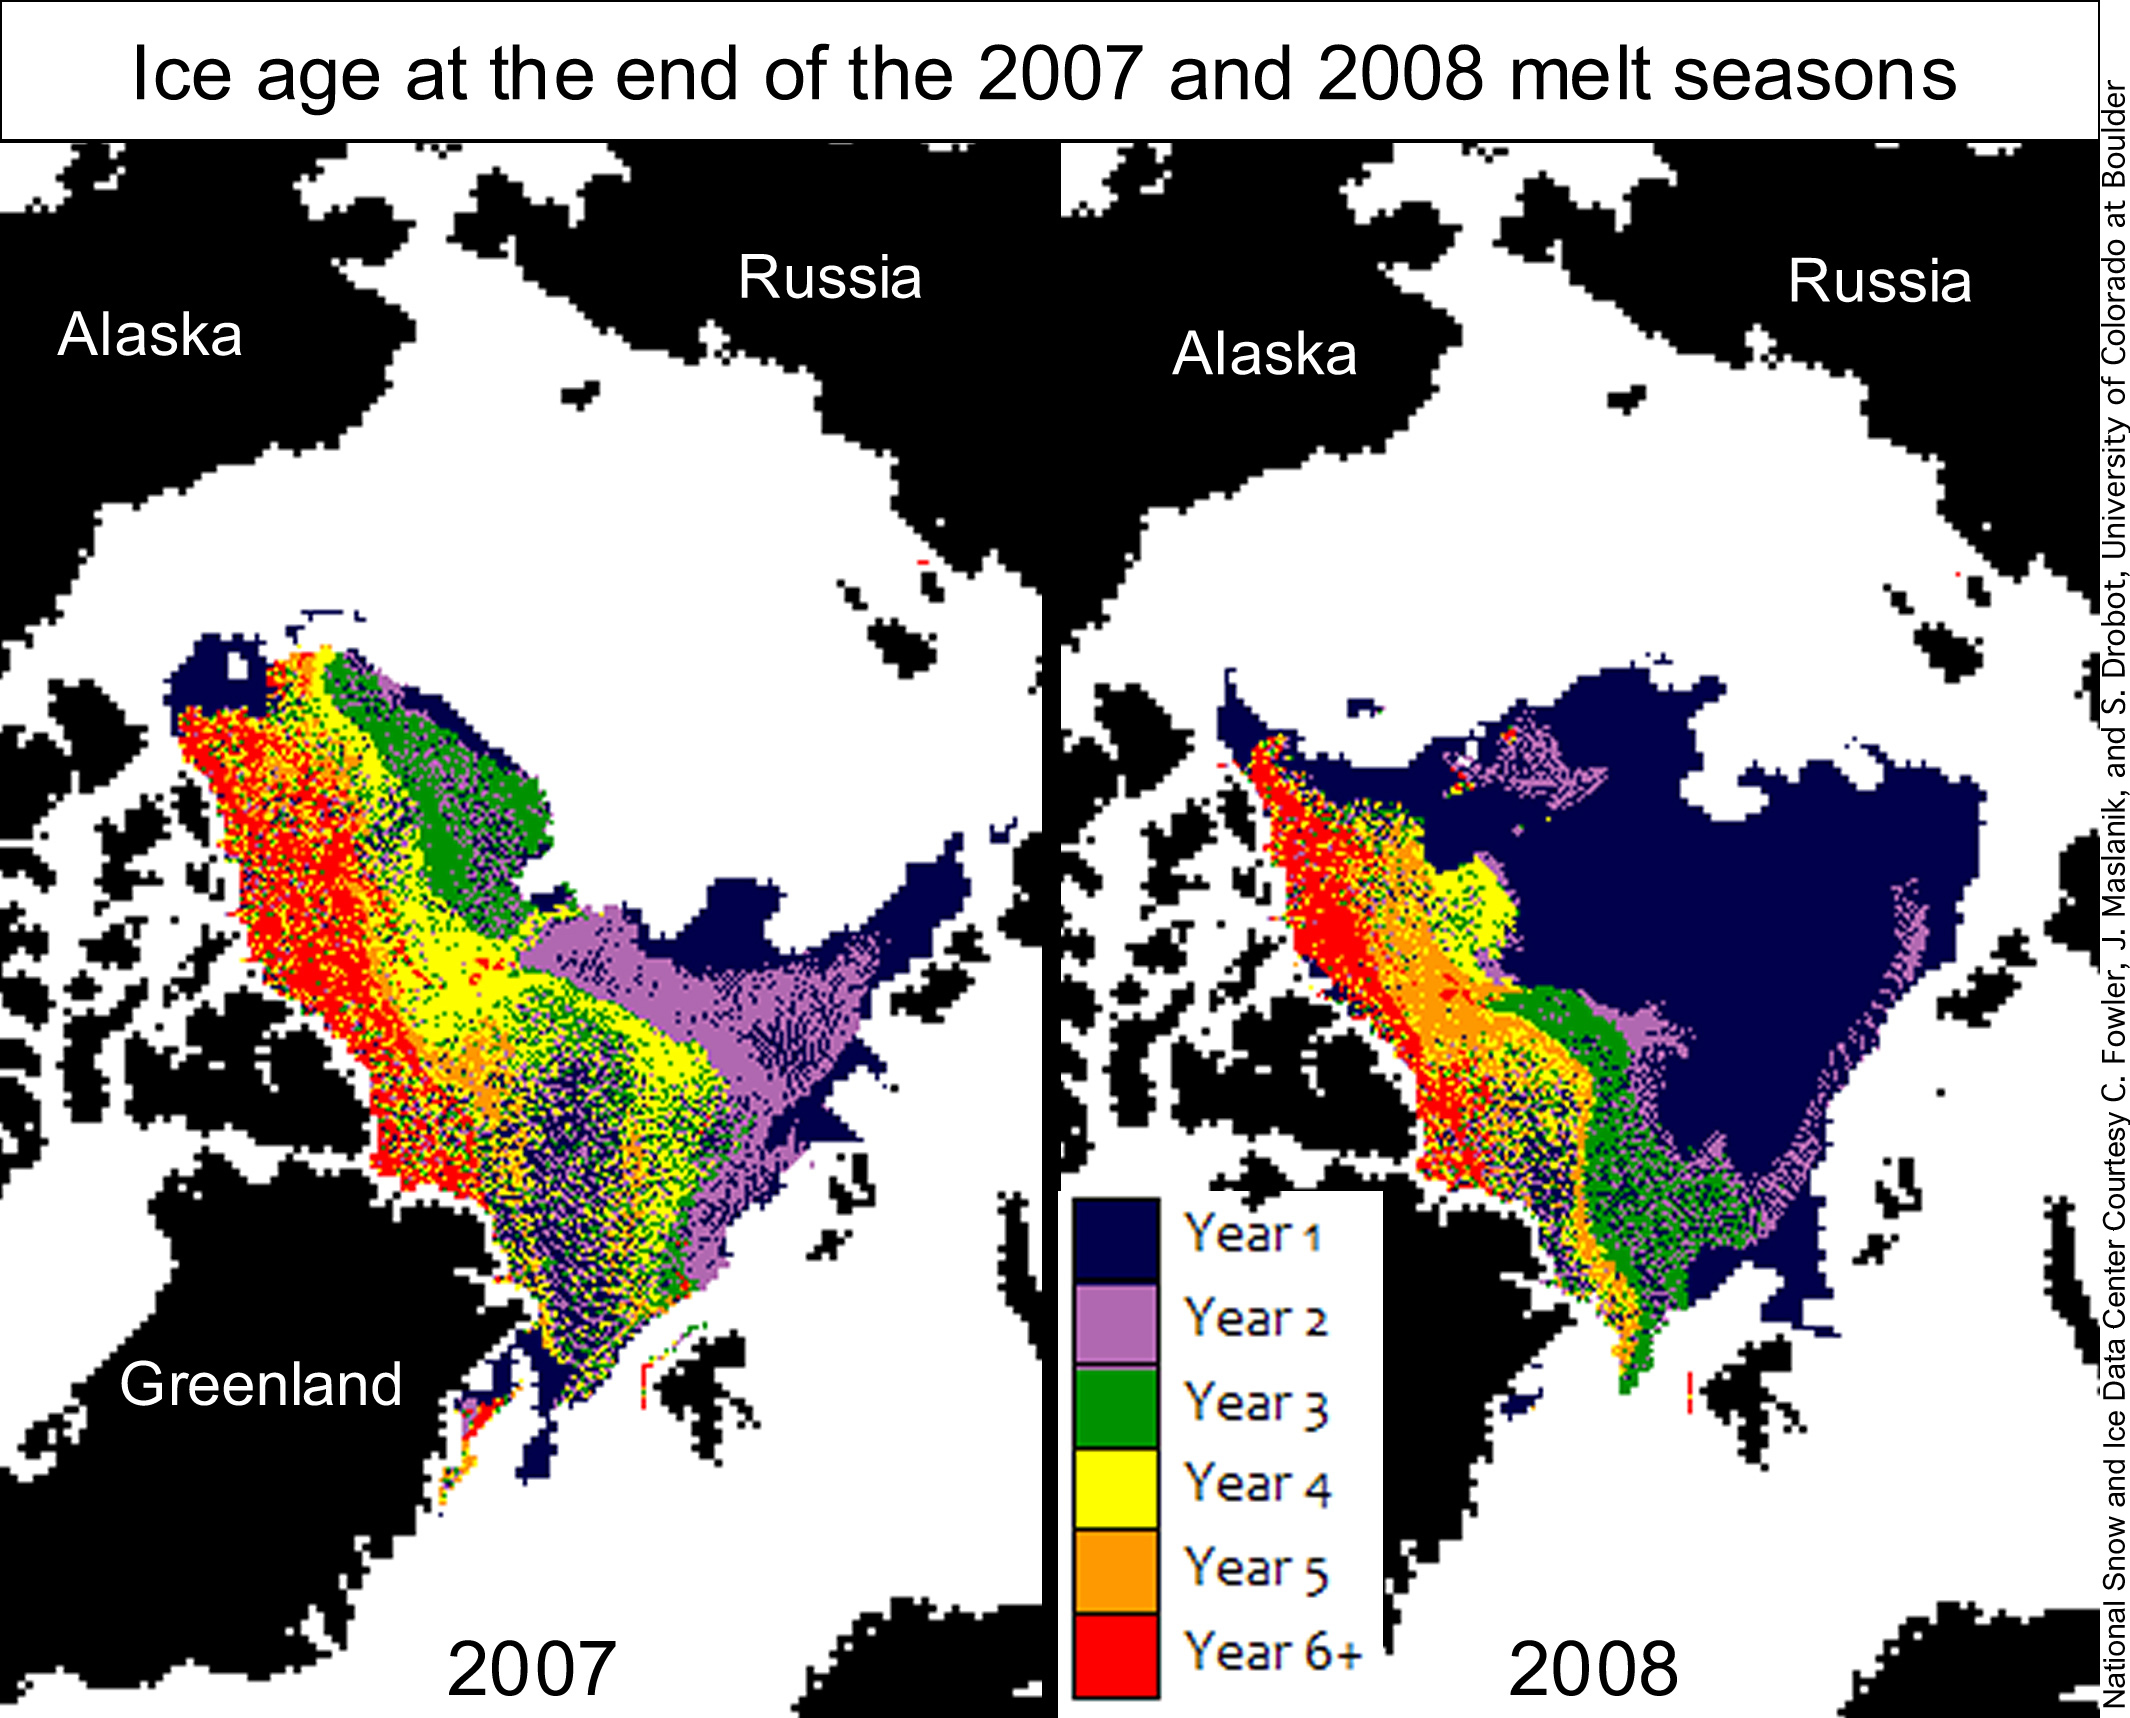 Figure 3. Comparison of sea ice age during the second full week of September reveals that the Arctic will enter the winter ice growth season with less multiyear ice (bright colors), but far more first-year ice (dark blue) this year than it did in 2007. White indicates water; black indicates land.—Credit: From National Snow and Ice Data Center courtesy
C. Fowler, J. Maslanik, and S. Drobot, University of Colorado at Boulder
High-resolution image
High retention of first-year ice
Perhaps the most interesting aspect of the 2008 melt season was the higher-than-average retention of first-year sea ice (see earlier entries, including April 7). Relatively thin first-year ice is more prone to melting out completely than older, thicker ice. However, more of this year’s first-year ice survived the melt season than is typical. Sea ice age maps from Sheldon Drobot, our colleague at the University of Colorado at Boulder, show that much more first-year ice survived in 2008 than in 2007. This is one of the reasons that 2008 did not break last year’s record-low minimum.
One cause of the high first-year ice survival rate was that this summer was cooler than in 2007. Lower temperatures slowed the melt rate in the early part of the season. While conditions in August favored rapid ice loss, they were not enough to make up for this early-season “cushion.” Furthermore, much of this year’s first-year ice was located at higher latitudes than in 2007, covering even the geographic North Pole. Regions that are far north have lower melt rates because they receive less solar energy than more southerly regions.
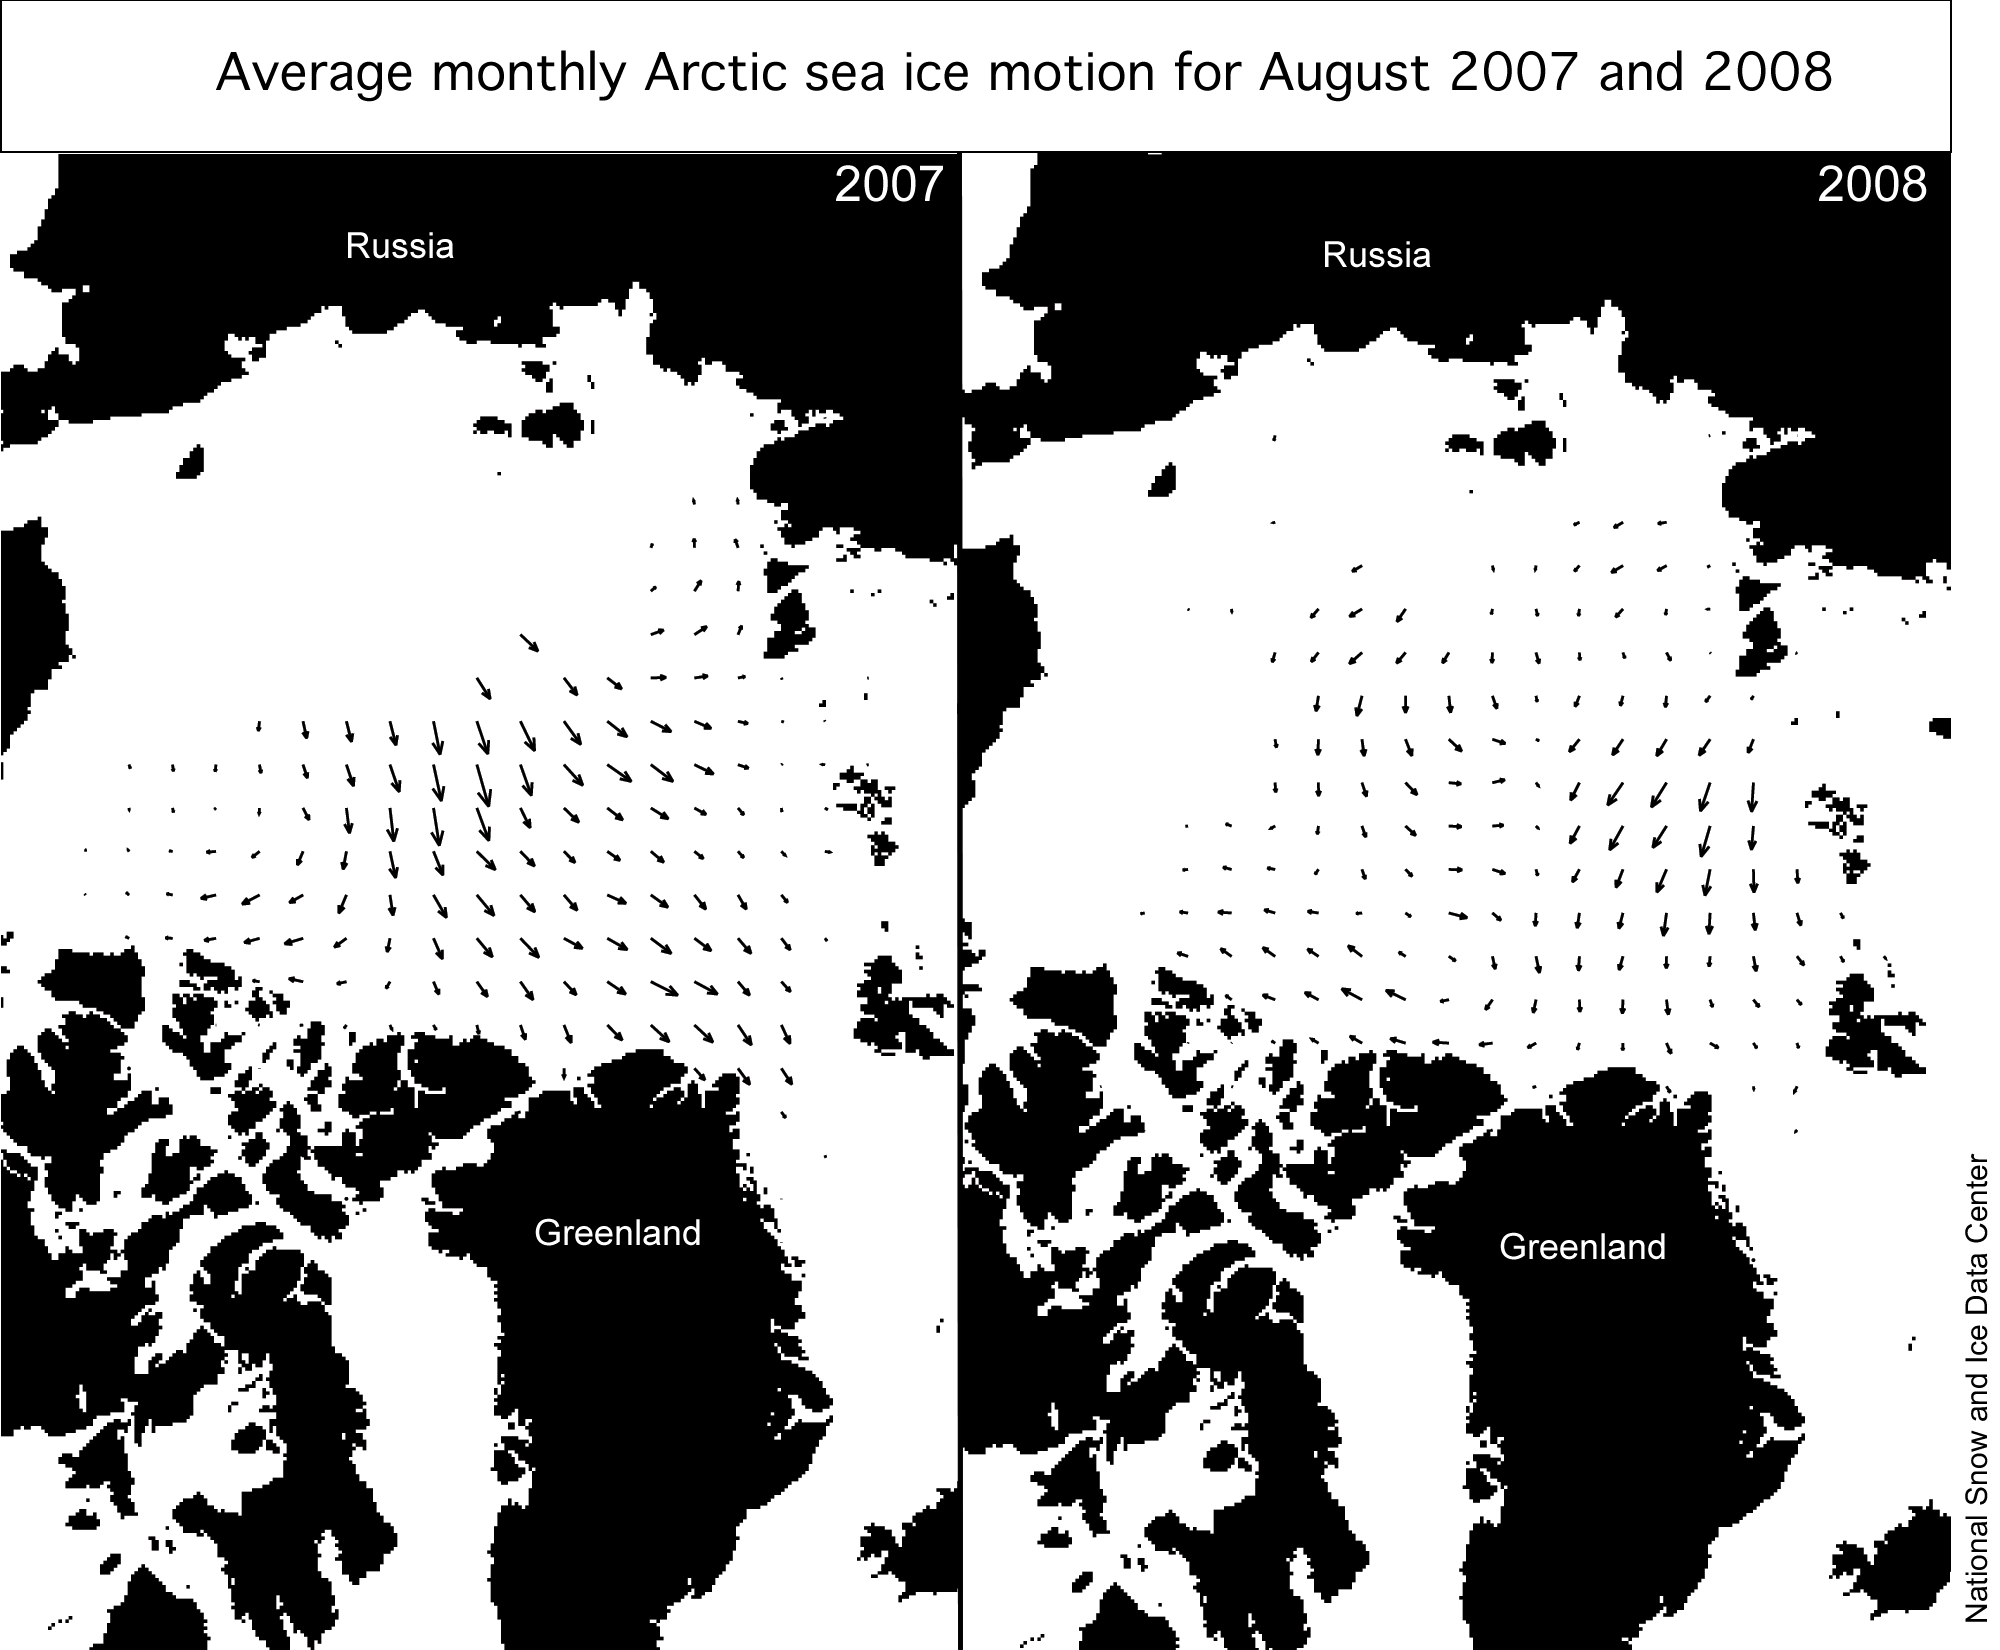
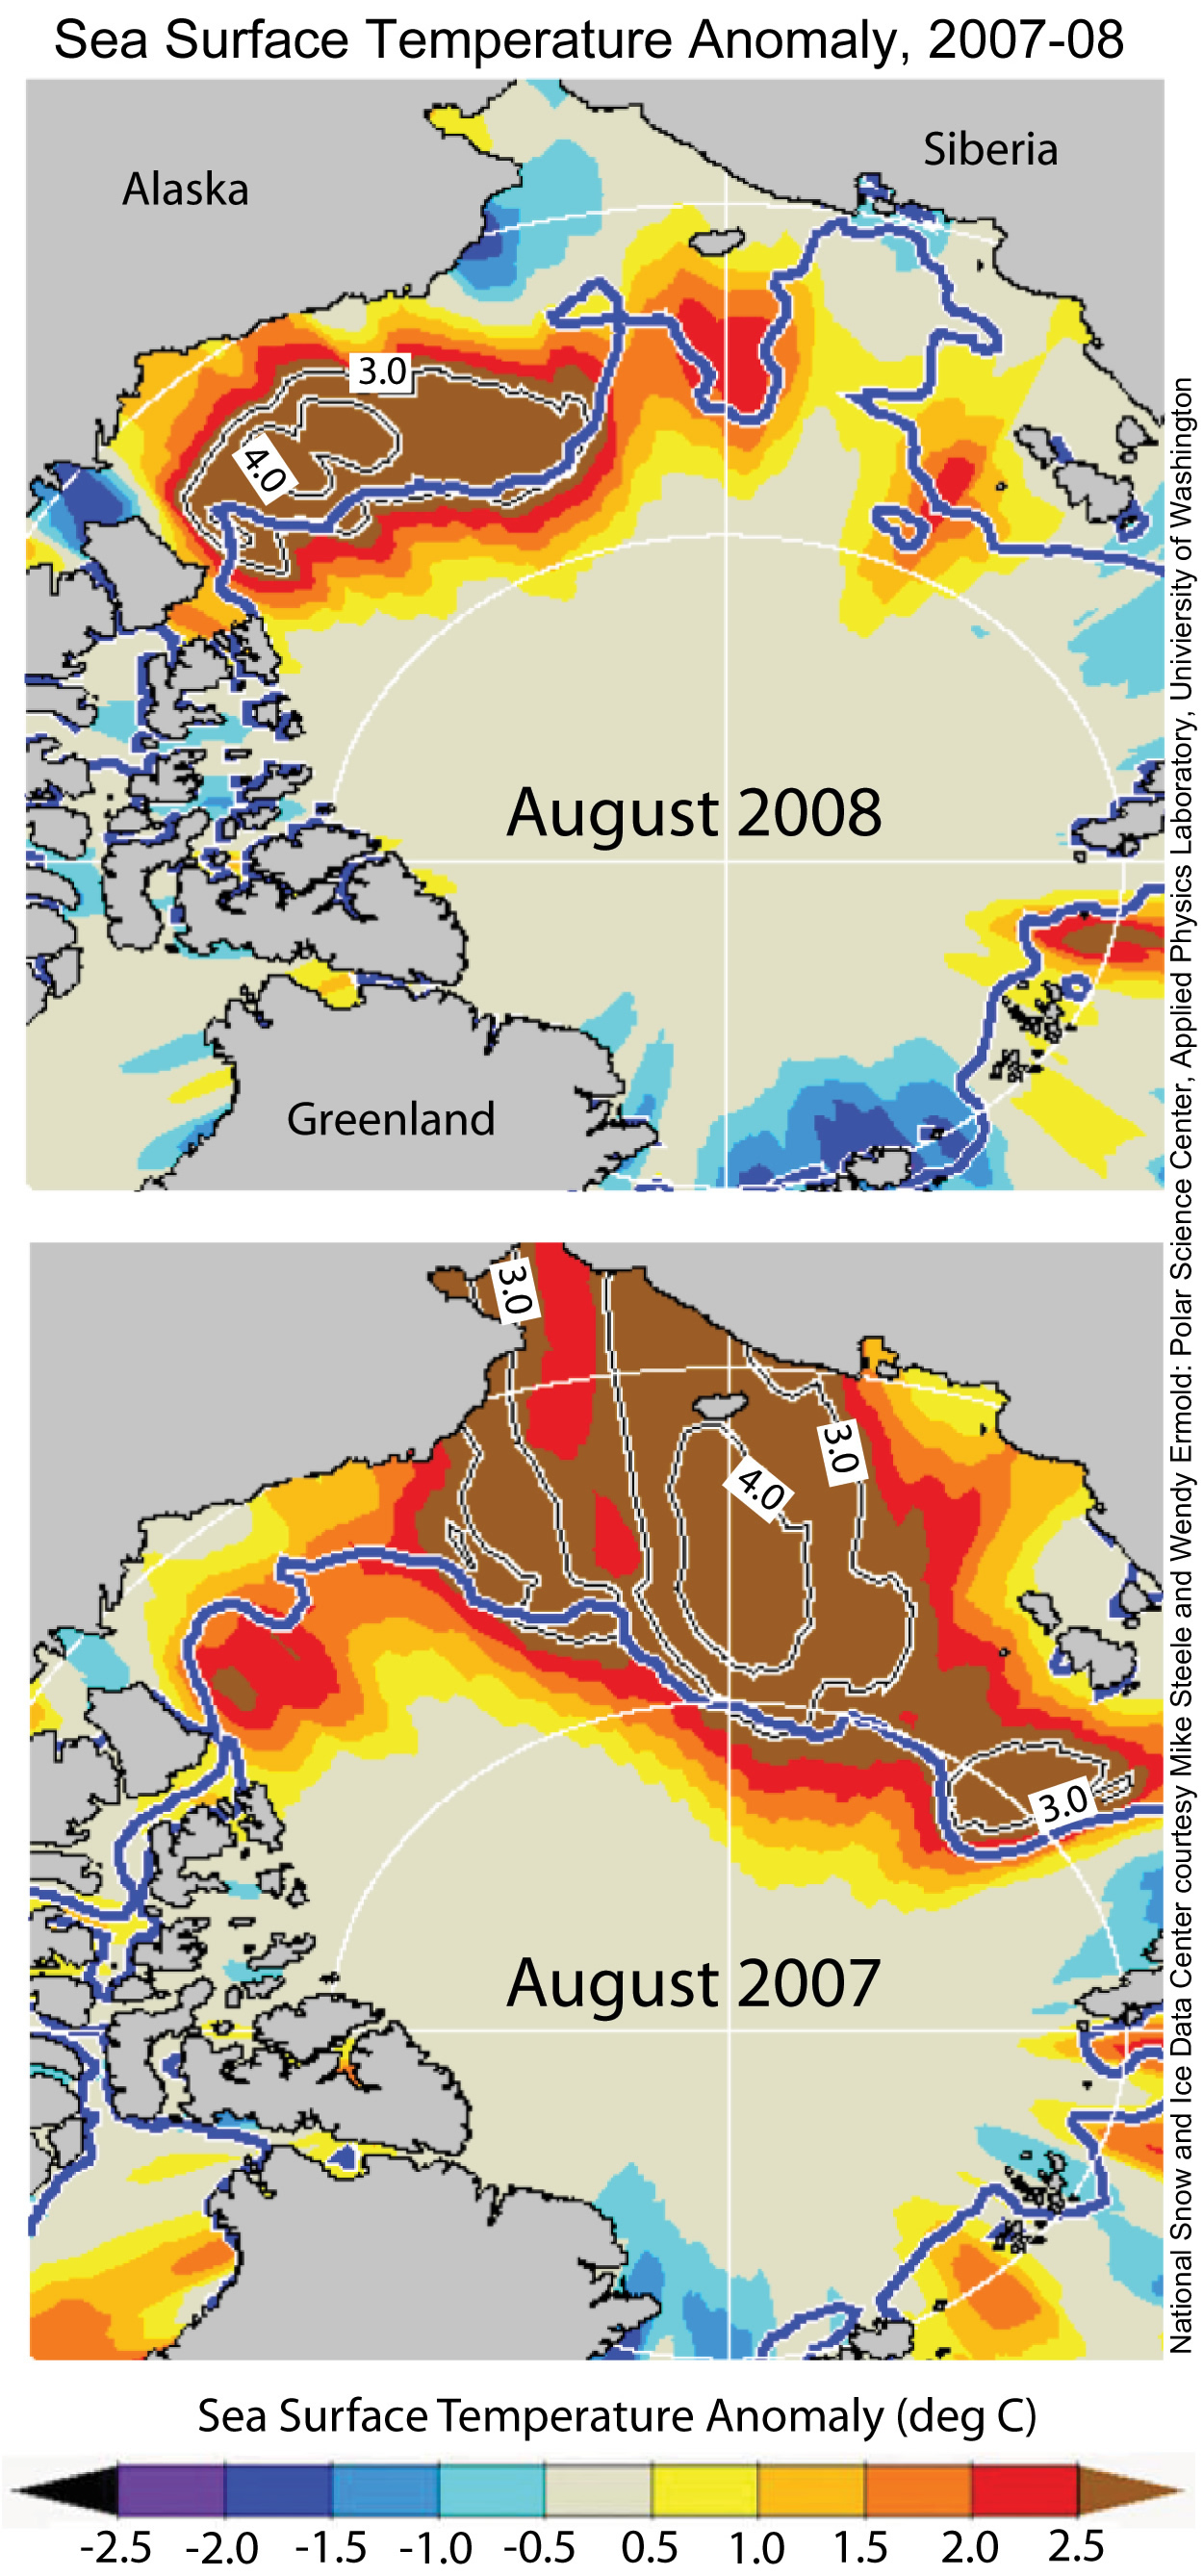
Figure 4. Ice motion in 2007 compacted the ice pack; in 2008, ice motion did not have this effect. Average August ice motion
captures the differences between the two years, with black arrows indicating ice motion. Sea ice motion derived using data from the NASA AMSR-E sensor.
—Credit: National Snow and Ice Data Center
High-resolution image
Dispersive sea ice motion
Sea ice motion also helps determine how the ice will fare each melt season. In 2007, a strong northward sea ice motion at the end of the melt season pushed ice floes together, compacting the ice. The tightly packed ice and high temperatures worked together to create a record-low extent.
This year, the wind patterns were different, leading to a less compacted ice cover. This, paired with slower summer melt, helped keep the overall extent larger.
For previous analysis, please see the drop-down menu under Archives in the right navigation at the top of this page.