Arctic sea ice extent has declined through the month of May as summer approaches. Daily ice extents in May continued to be below the long-term average and approached the low levels seen at this time last year. As discussed in our last posting, the spring ice cover is thin. One sign of thin and fairly weak ice is the formation of several polynyas in the ice pack.
A note on satellite update and intercalibration
The DMSP F13 satellite that has been central to our Arctic sea ice analysis for the past several years is nearing the end of its mission. As is standard data practice, we have transitioned to a newer sensor, in this case the DMSP F15. The DMSP F15 has the same type of sensor as the DMSP F13.
NSIDC has done preliminary intercalibration to assure consistency with the historical record. Further calibration and processing will be necessary, which may slightly affect final reported ice extent values (on average +/- 30,000 square kilometers or 11,600 square miles per preliminary number reported).
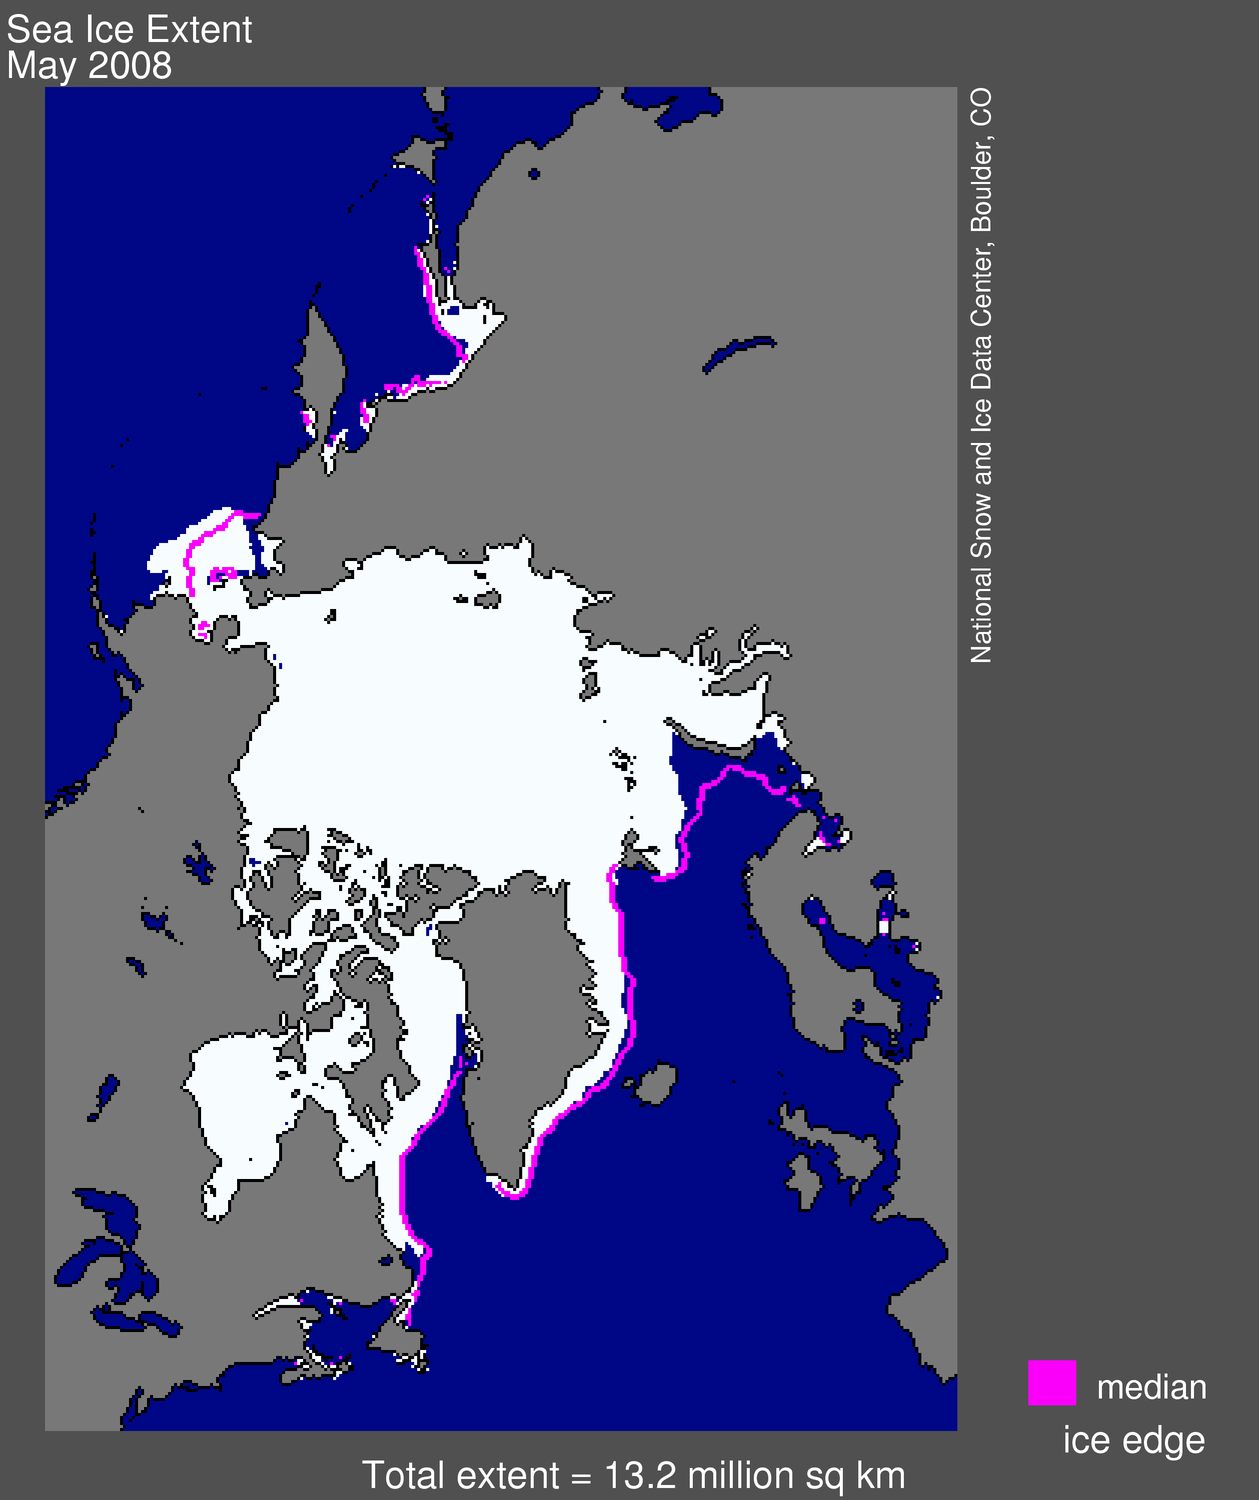
Figure 1. Arctic sea ice extent for May 2008 was 13.18 million square kilometers (5.09 million square miles). The magenta line shows the median ice extent for May from 1979 to 2000. Data information
—Credit: National Snow and Ice Data Center
Overview of conditions
Arctic sea ice extent for May stood at 13.18 million square kilometers (5.09 million square miles), which is 0.28 million square kilometers (0.11 million square miles) greater than May 2007, but is still 0.42 million square kilometers (0.16 million square miles) less than the 1979 to 2000 average for the month.
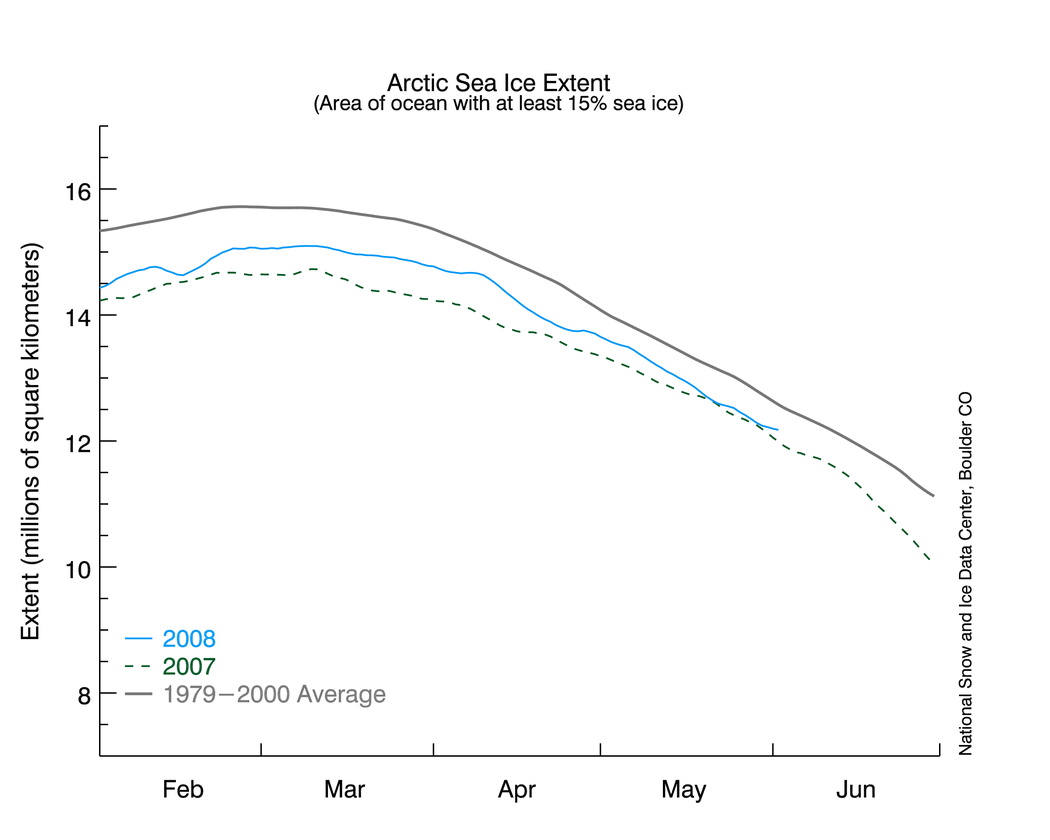
Figure 2. Daily sea ice extent; the blue line indicates 2008; the black line indicates extent from 1979 to 2000; the dotted line shows extent for 2007.
—Credit: National Snow and Ice Data Center
Conditions in context
Although ice extent is slightly greater than this time last year, the average decline rate through the month of May was 8,000 square kilometers per day (3,000 square miles per day) faster than last May. Ice extent as the month closed approached last May’s value.
Average Arctic Ocean surface air temperatures in May were generally higher than normal. While anomalies were modest (+1 to 3 degrees Celsius, +2 to 5 degrees Fahrenheit) over most of the region, temperatures over the Baffin Bay region were as much as 6 degrees C (11 degrees F) above normal. The atmospheric circulation in May was highly variable. The first half of the month saw strong winds blowing from east to west over the southern Beaufort Sea. This wind pattern probably contributed to polynya formation near Banks Island and along the northwestern coast of Alaska.
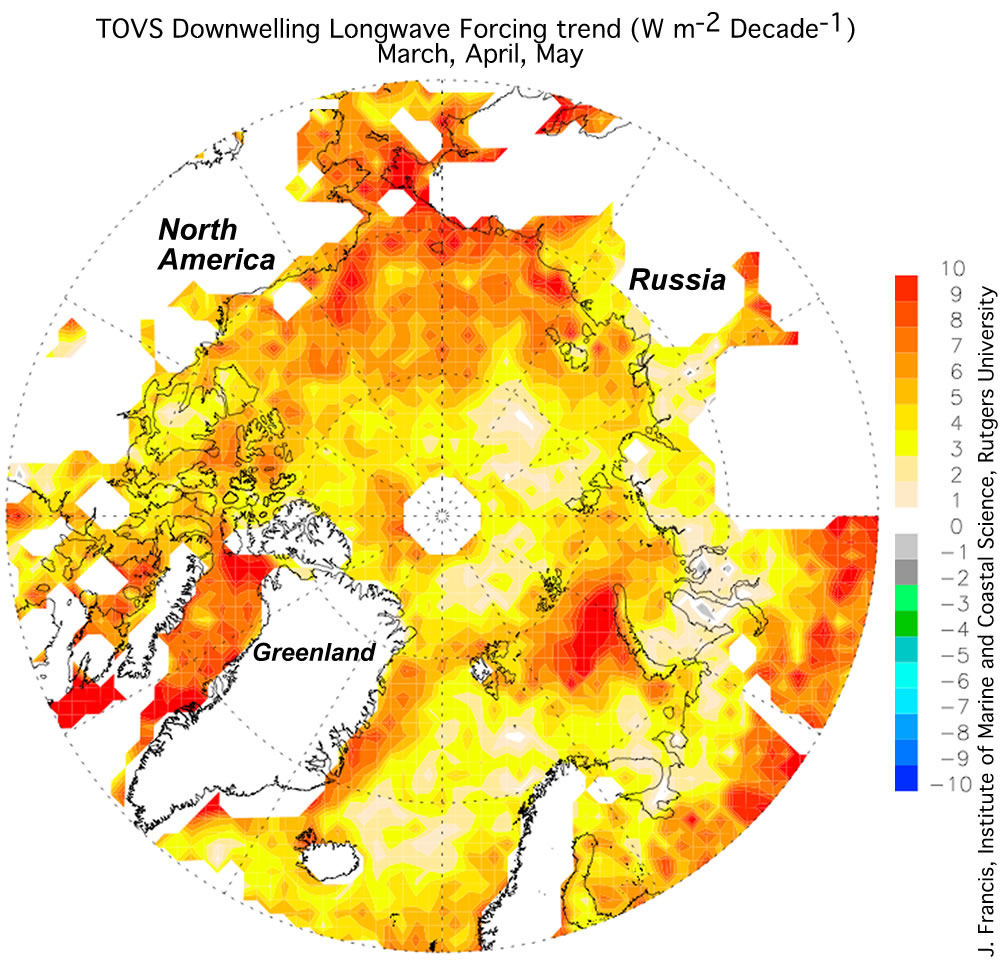
Figure 3. Infrared energy that the atmosphere emits to the surface during spring shows generally positive trends. Units are change in long-wave energy transfer per decade between 1979 and 2005; yellow and red colors are positive trends; white indicates regions without data. Derived from NOAA polar-orbiting satellites.
More on the sea ice-atmosphere connection
The more we study the Arctic’s shrinking sea ice cover, the more we appreciate the key role of clouds and water vapor. Our colleague, Jennifer Francis of Rutgers University, has linked changes in the ice edge northwest of Alaska to variations in springtime cloudiness and in the water vapor content of the lower atmosphere. She has observed an increase in springtime cloud and water vapor over the last three decades that can be clearly linked to retreat of the ice edge.
What is the nature of this link? More clouds act like an umbrella, shading the sea ice surface from the sun’s rays, also called solar radiation. At the same time, clouds act like a warm blanket, transferring heat in the form of long-wave radiation from the atmosphere to the ice surface. More water vapor in the atmosphere contributes to the blanket-like effect. Whether the umbrella or blanket effect dominates determines how much radiation is absorbed at the surface, which in turn influences the rate of ice melt. In spring, solar radiation is still relatively weak. Because of this, the blanketing effect of increased clouds and water vapor wins.
In the summer, the situation is reversed. Clear skies allow the strong radiation of the summer sun to reach the surface and melt sea ice. Anticyclone patterns set up these clear summer conditions. We will be watching closely for the possible onset of these conditions in coming months.
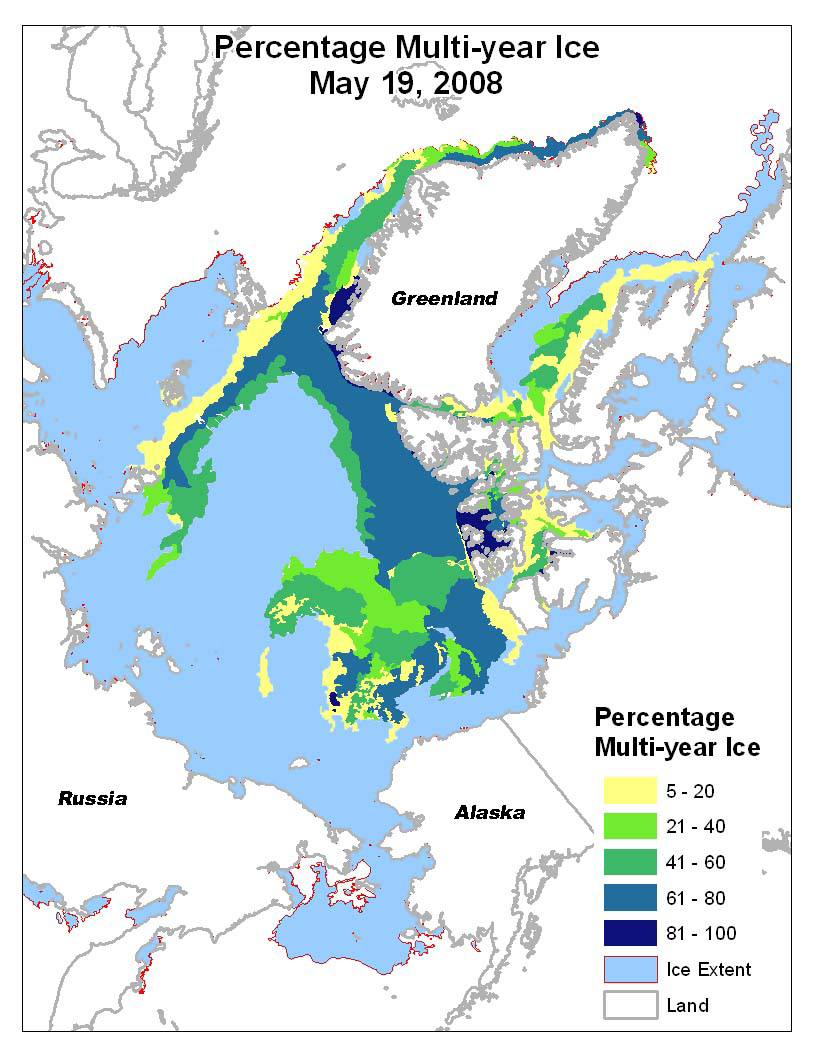
Figure 4. This United States National Ice Center analysis shows the percentage of multi-year sea ice in yellow, green, and dark blue. Light blue with red outline indicates ice extent; land and ocean are white.
Multi-year ice continues to be low
The relative lack of thick, resilient multi-year ice in the Arctic discussed in earlier postings finds further support in the latest analysis from the United States National Ice Center (NIC). NIC uses a variety of satellite imagery, expert analysis, and other information to provide information on the amount and quality of sea ice for ships operating in the Arctic. NIC scientist Todd Arbetter suggests that much of the first-year ice is likely to melt by the end of summer, saying that despite the total ice extent appearing normal, the relative amount of multi-year ice going into this summer is very low when compared to climatological averages. NIC has found that the relative fraction of multi-year ice in the central Arctic has plummeted since the mid-1990s, creating an Arctic prone to increased melt in summer. Arbetter said, “This may be a primary reason for record summertime minimums in recent years.”
However, the unusual location of some of this year’s first-year ice may help more of it survive than otherwise might be expected. This year, much of the first-year ice is farther north than normal, and those northern areas receive weaker solar radiation. So, northern first-year ice may be less vulnerable to melt than first-year ice in typical locations.
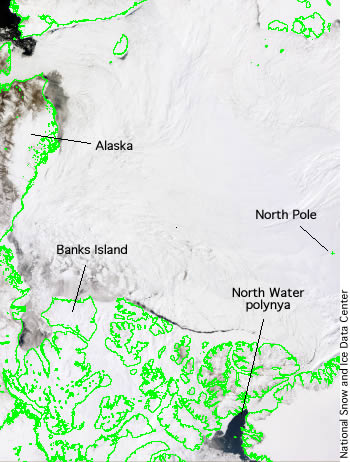
Figure 5. Open water is clearly seen near Alaska and Banks Island, and in the North Water polynya, in this visible-band satellite image mosaic on May 20, 2008. MODIS Terra and Aqua satellite data.
Thinner ice already showing weakness
As mentioned, the thin ice that covers much of the Arctic Ocean is showing signs of early breakup, with large polynyas off the coast of Alaska, the Canadian Archipelago, and Baffin Bay. Coastal polynyas are not unusual, at this time of year, but the polynyas we are currently seeing appear larger and more numerous than usual. This is partly because of the thinner, weaker ice cover.
Thorsten Markus at the NASA Goddard Space Flight Center has noted the size of the North Water polynya at the northern end of Baffin Bay, which typically forms in May. The polynya is much larger than normal, possibly nearing its largest area on record.
Inuit report that sea ice is starting to break up near Baffin Bay much earlier than normal this year. They have observed wide cracks in the ice already forming, according to NSIDC scientist Shari Gearheard, who lives and works in the Baffin Island hamlet of Clyde River.
Polynyas are a source of heat for the atmosphere in spring; in summer, however, they are large absorbers of solar energy. Resultant warm ocean surface waters then eat away at the ice edge, accelerating melt.
References
Francis, J.A. and E. Hunter. 2006. New insight into the disappearing Arctic sea ice. Eos, Trans. Amer. Geophys. Union 87,509-524.
Francis, J.A. and E. Hunter. 2007. Changes in the fabric of the Arctic’s greenhouse blanket. Environmental Research Letters 2, doi:10.1088/1748-9326/2/4/045011.
Markus, T. , and B.A. Burns. 1995. A method to estimate subpixel-scale coastal polynyas with satellite passive microwave data. J. Geophys. Res.100, 4473-4487.
For previous analysis, please see the drop-down menu under Archives in the right navigation at the top of this page.

