Spring has arrived in the Arctic. After peaking at 15.21 million square kilometers (5.87 million square miles) in the second week of March, Arctic sea ice extent has declined through the month of April. April extent has not fallen below the lowest April extent on record, but it is still below the long-term average.
Taken together, an assessment of the available evidence, detailed below, points to another extreme September sea ice minimum. Could the North Pole be ice free this melt season? Given that this region is currently covered with first-year ice, that seems quite possible.
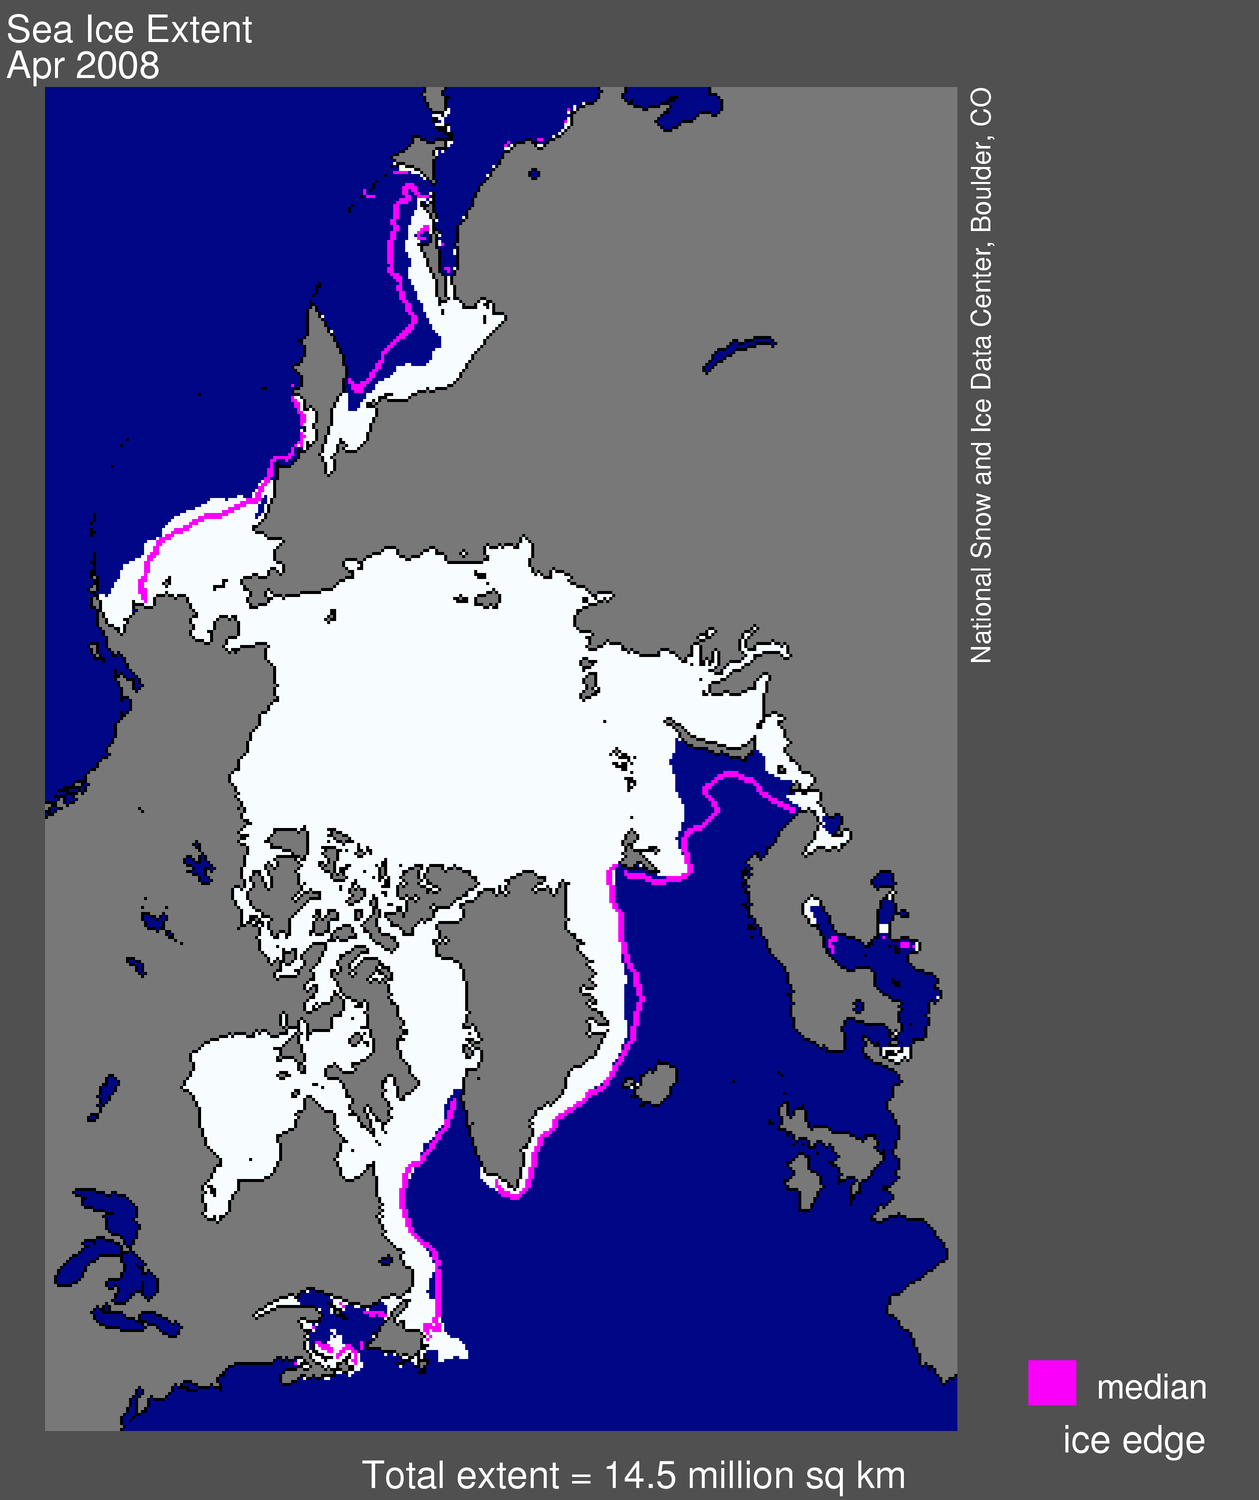
Figure 1. Arctic sea ice extent for April 2008 was 14.49 million square kilometers (5.59 million square miles). The magenta line shows the median ice extent for March from 1979 to 2000. Data Note
Overview of conditions
For the month of April, Arctic sea ice extent stood at 14.49 million square kilometers (5.59 million square miles), which is 0.61 million square kilometers (0.24 million square miles) greater than April 2007, but is still 0.51 million square kilometers (0.20 million square miles) less than the 1979 to 2000 average for April.
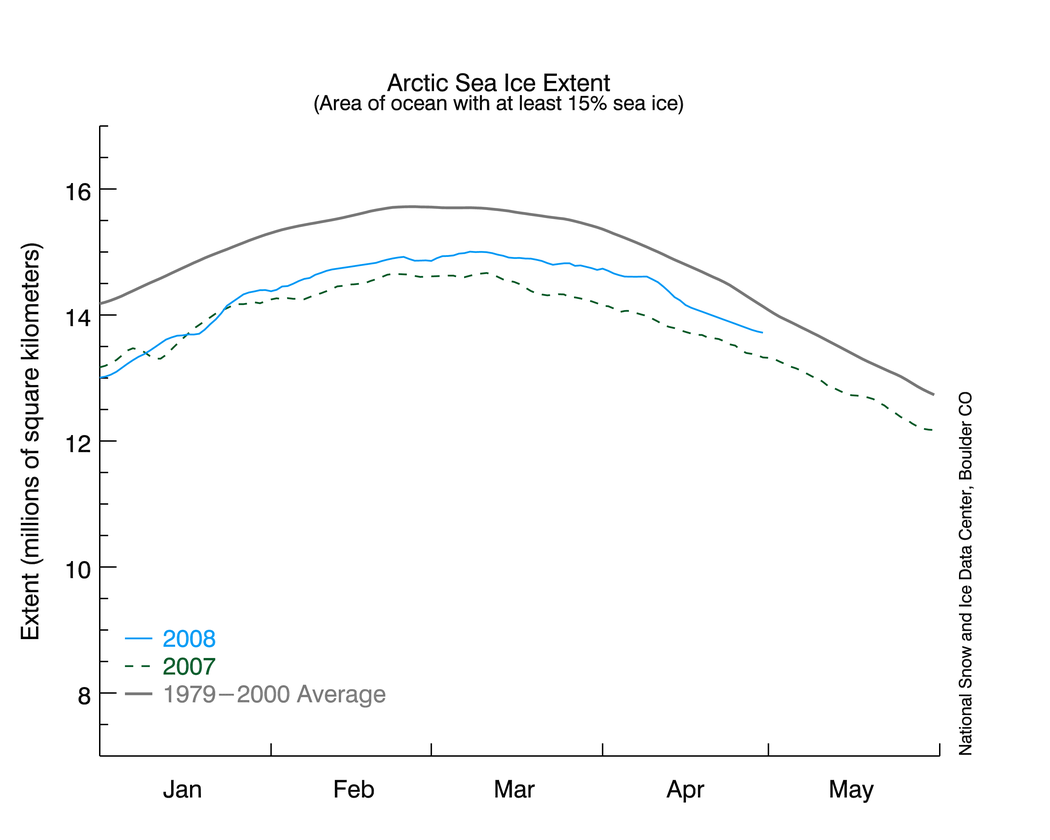
Figure 2. Daily sea ice extent; the blue line indicates 2008; the black line indicates extent from 1979 to 2000; the dotted line shows extent from December 2006 through April 2007.
—Credit: National Snow and Ice Data Center
Conditions in context
Although there is more ice than this time last year, the average decline rate through the month of April was 6,000 square kilometers per day (2,300 square miles per day) faster than last April.
Faster decline reflects warmer Arctic
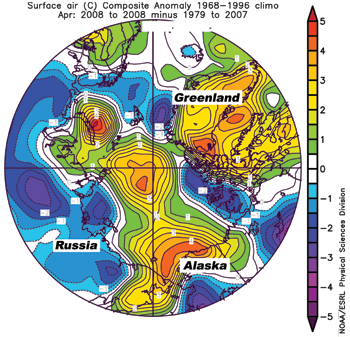
At least part of the explanation for this fairly rapid decline lies in the warm conditions that characterized April over the Arctic Ocean and peripheral seas. Anomalies over some regions exceed 5 degrees Celsius (9 degrees Fahrenheit). For the most part, this unusual warmth is consistent with shifts in atmospheric circulation that bring warm air into the region. The distinct hot spot near Novaya Zemlya, in the upper left quadrant of Figure 3, overlies an open water area where heat is being released to the atmosphere. In past years, this area tended to be ice covered in April, preventing this heat release.
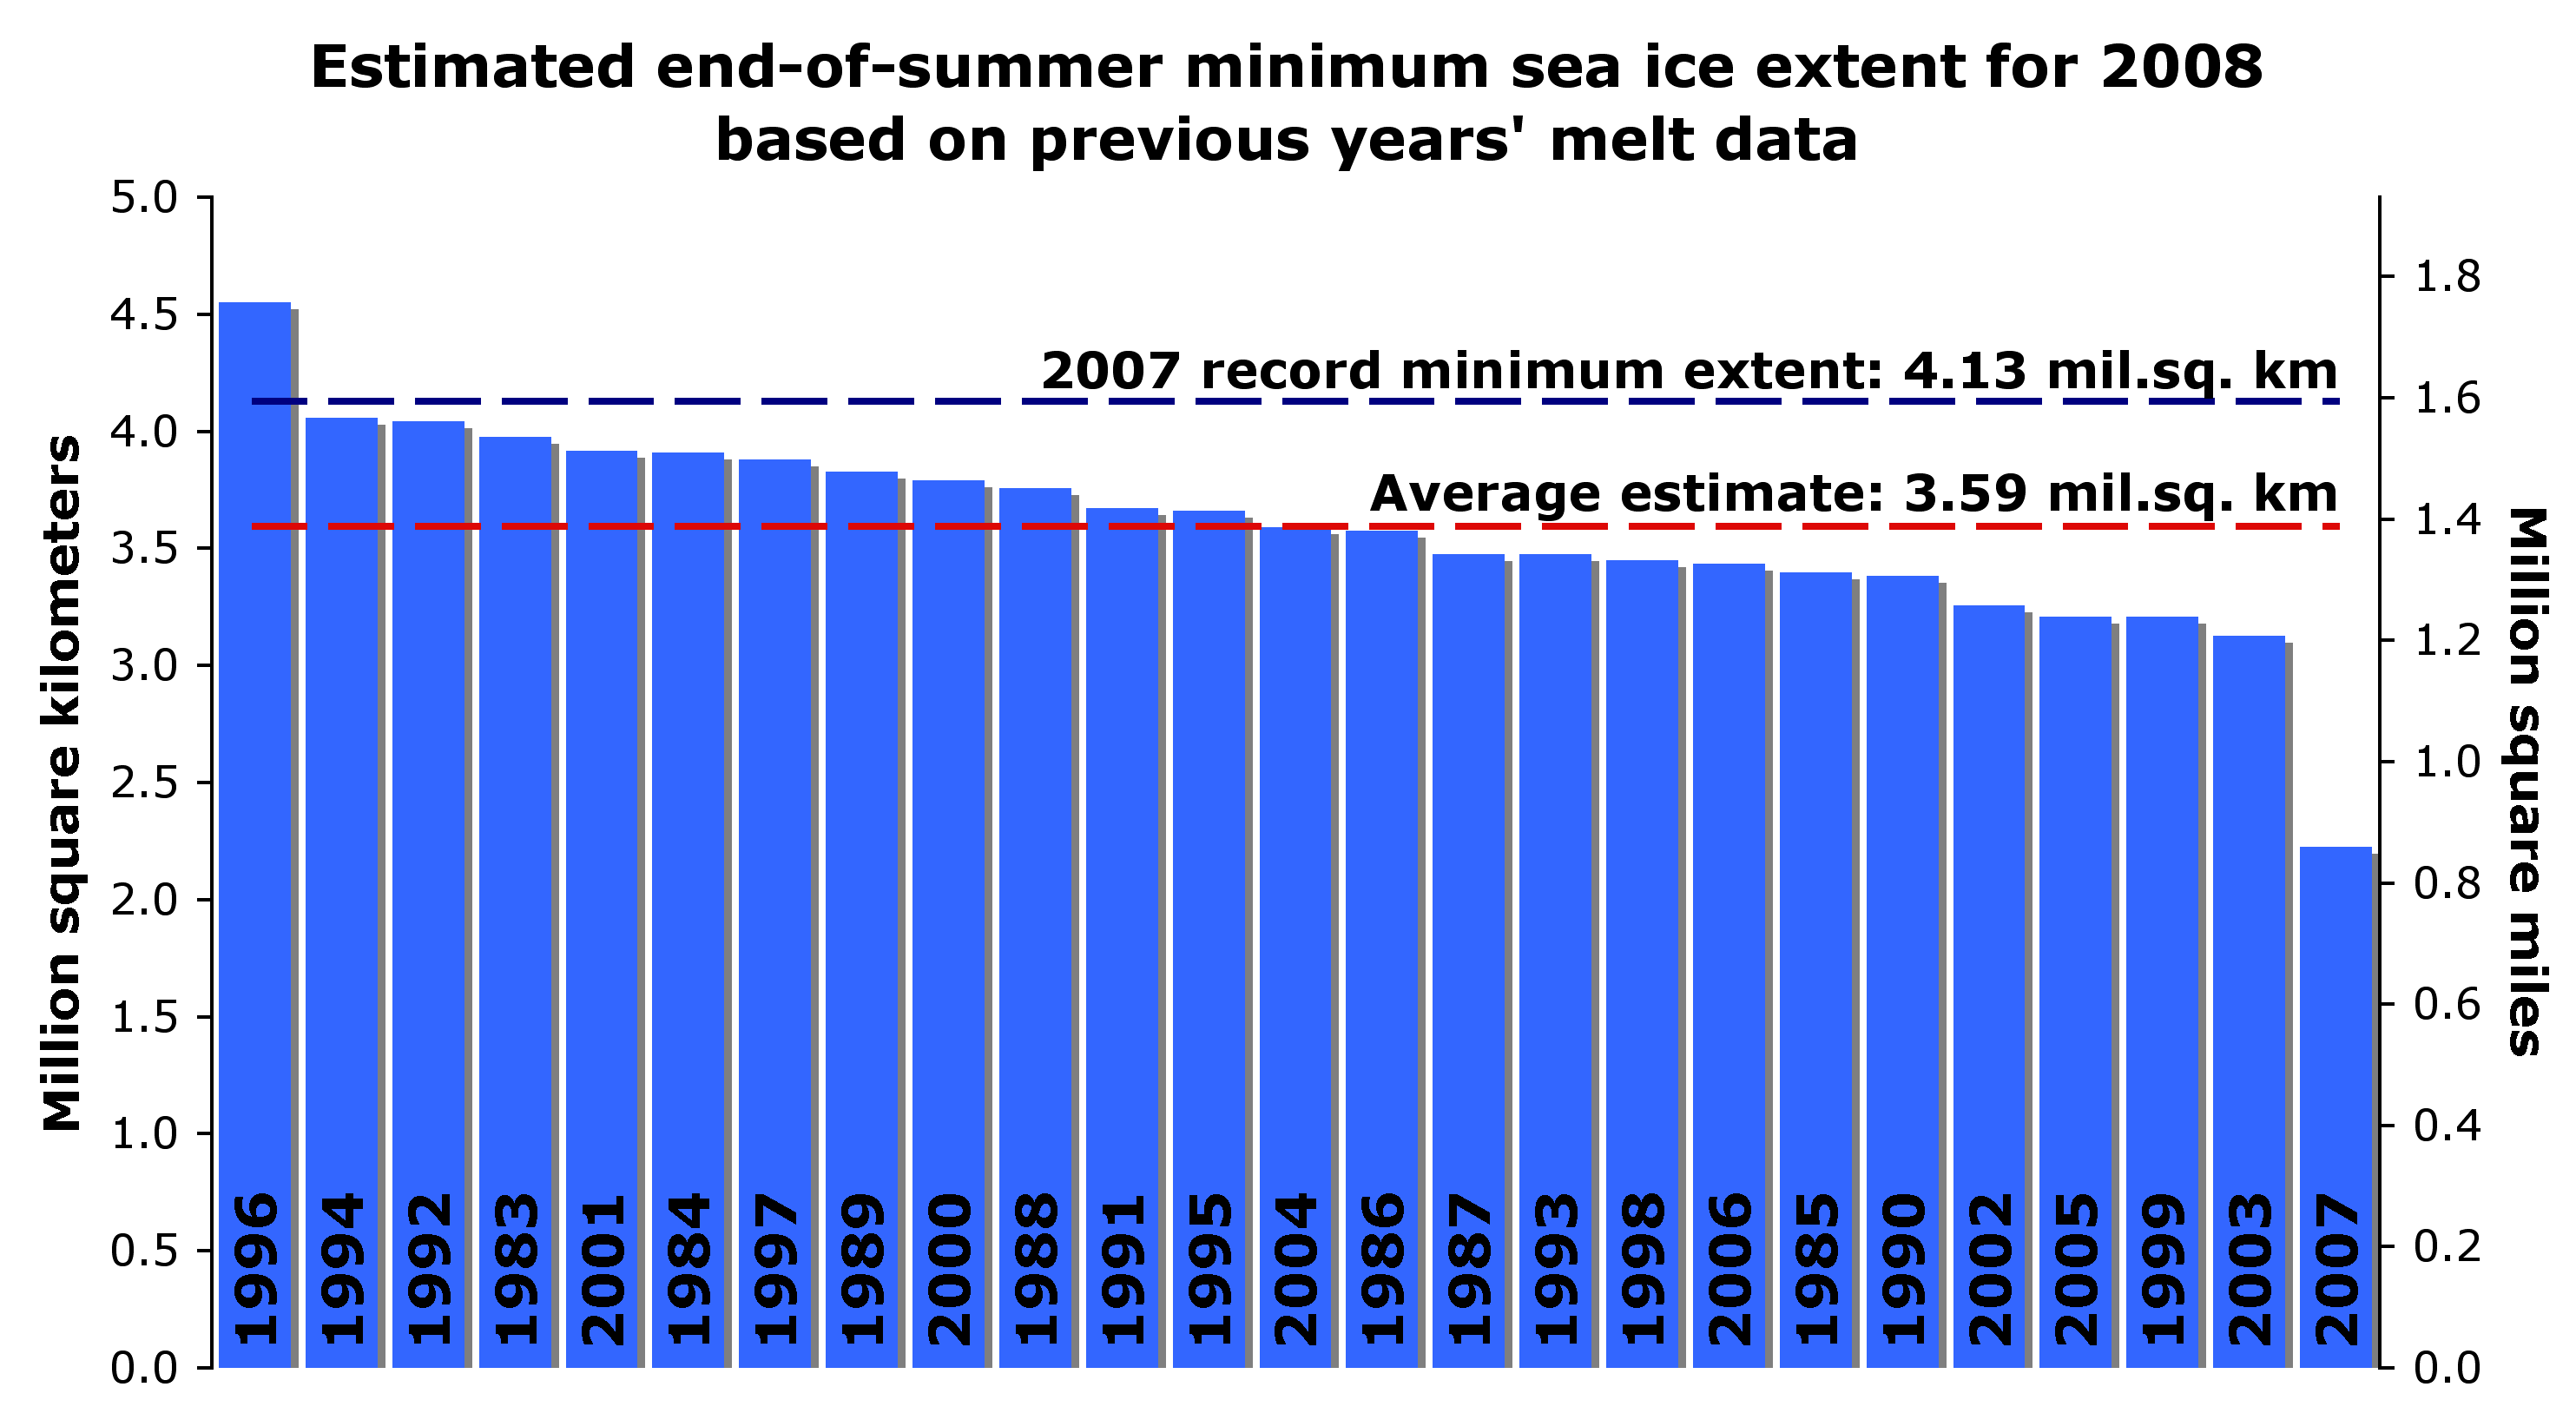
Figure 4. This bar plot shows estimates of sea ice extent at the 2008 September minimum based on known ice survival rates. The blue dotted line indicates the record-breaking minimum extent of 2007; the red dotted line shows the mean estimate based on all years between 1983 and 2007.
Estimating September extent based on past conditions
As discussed in our April analysis, the ice cover this spring shows an unusually large proportion of young, thin first-year ice; about 30% of first-year ice typically survives the summer melt season, while 75% of the older ice survives. For a simple estimate of the likelihood of breaking last year’s September record, we can apply survival rates from past years to this year’s April ice cover. This gives us 25 different estimates, one for each year that we have reliable ice-age data (see Figure 4). To avoid beating the September 2007 record low, more than 50% of this year’s first-year ice would have to survive; this has only happened once in the last 25 years, in 1996. If we apply the survival rates averaged over all years to current conditions, the end-of-summer extent would be 3.59 million square kilometers (1.39 million square miles). With survival rates similar to those in 2007, the minimum for the 2008 season would be only 2.22 million square kilometers (0.86 million square miles). By comparison the record low extent, set last September, was 4.28 million square kilometers (1.65 million square miles).
Forecasting September extent with climate predictors
Sheldon Drobot at the Center for Astrodynamics Research at the University of Colorado at Boulder and colleagues have developed a sophisticated forecasting technique. The forecast considers sea ice extent, ice age, summer and winter temperatures, cloudiness, the phase of the Atlantic Oscillation, and climate trends as predictors (see the papers cited below for details; visit the Arctic Oscillation Index). As reported last month, the Arctic Oscillation was in its positive phase through the winter season, associated with a wind pattern helping to flush thick ice out of the Arctic, leaving thinner ice. This is one of the factors helping to set the stage for pronounced ice losses this summer. Drobot predicts a 59% chance of a new record minimum this year; read the press release. Todd Arbetter of the U.S. National Ice Center tells us that his group is working to implement a version of Drobot’s analysis scheme for operational forecasting.
Ronald Lindsay of the University of Washington’s Applied Physics Laboratory and collaborators recently published results from their own ice prediction system, based on a retrospective analysis of the modeled state of the ice and ocean system (see the paper cited below for details). The model is successful in explaining around 75% of the year-to-year variations for the past few decades; for 2008, the model implies a very low, but not extreme, sea ice minimum. Lindsay cautions that sea ice conditions are now changing so rapidly that predictions based on relationships developed from the past 50 years of data may no longer apply.
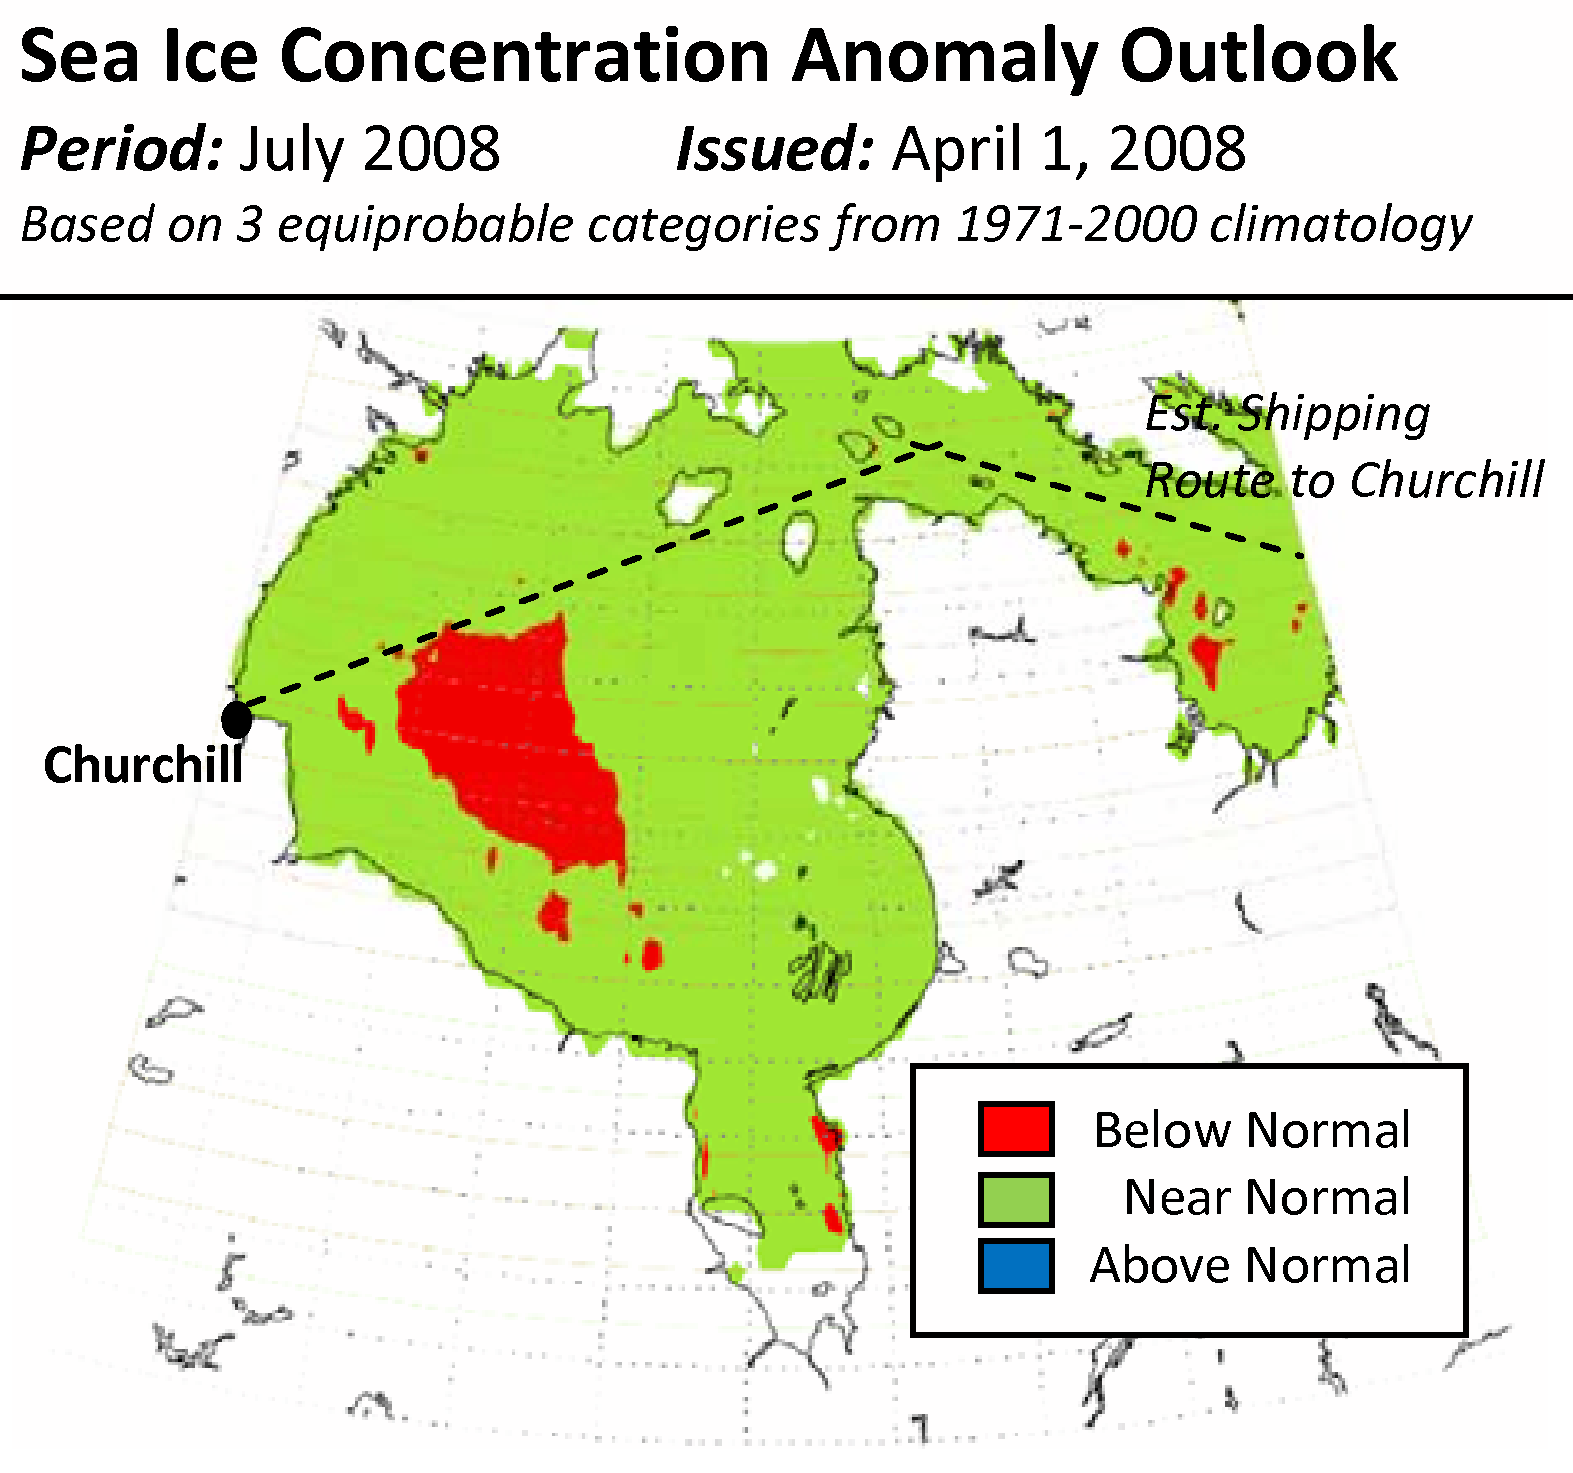
Regional shipping forecasts
Marine transportation in the Arctic is expected to increase as ice extent decreases. However, the viability of shipping through the Northwest Passage in the Canadian Arctic Islands, the Northern Sea Route along the Eurasian coast and in other areas such as Hudson Bay depend on local ice conditions, which can be highly variable. Adrienne Tivy at the University of Calgary and colleagues have investigated the variables that affect shipping in Hudson Bay. They found that the date on which shipping routes open across Hudson Bay to Churchill is most strongly correlated with sea surface temperatures between January and March and atmospheric pressure patterns in the East Atlantic in January. This year, Adrienne Tivy and colleagues predict that shipping to Churchill in a non-ice-strengthened vessel will be possible on July 16, 15 days earlier than the long-term mean of July 31. They estimate below-normal ice concentrations in the southwestern bay, but near-normal conditions elsewhere.
References
Drobot, S.D. 2007. Using remote sensing data to develop seasonal outlooks for Arctic regional sea-ice minimum extent. Remote Sensing of Environment, 111, 136-147,doi:10.1016/j.rse.2007.03.024.
Drobot, S.D., J.A. Maslanik, and C.F. Fowler. 2006. A long-range forecast of Arctic summer sea-ice minimum extent. Geophysical Research Letters, 33, L10501, doi:10.1029/2006GL026216.
Drobot, S.D., 2003: Long-range statistical forecasting of ice severity in the Beaufort/Chukchi Sea, Weather and Forecasting, 18:1161 – 1176.
Lindsay, R. W., J. Zhang, A. J. Schweiger, and M. A. Steele. 2008. Seasonal predictions of ice extent in the Arctic Ocean. Journal of Geophysical Research, 113, C02023, doi:10.1029/2007JC004259
Tivy, A., B. Alt, S. Howell, K. Wilson, and J. Yackel. 2007. Long-range prediction of the shipping season in Hudson Bay: A statistical approach. Weather and Forecasting, 22, 1063–1075, doi:10.1175/WAF1038.1
Zhang, J., M. Steele, R. Lindsay, A. Schweiger, and J. Morison. 2008. Ensemble 1-year predictions of Arctic sea ice for the spring and summer of 2008, Geophysical Research Letters, 35, L08502, doi:10.1029/2008GL033244.

