Ice extent low at start of melt season; ice age increases over last year

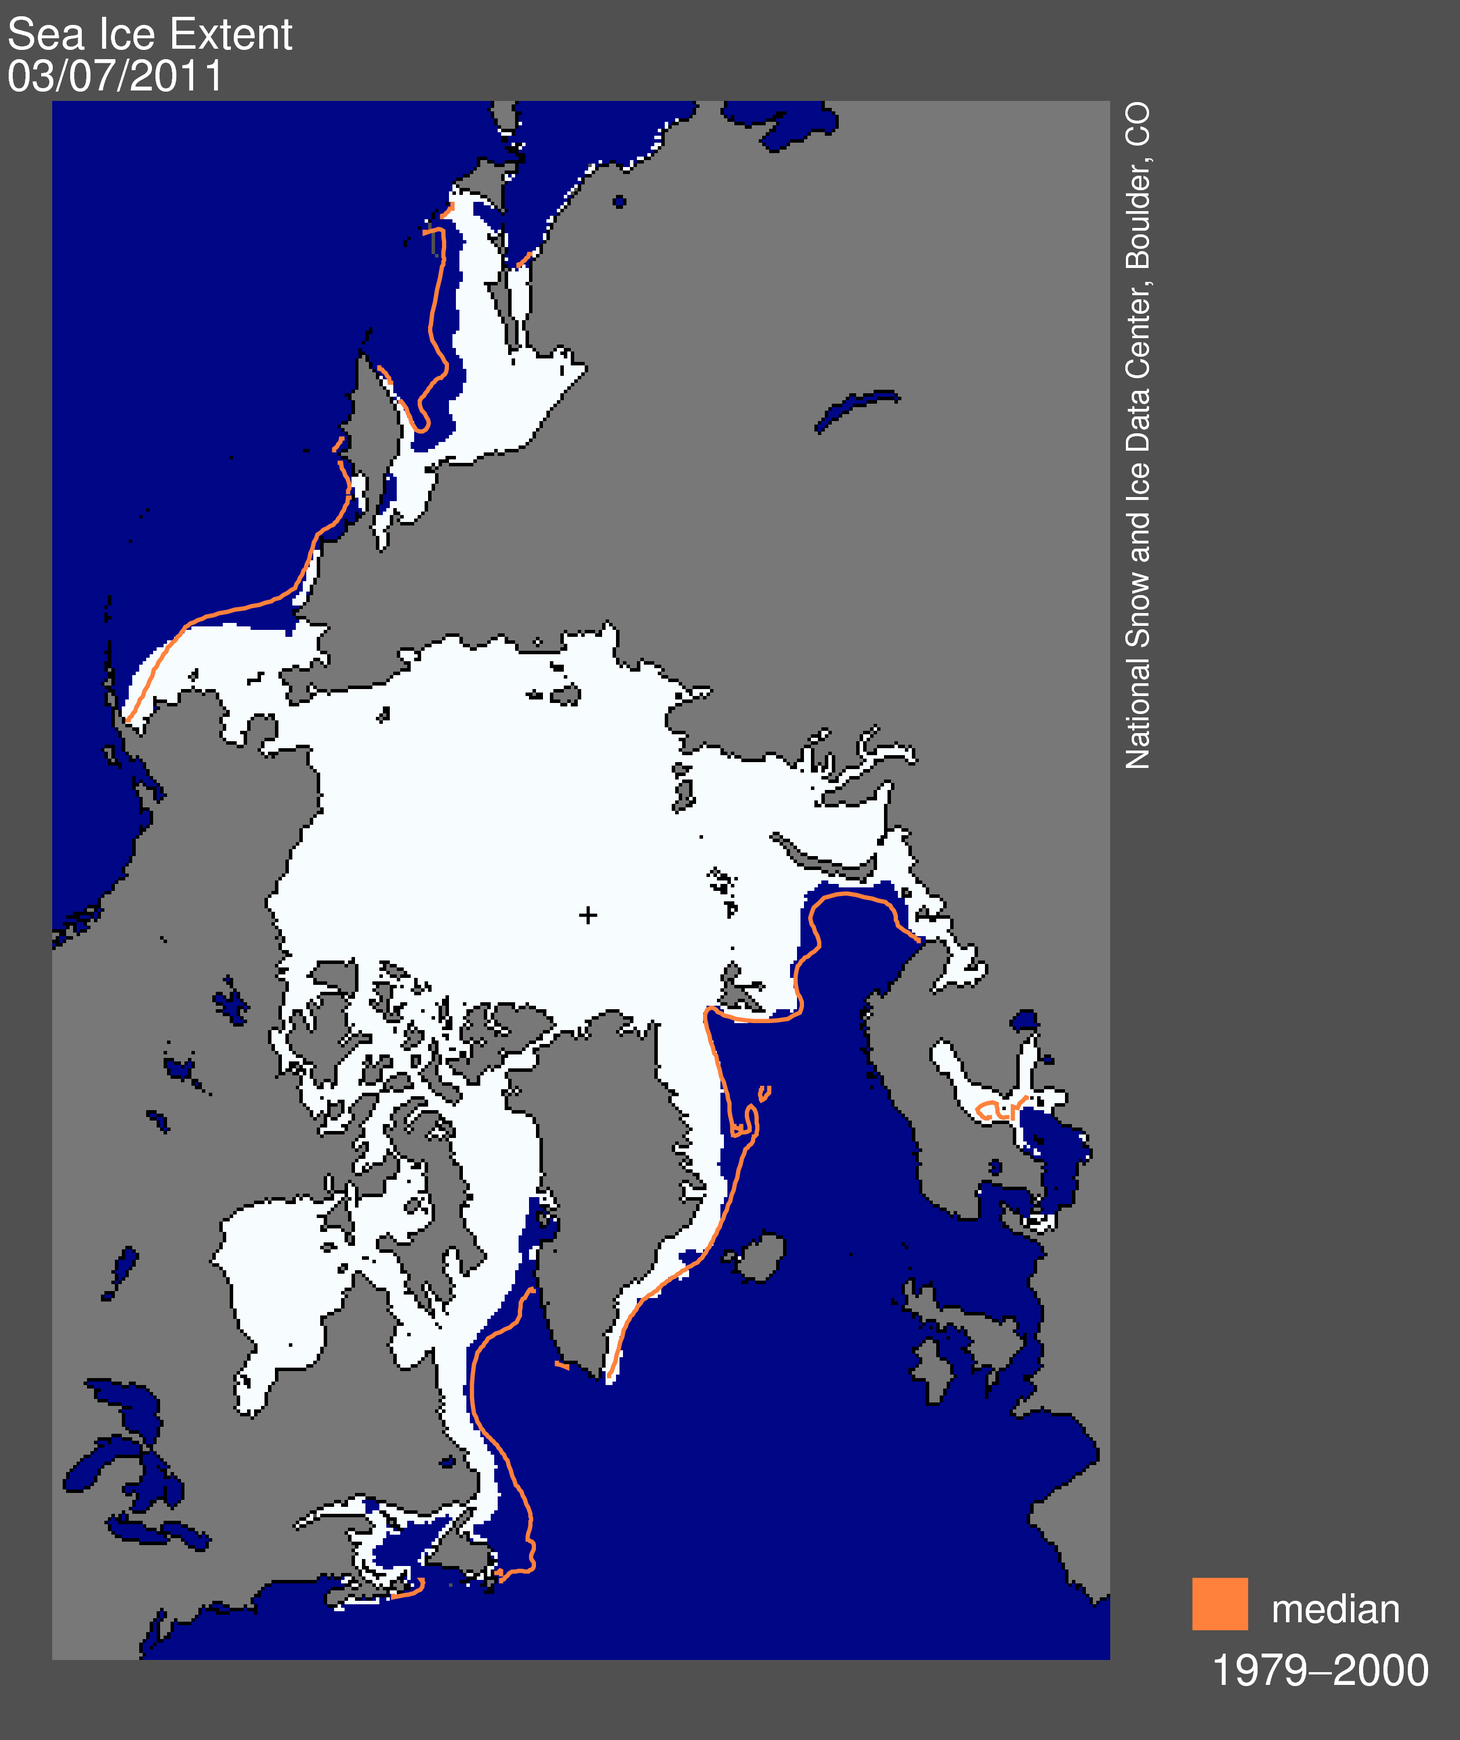
Arctic sea ice extent for the month of March 2011 was the second lowest in the satellite record. Sea ice reached its maximum extent on March 7; extent on this date tied for the lowest winter maximum extent in the satellite record. Air temperatures over most of the Arctic Ocean were above normal. New data on ice age shows that the amount of older, thicker ice has increased slightly over last year.

map from space showing sea ice extent, continents
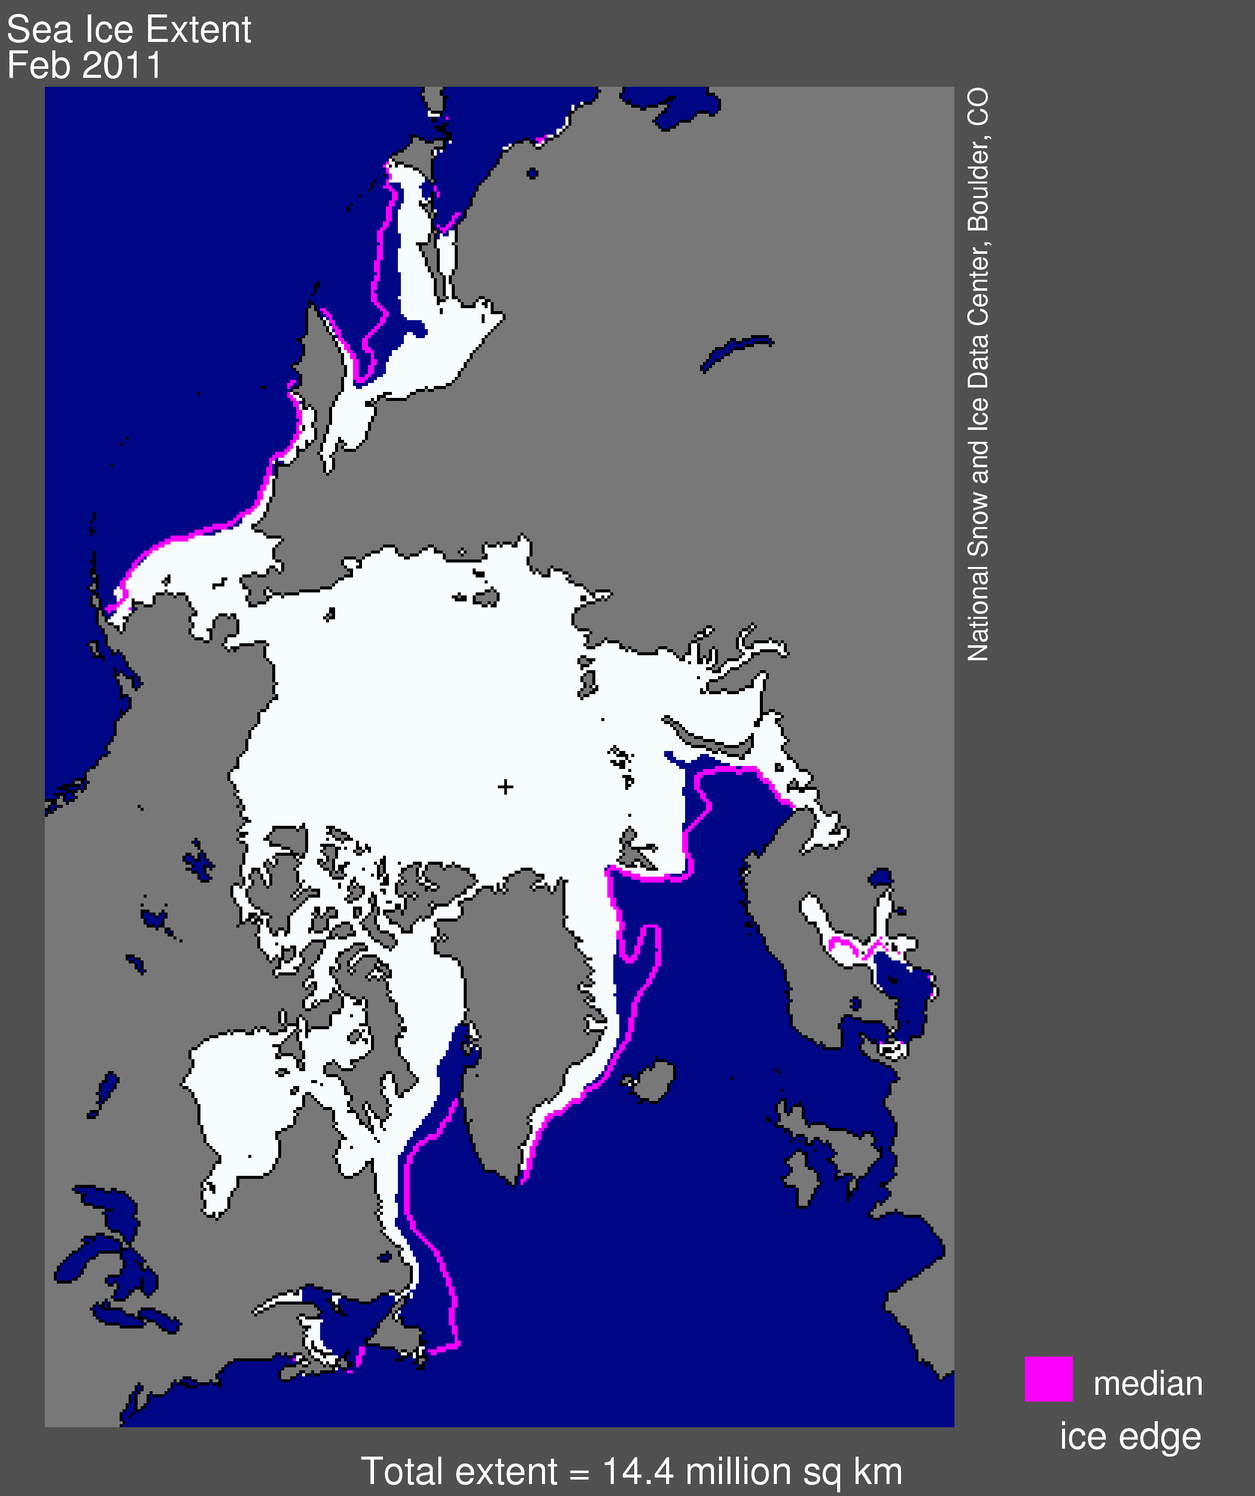
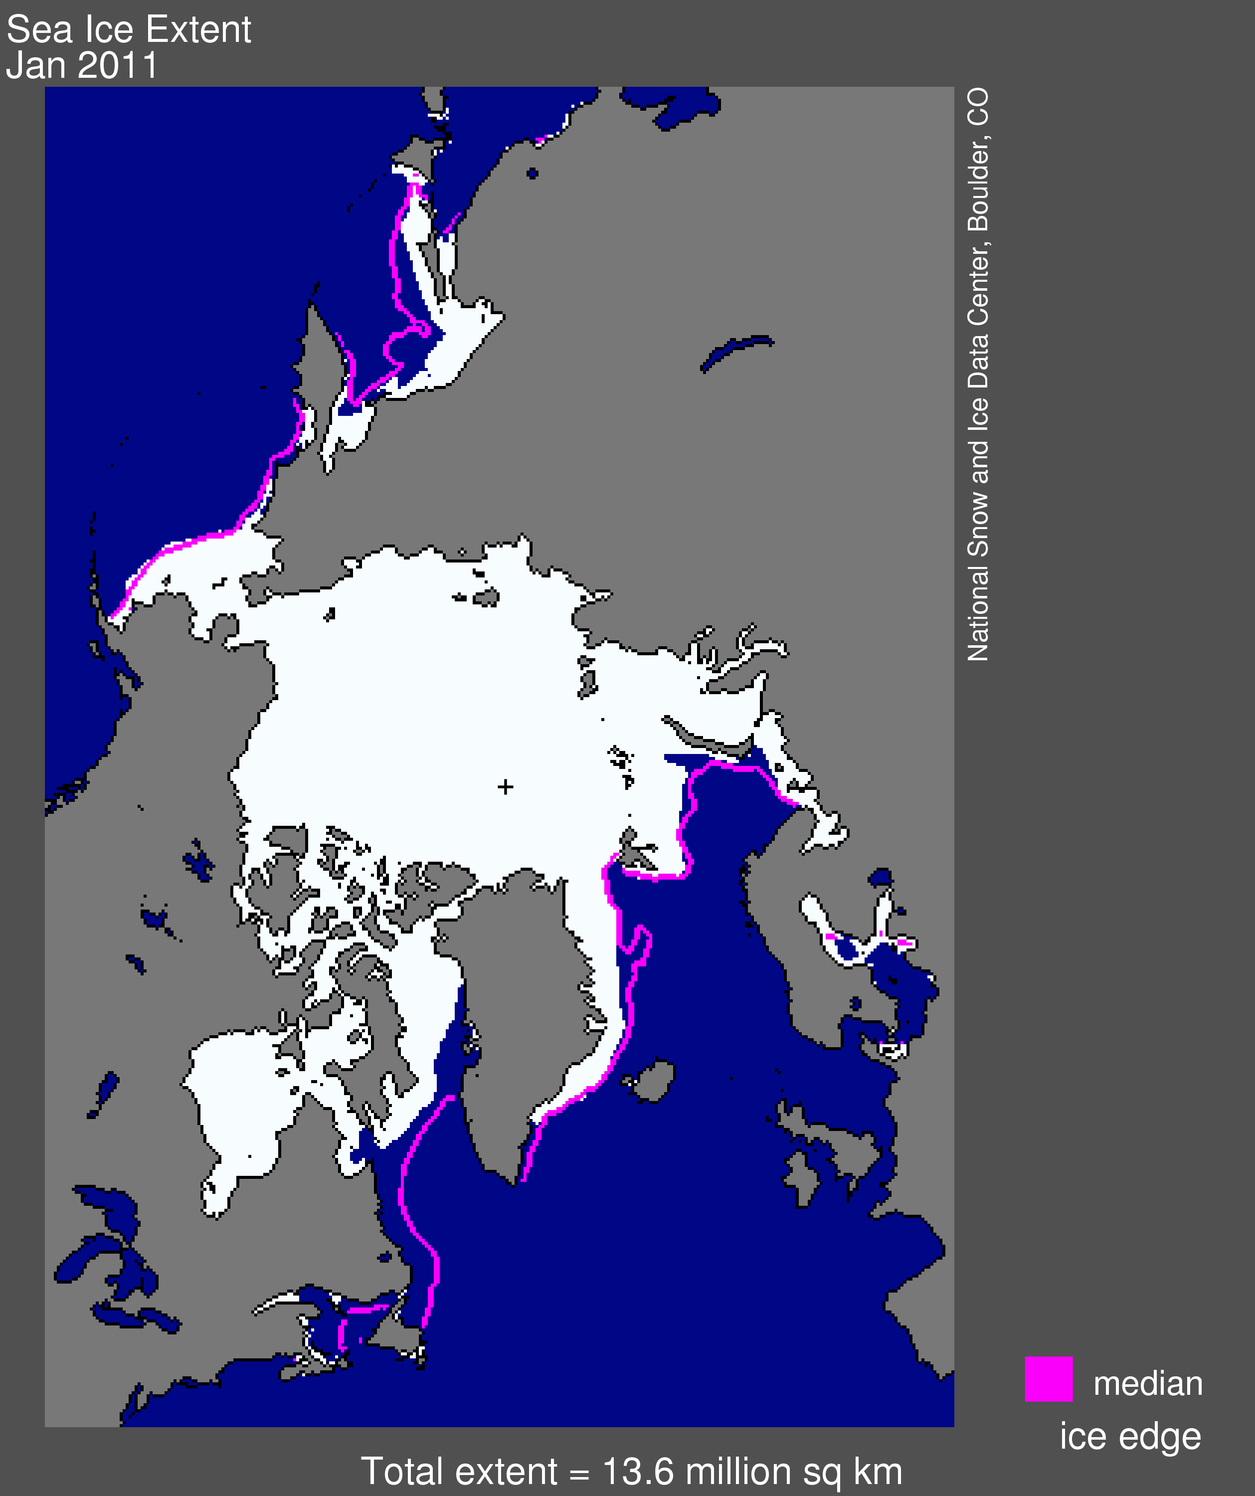
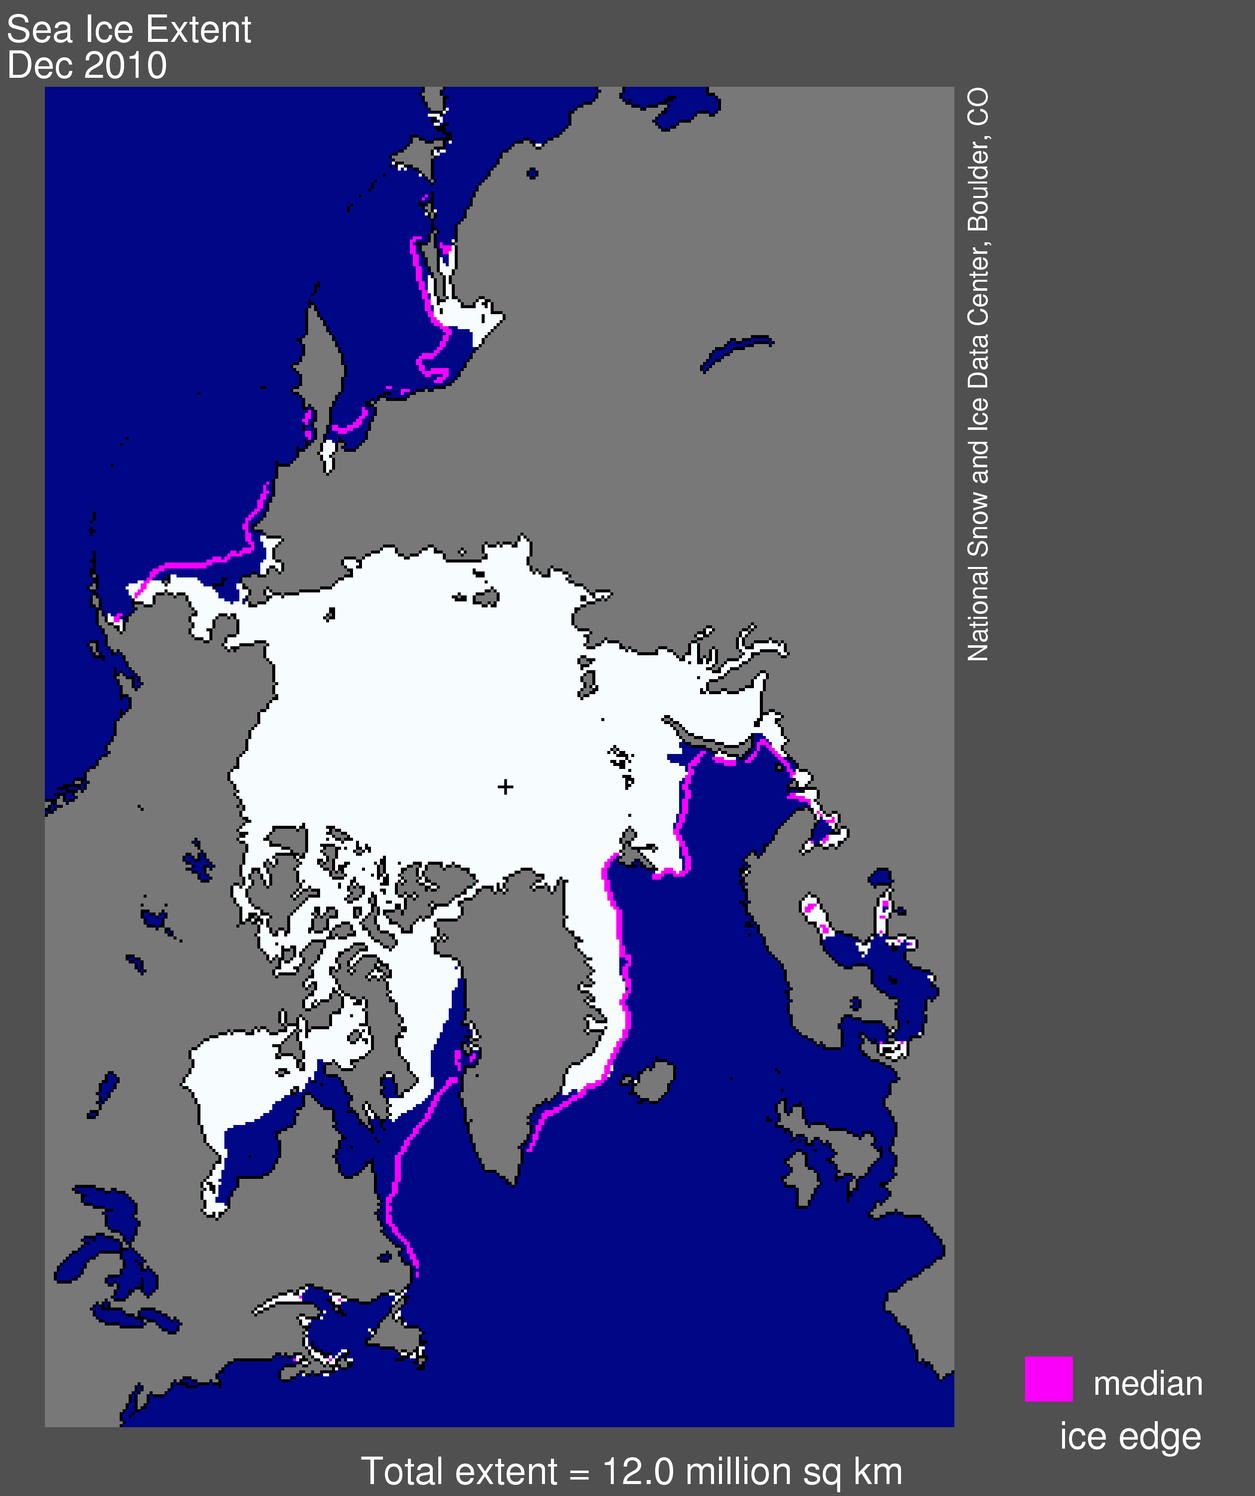
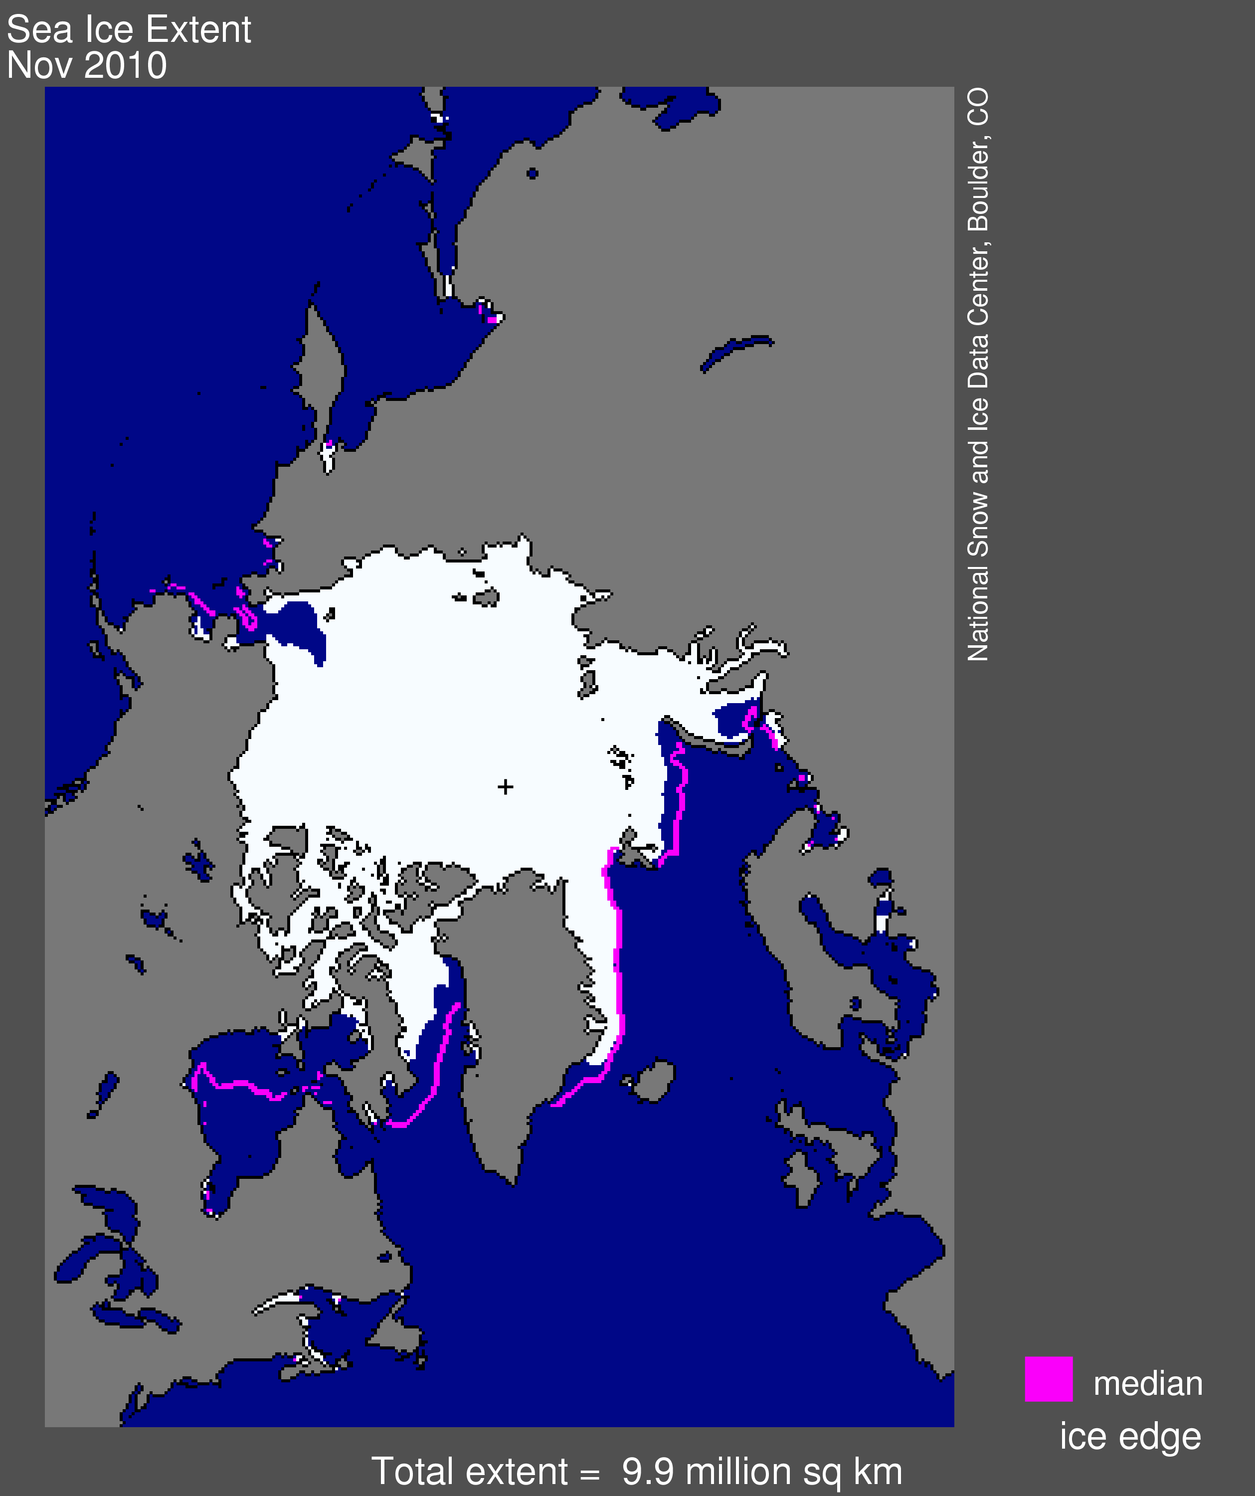
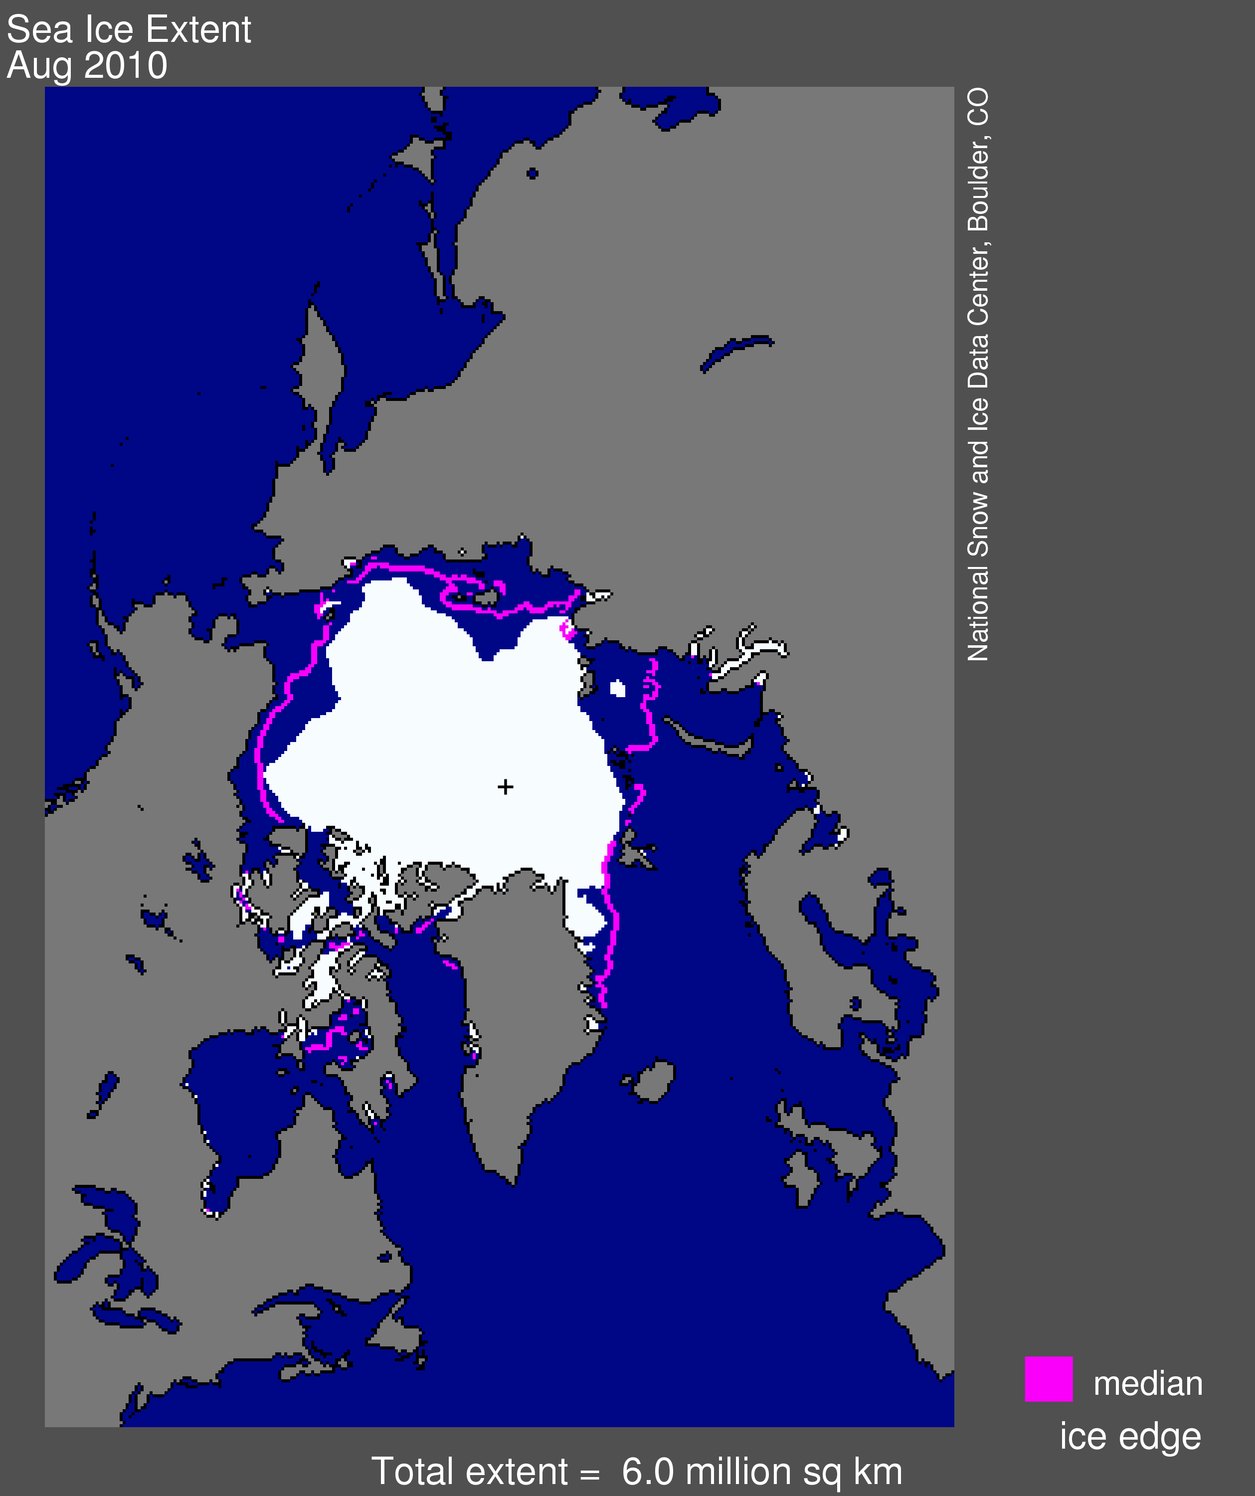
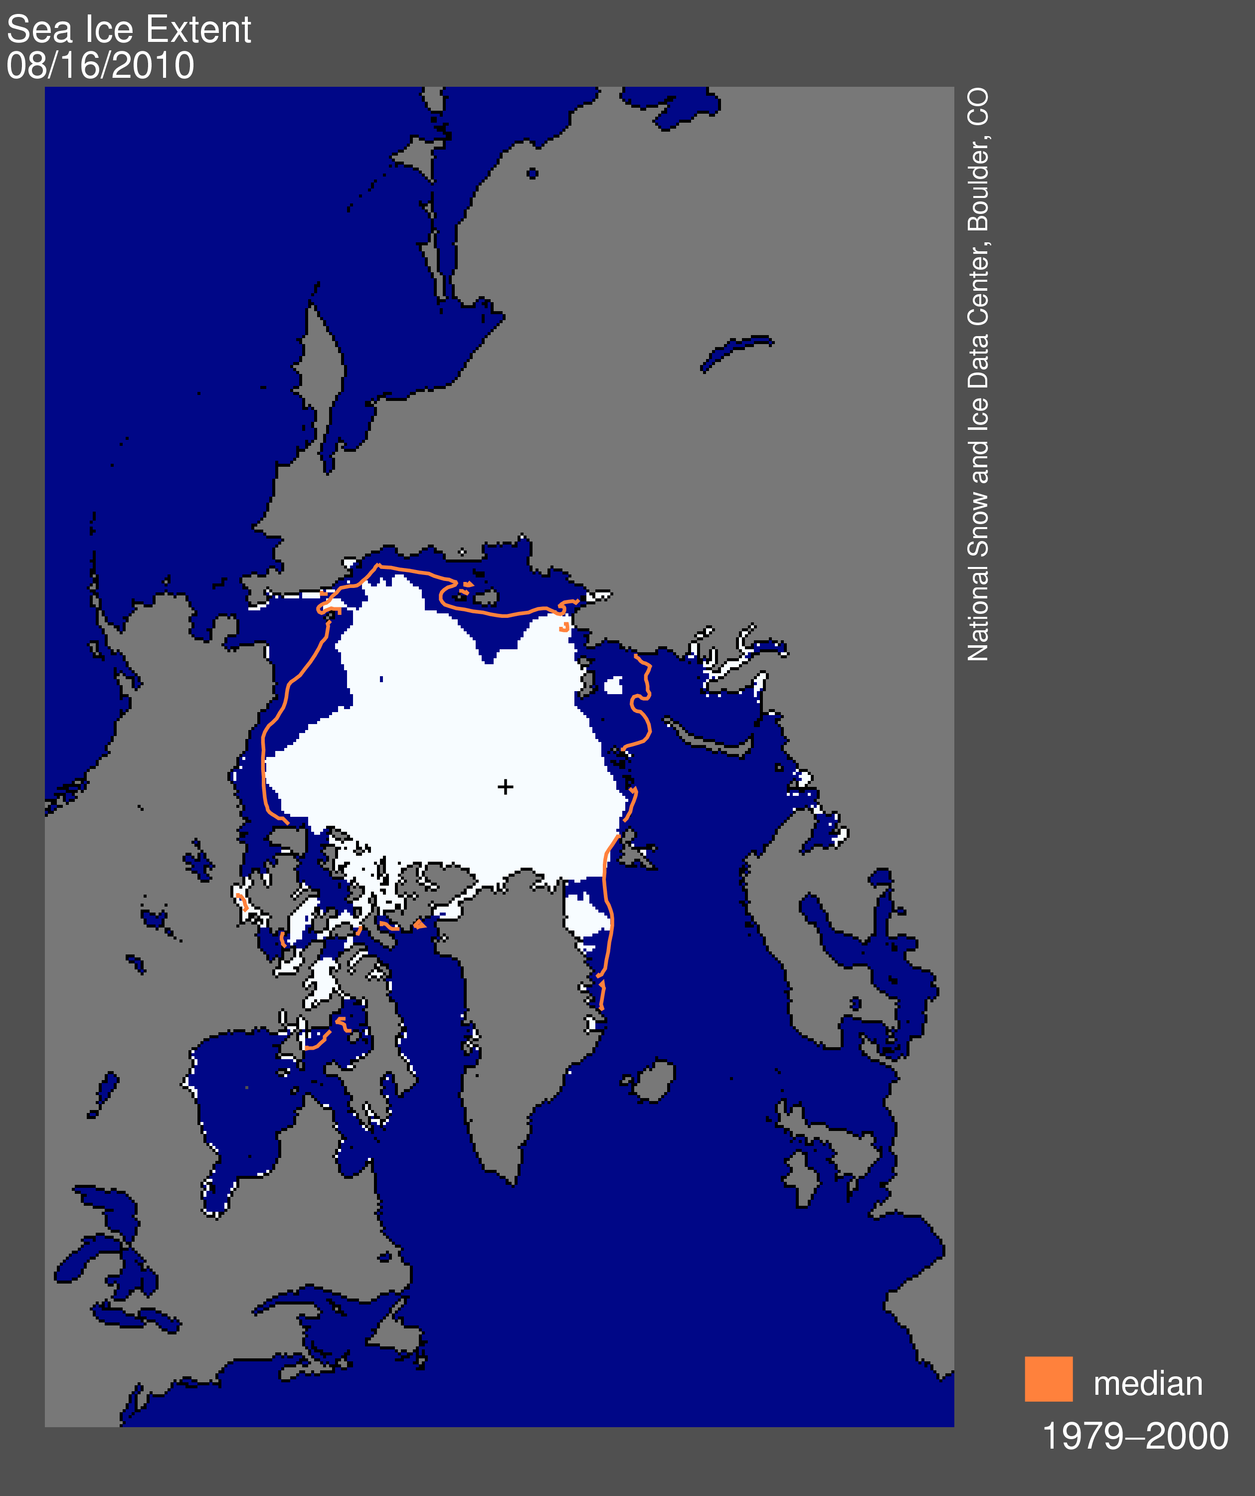
Figure 1. Arctic sea ice extent for March 2011 was 14.56 million square kilometers (5.62 million square miles). The magenta line shows the 1979 to 2000 median extent for that month. The black cross indicates the geographic North Pole. Sea Ice Index data. About the data. —Credit: National Snow and Ice Data Center
High-resolution image


Overview of conditions

Arctic sea ice extent averaged over the month of March 2011 was 14.56 million square kilometers (5.62 million square miles). This is the second-lowest March extent on record, after 2006.

In March, ice extent remained below normal in both the Atlantic and Pacific sectors of the Arctic, particularly in the Labrador Sea and the Gulf of St. Lawrence.

graph with months on x axis and extent on y axis 
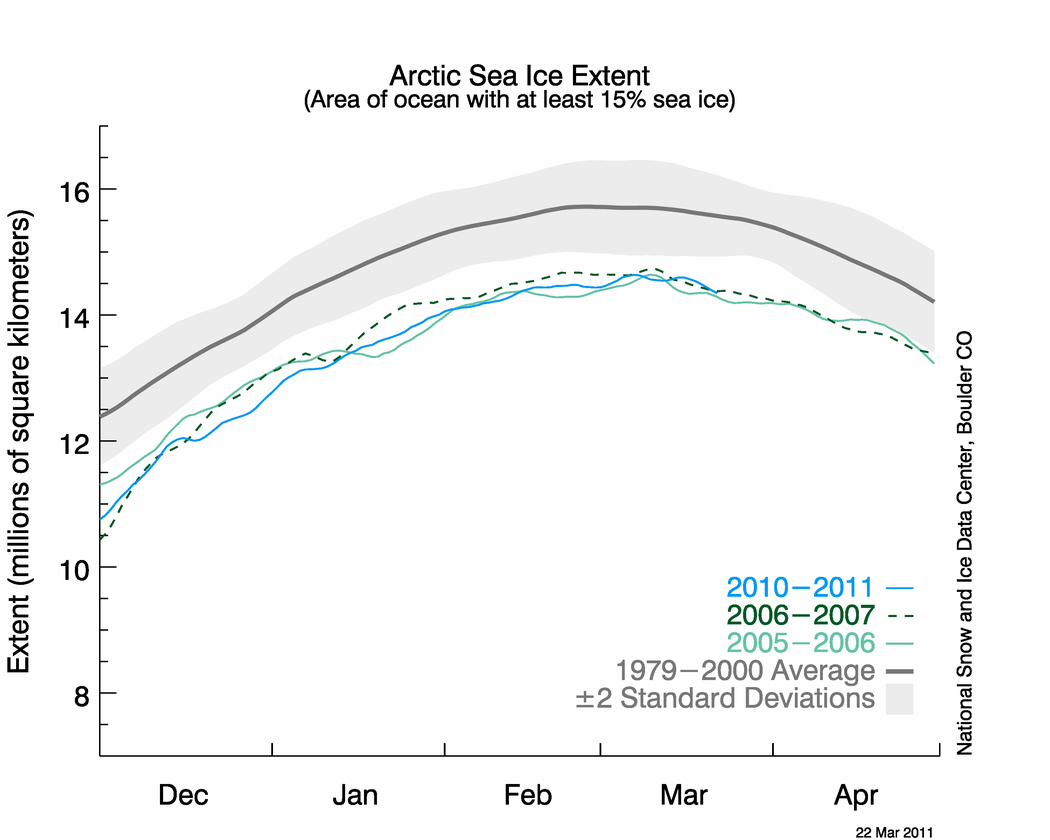
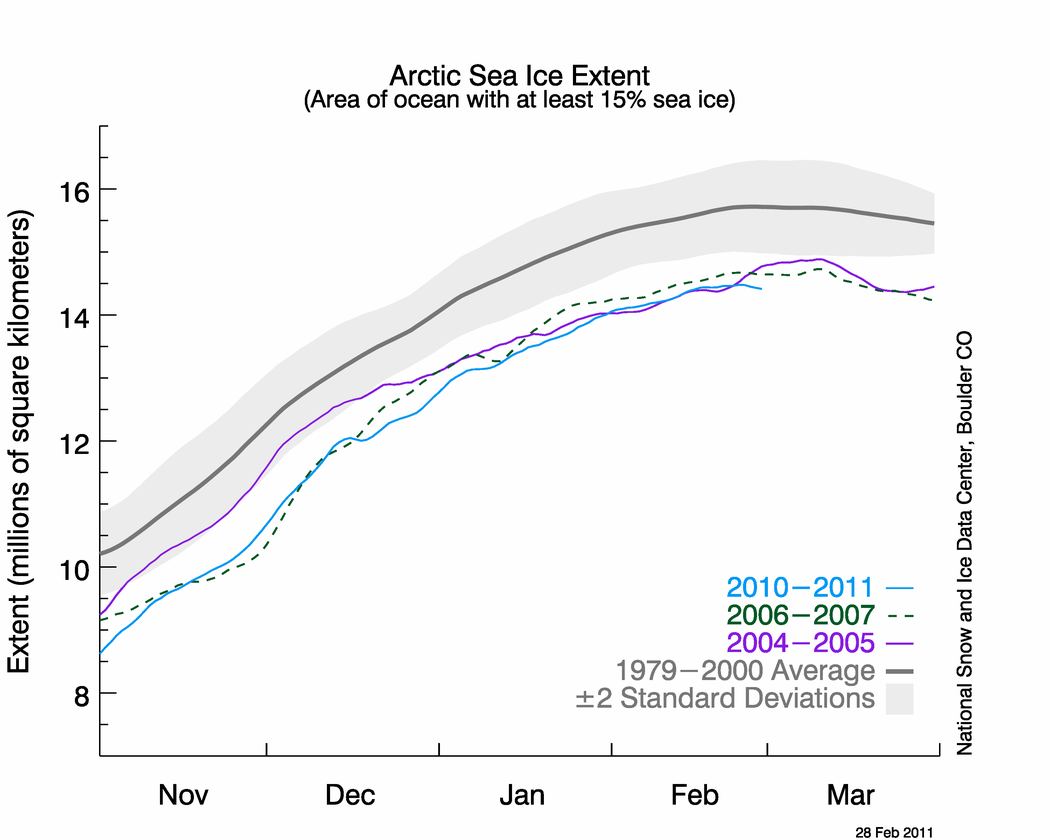
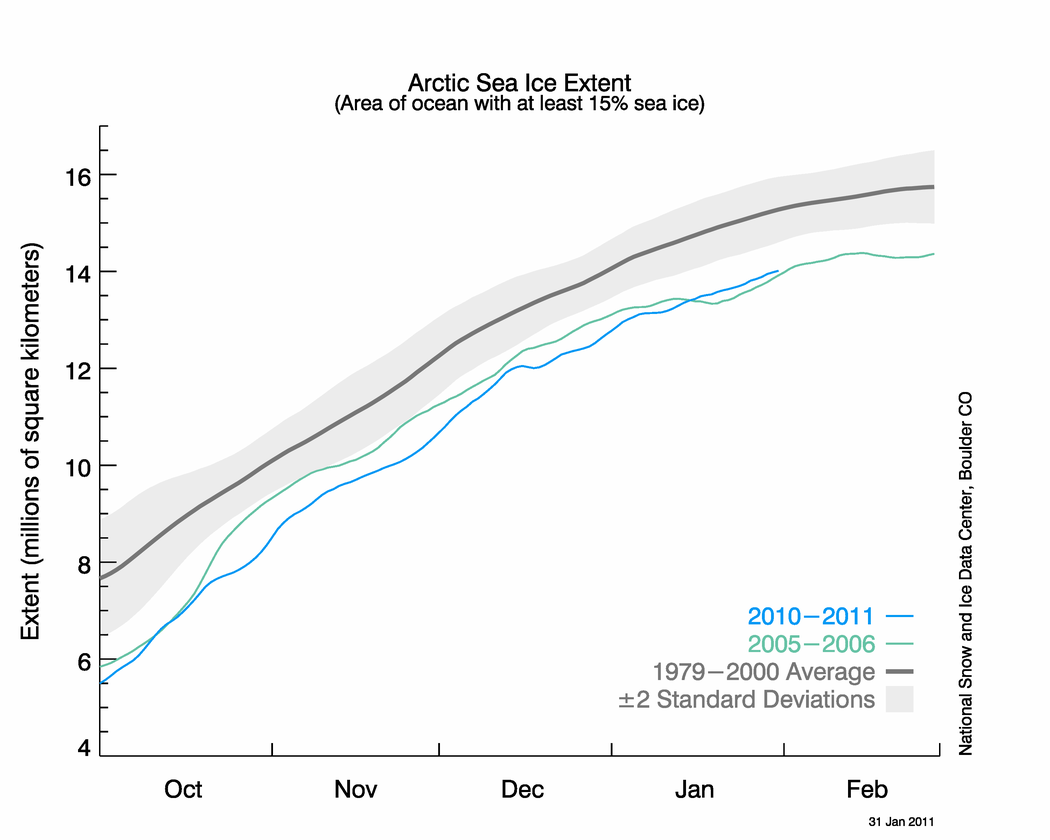
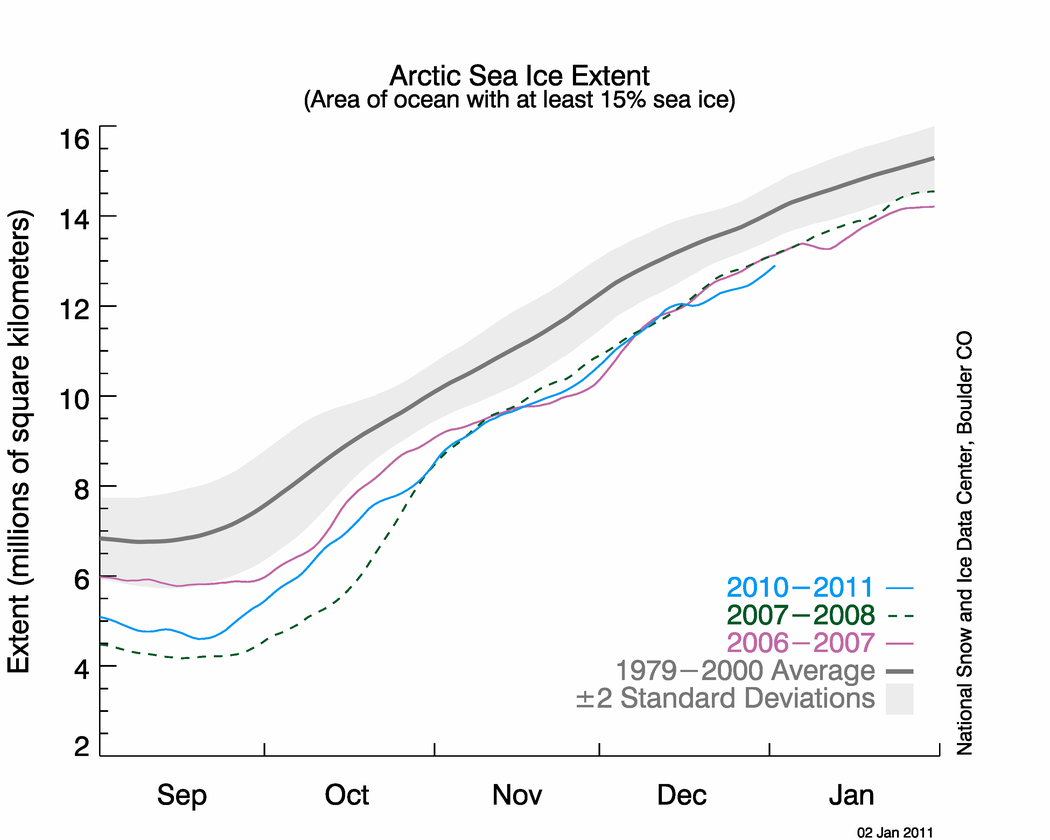
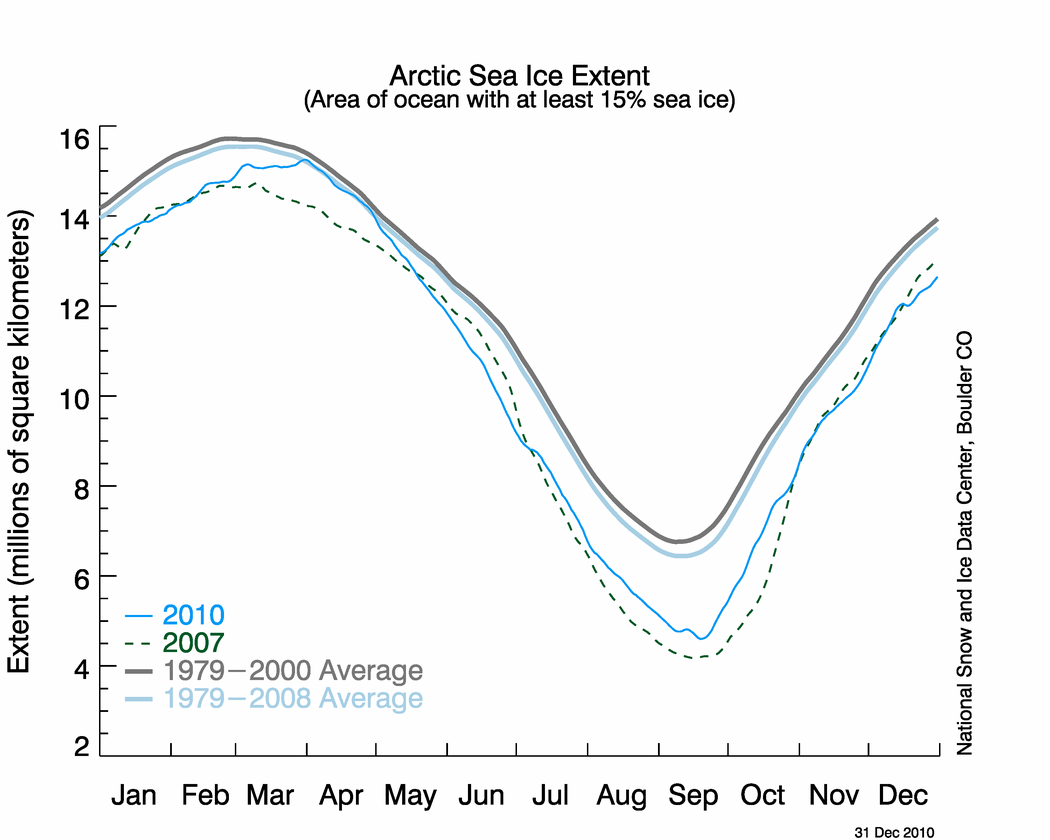
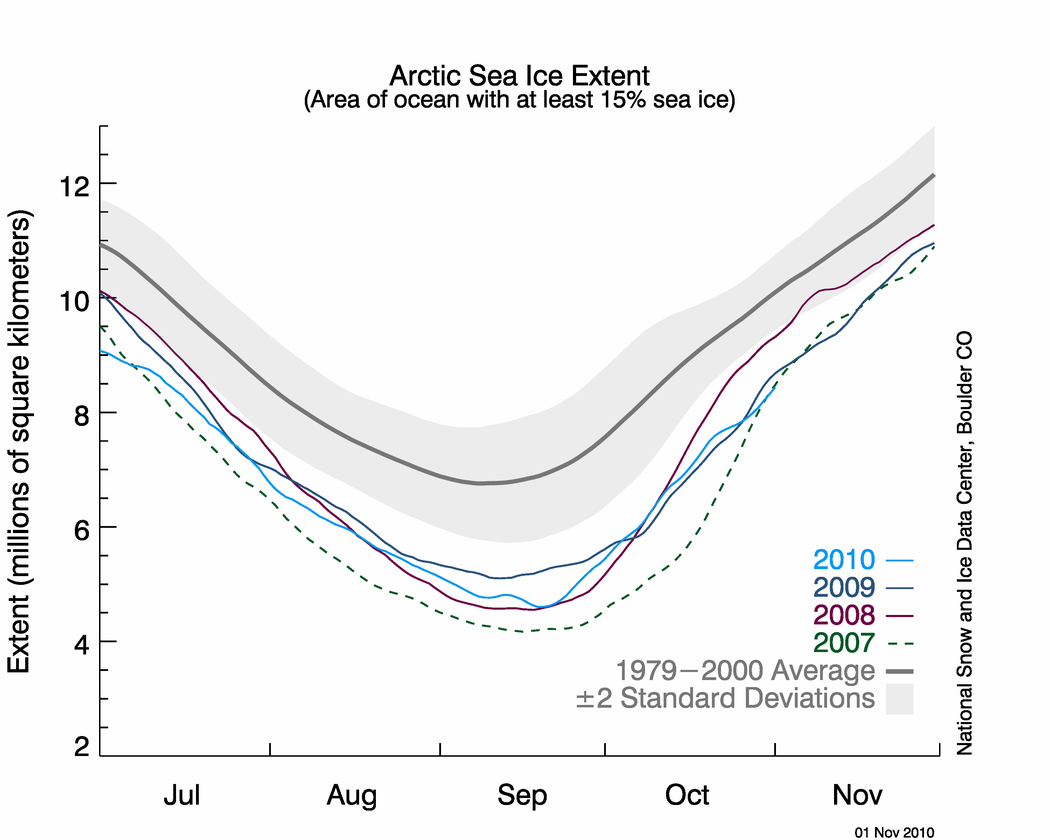
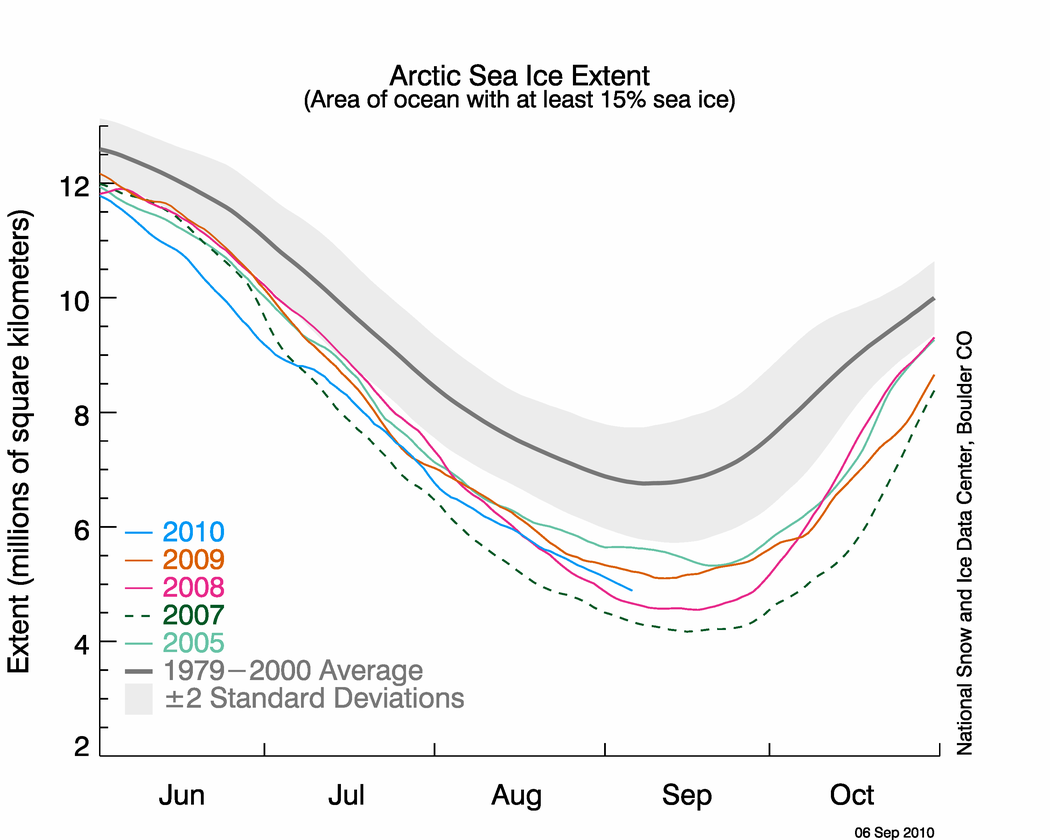
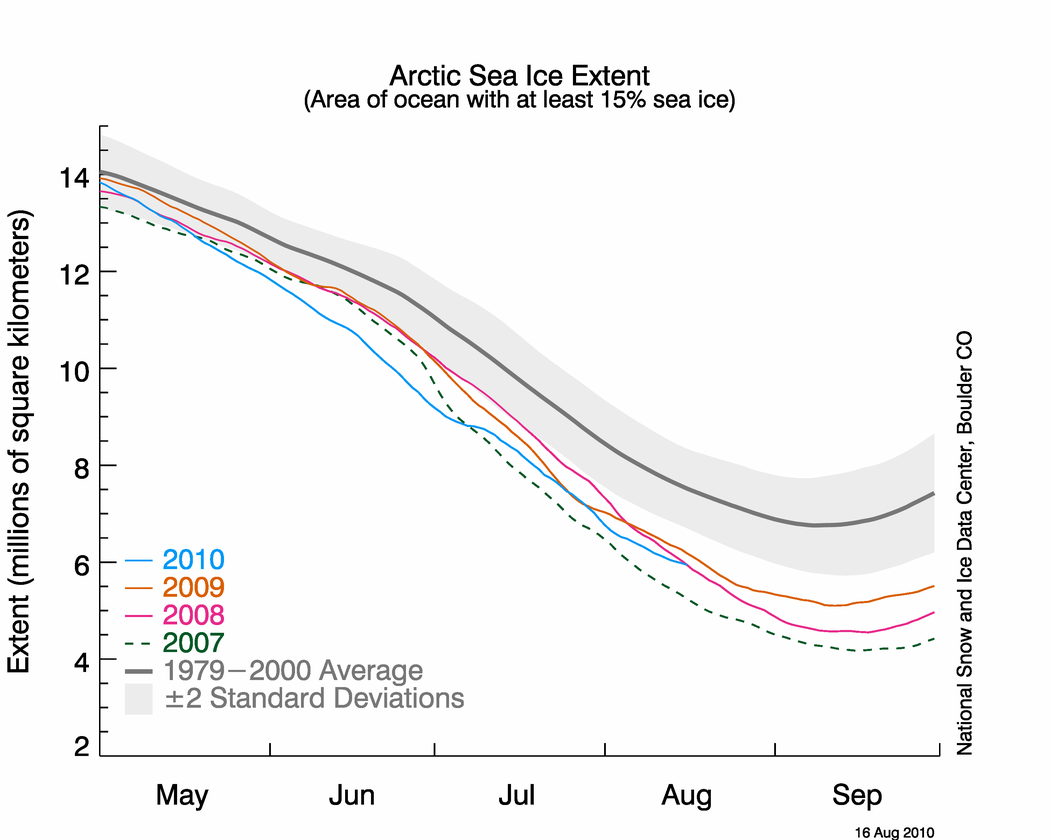
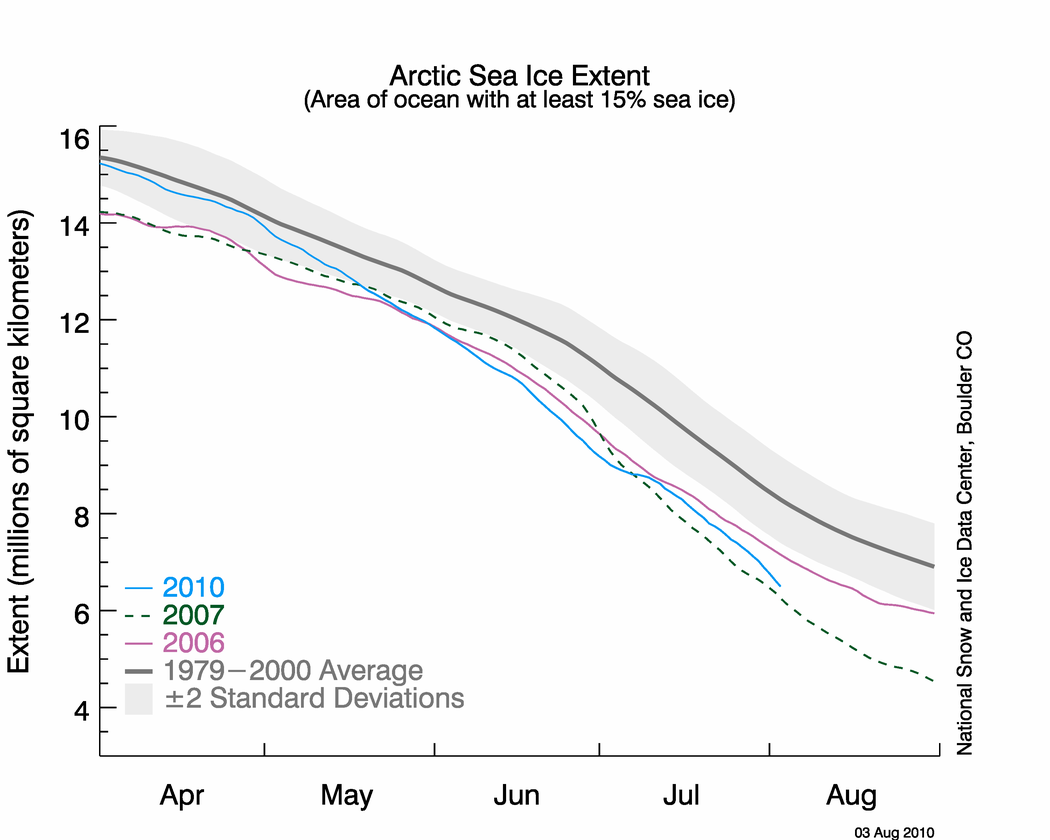
Figure 2. The graph above shows daily Arctic sea ice extent as of April 4, 2011, along with daily ice extents for previous low-ice-extent years in the month of March. Light blue indicates 2011, dashed green shows 2007, light green shows 2006 (the record low for the month), and dark gray shows the 1979 to 2000 average. The gray area around the average line shows the two standard deviation range of the data. Sea Ice Index data.—Credit: National Snow and Ice Data Center
High-resolution image


Conditions in context

Ice extent showed little change through the month of March, as is typical this time of year. The ice reached its winter maximum extent on March 7, and over the next few weeks, ice extent declined only slightly. New ice was still growing in some areas, but it was melting in others. Overall, the ice changes in these regions canceled each other out.

Late in the month, extent again increased, though not above the previously reported level of March 7. This late increase is due mainly to increases of extent in the Kara, Barents, and Greenland Seas. The Greenland Sea increase is likely due primarily to ice that was exported from the Arctic Ocean to the Greenland Sea by winds and ocean currents, though some ice growth is also apparent. The increase in the Kara and Barents Seas appears primarily due to ice growth resulting from unusually cold weather in the region.

monthly graph
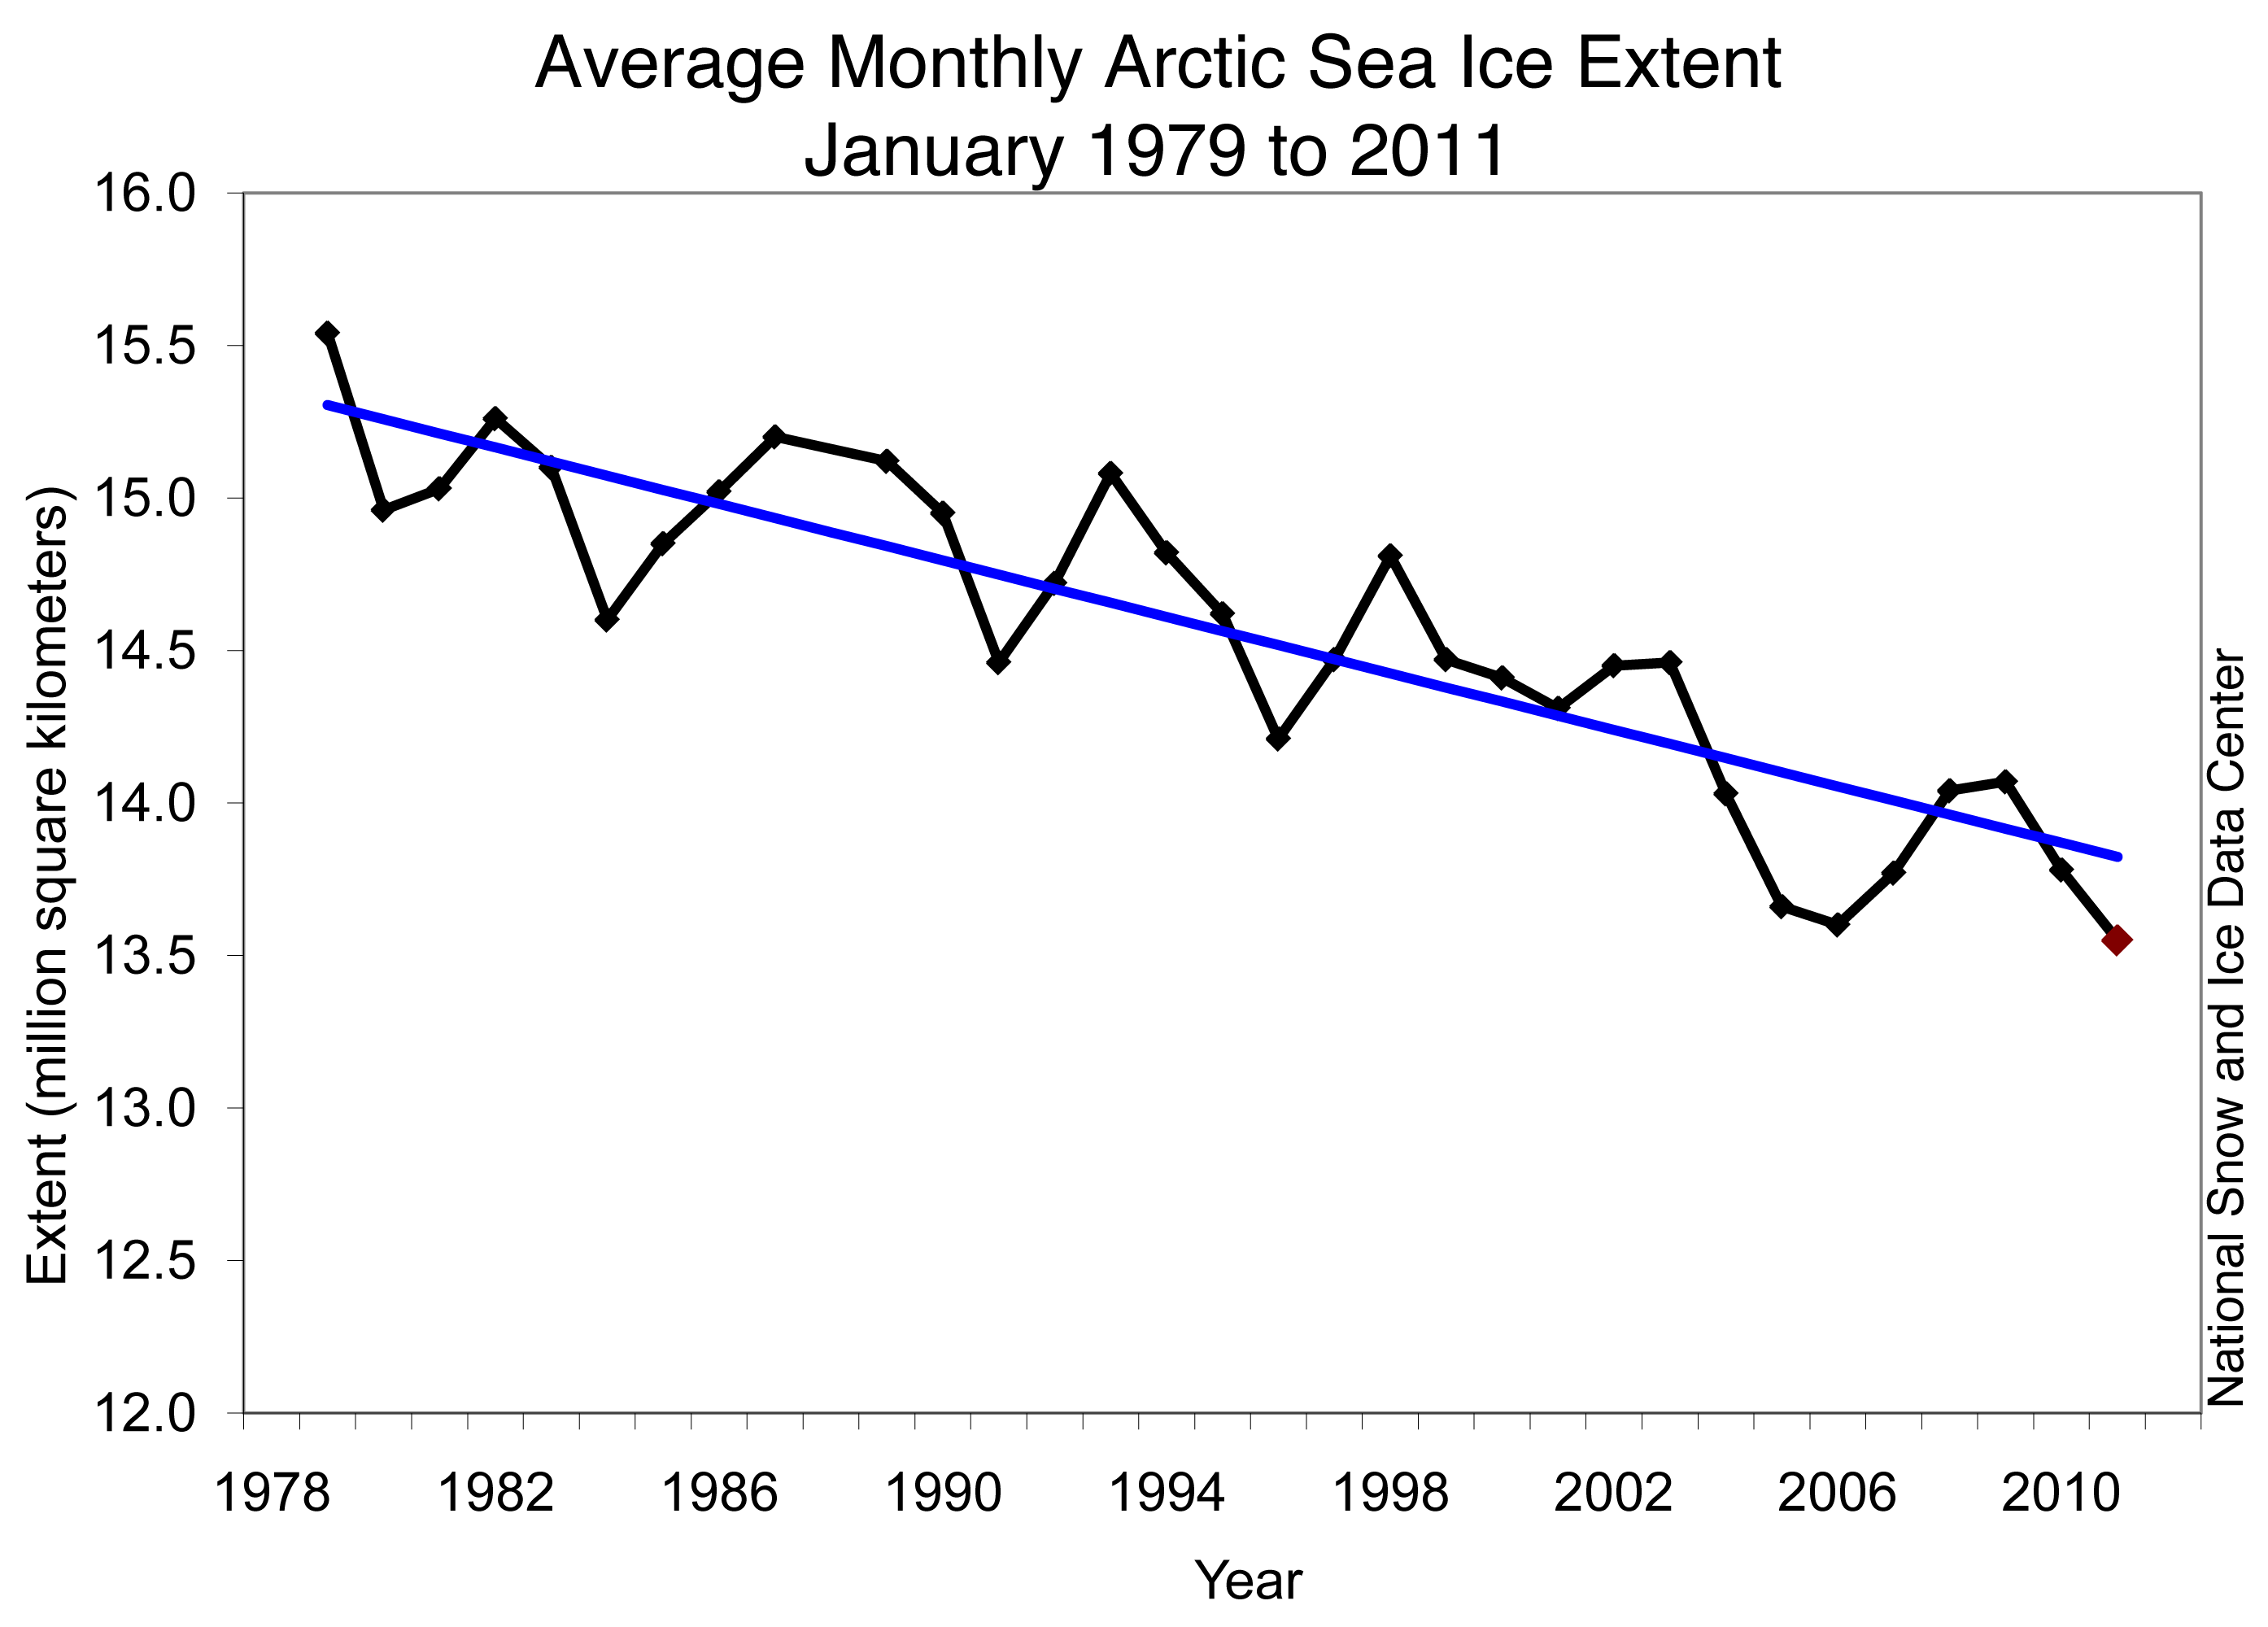
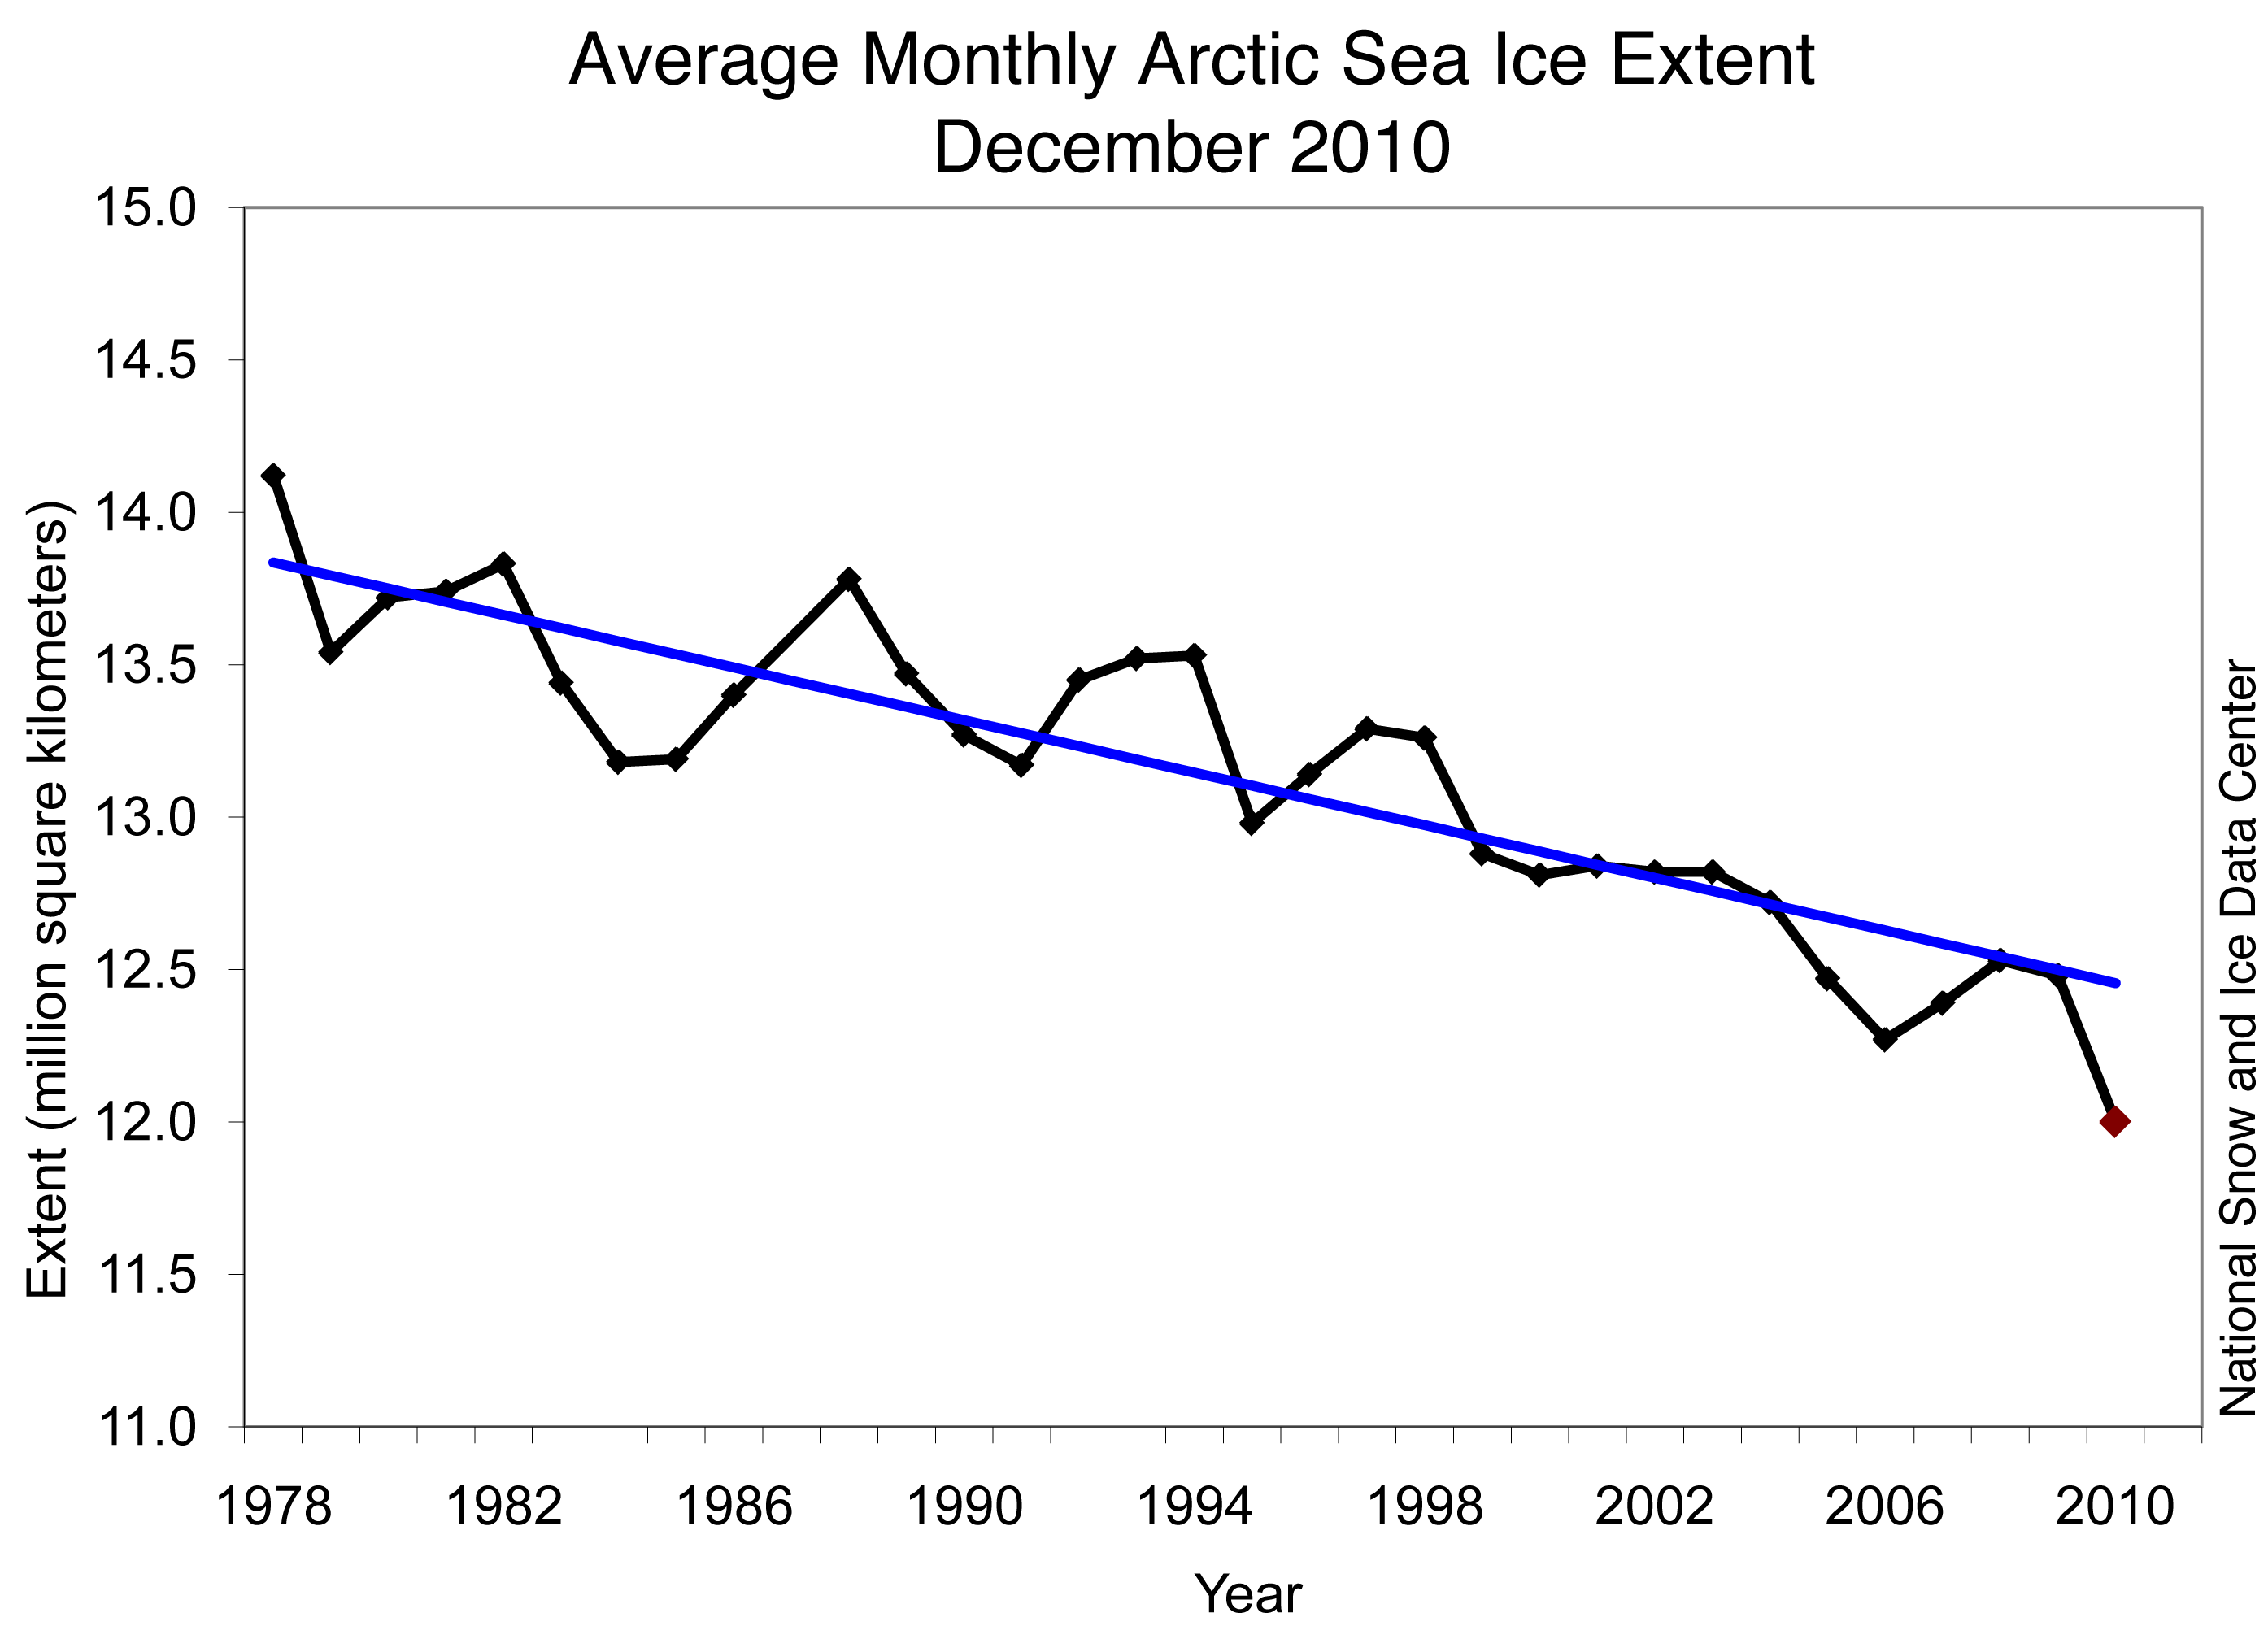
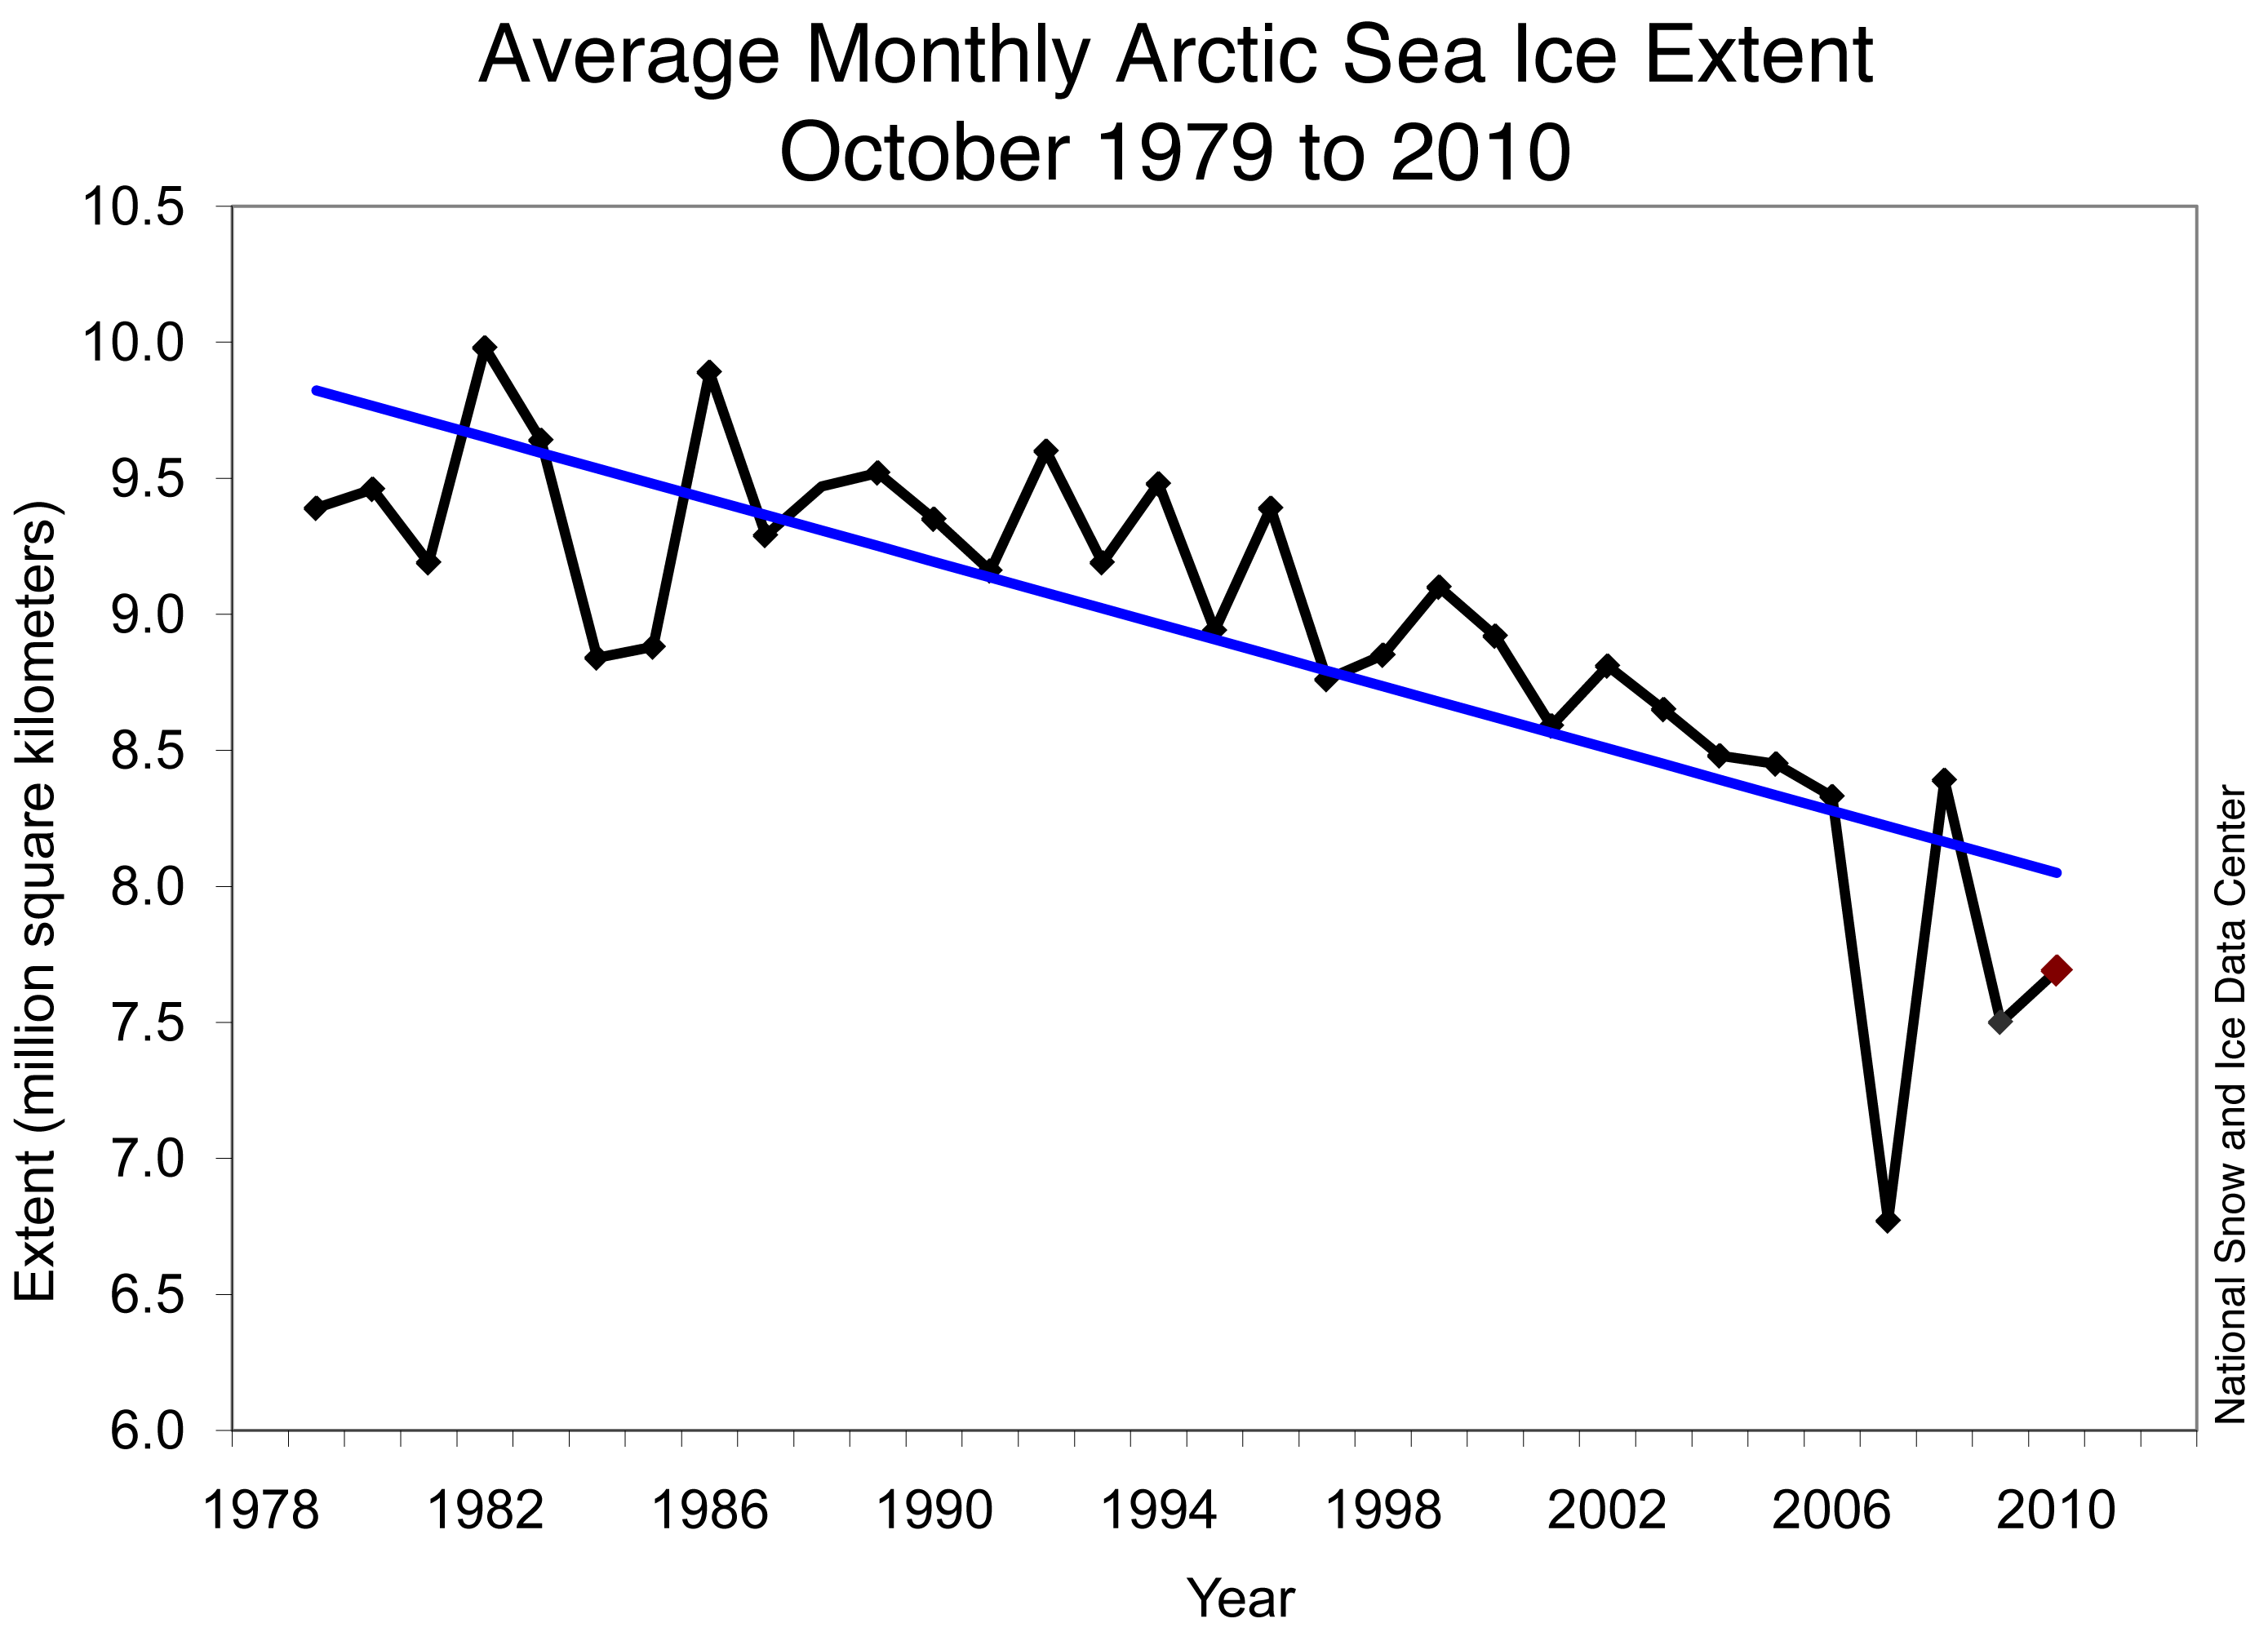
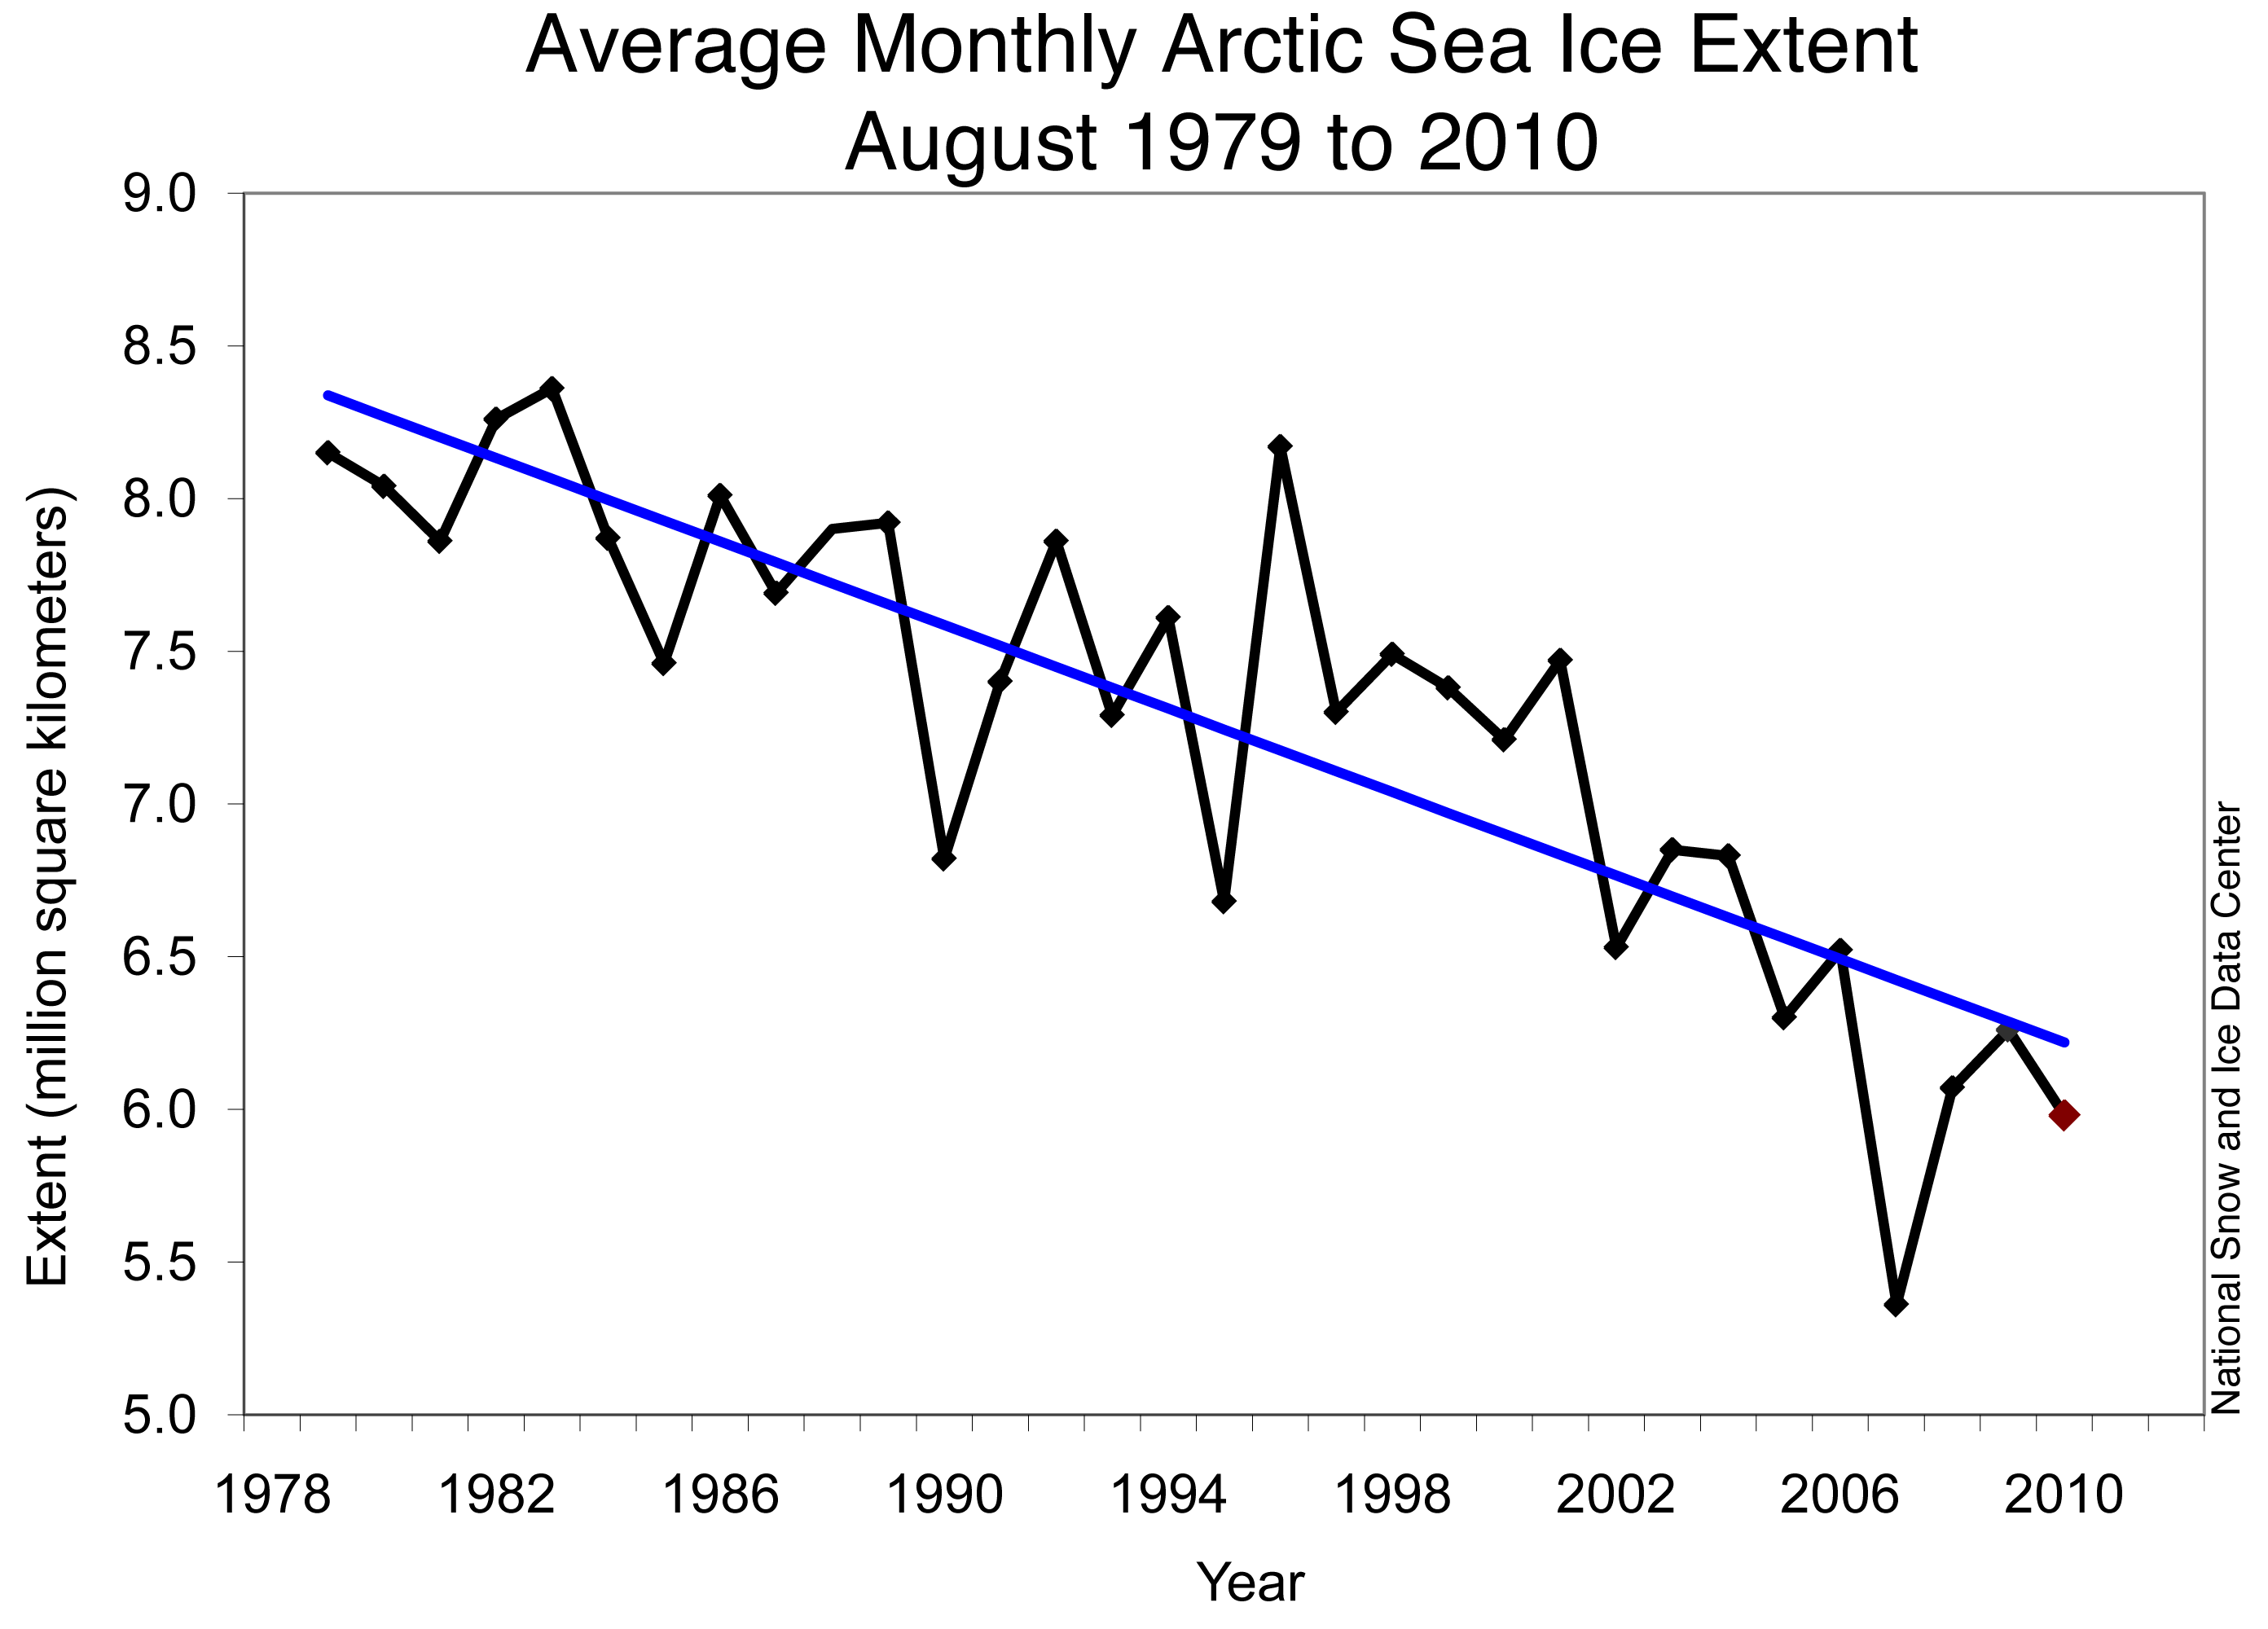
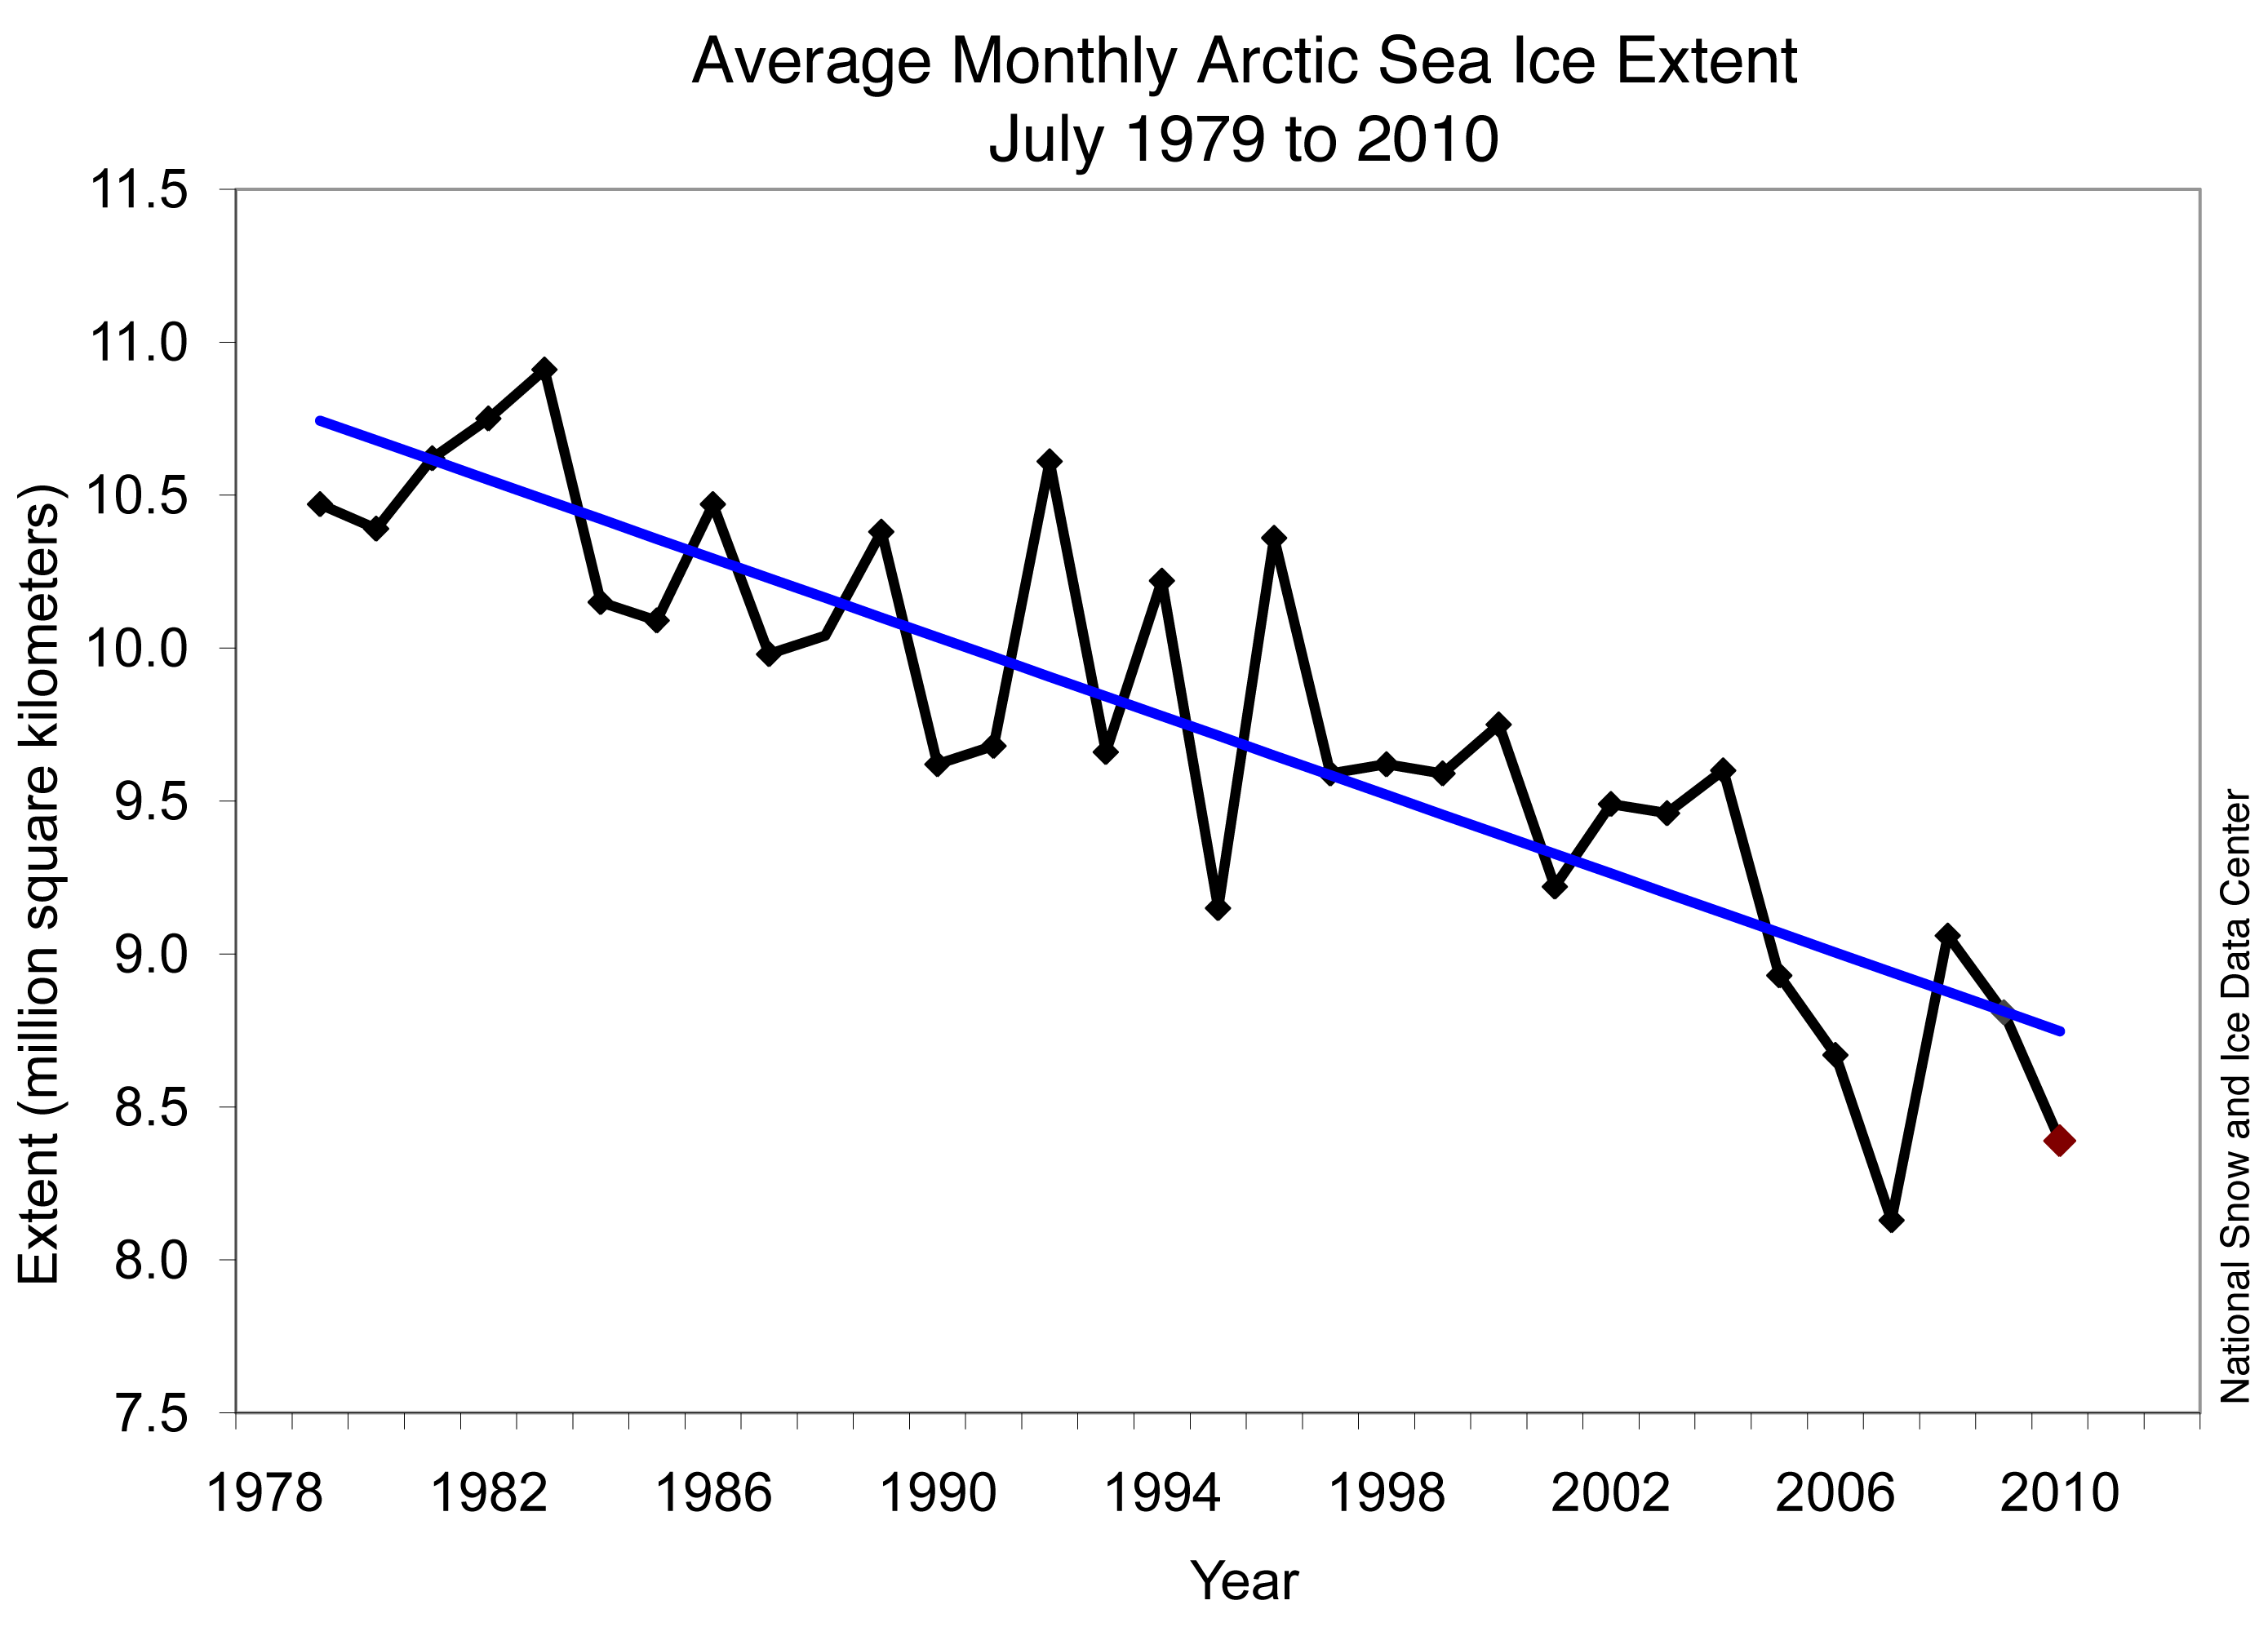
Figure 3. Monthly March ice extent for 1979 to 2011 shows a decline of 2.7% per decade. —Credit: National Snow and Ice Data Center
High-resolution image


March 2011 compared to past years

March 2011 had the second-lowest ice extent for the month in the satellite record, after 2006. Including 2011, the March trend in sea ice extent is now at -2.7 percent per decade.

figure 4: masie graph
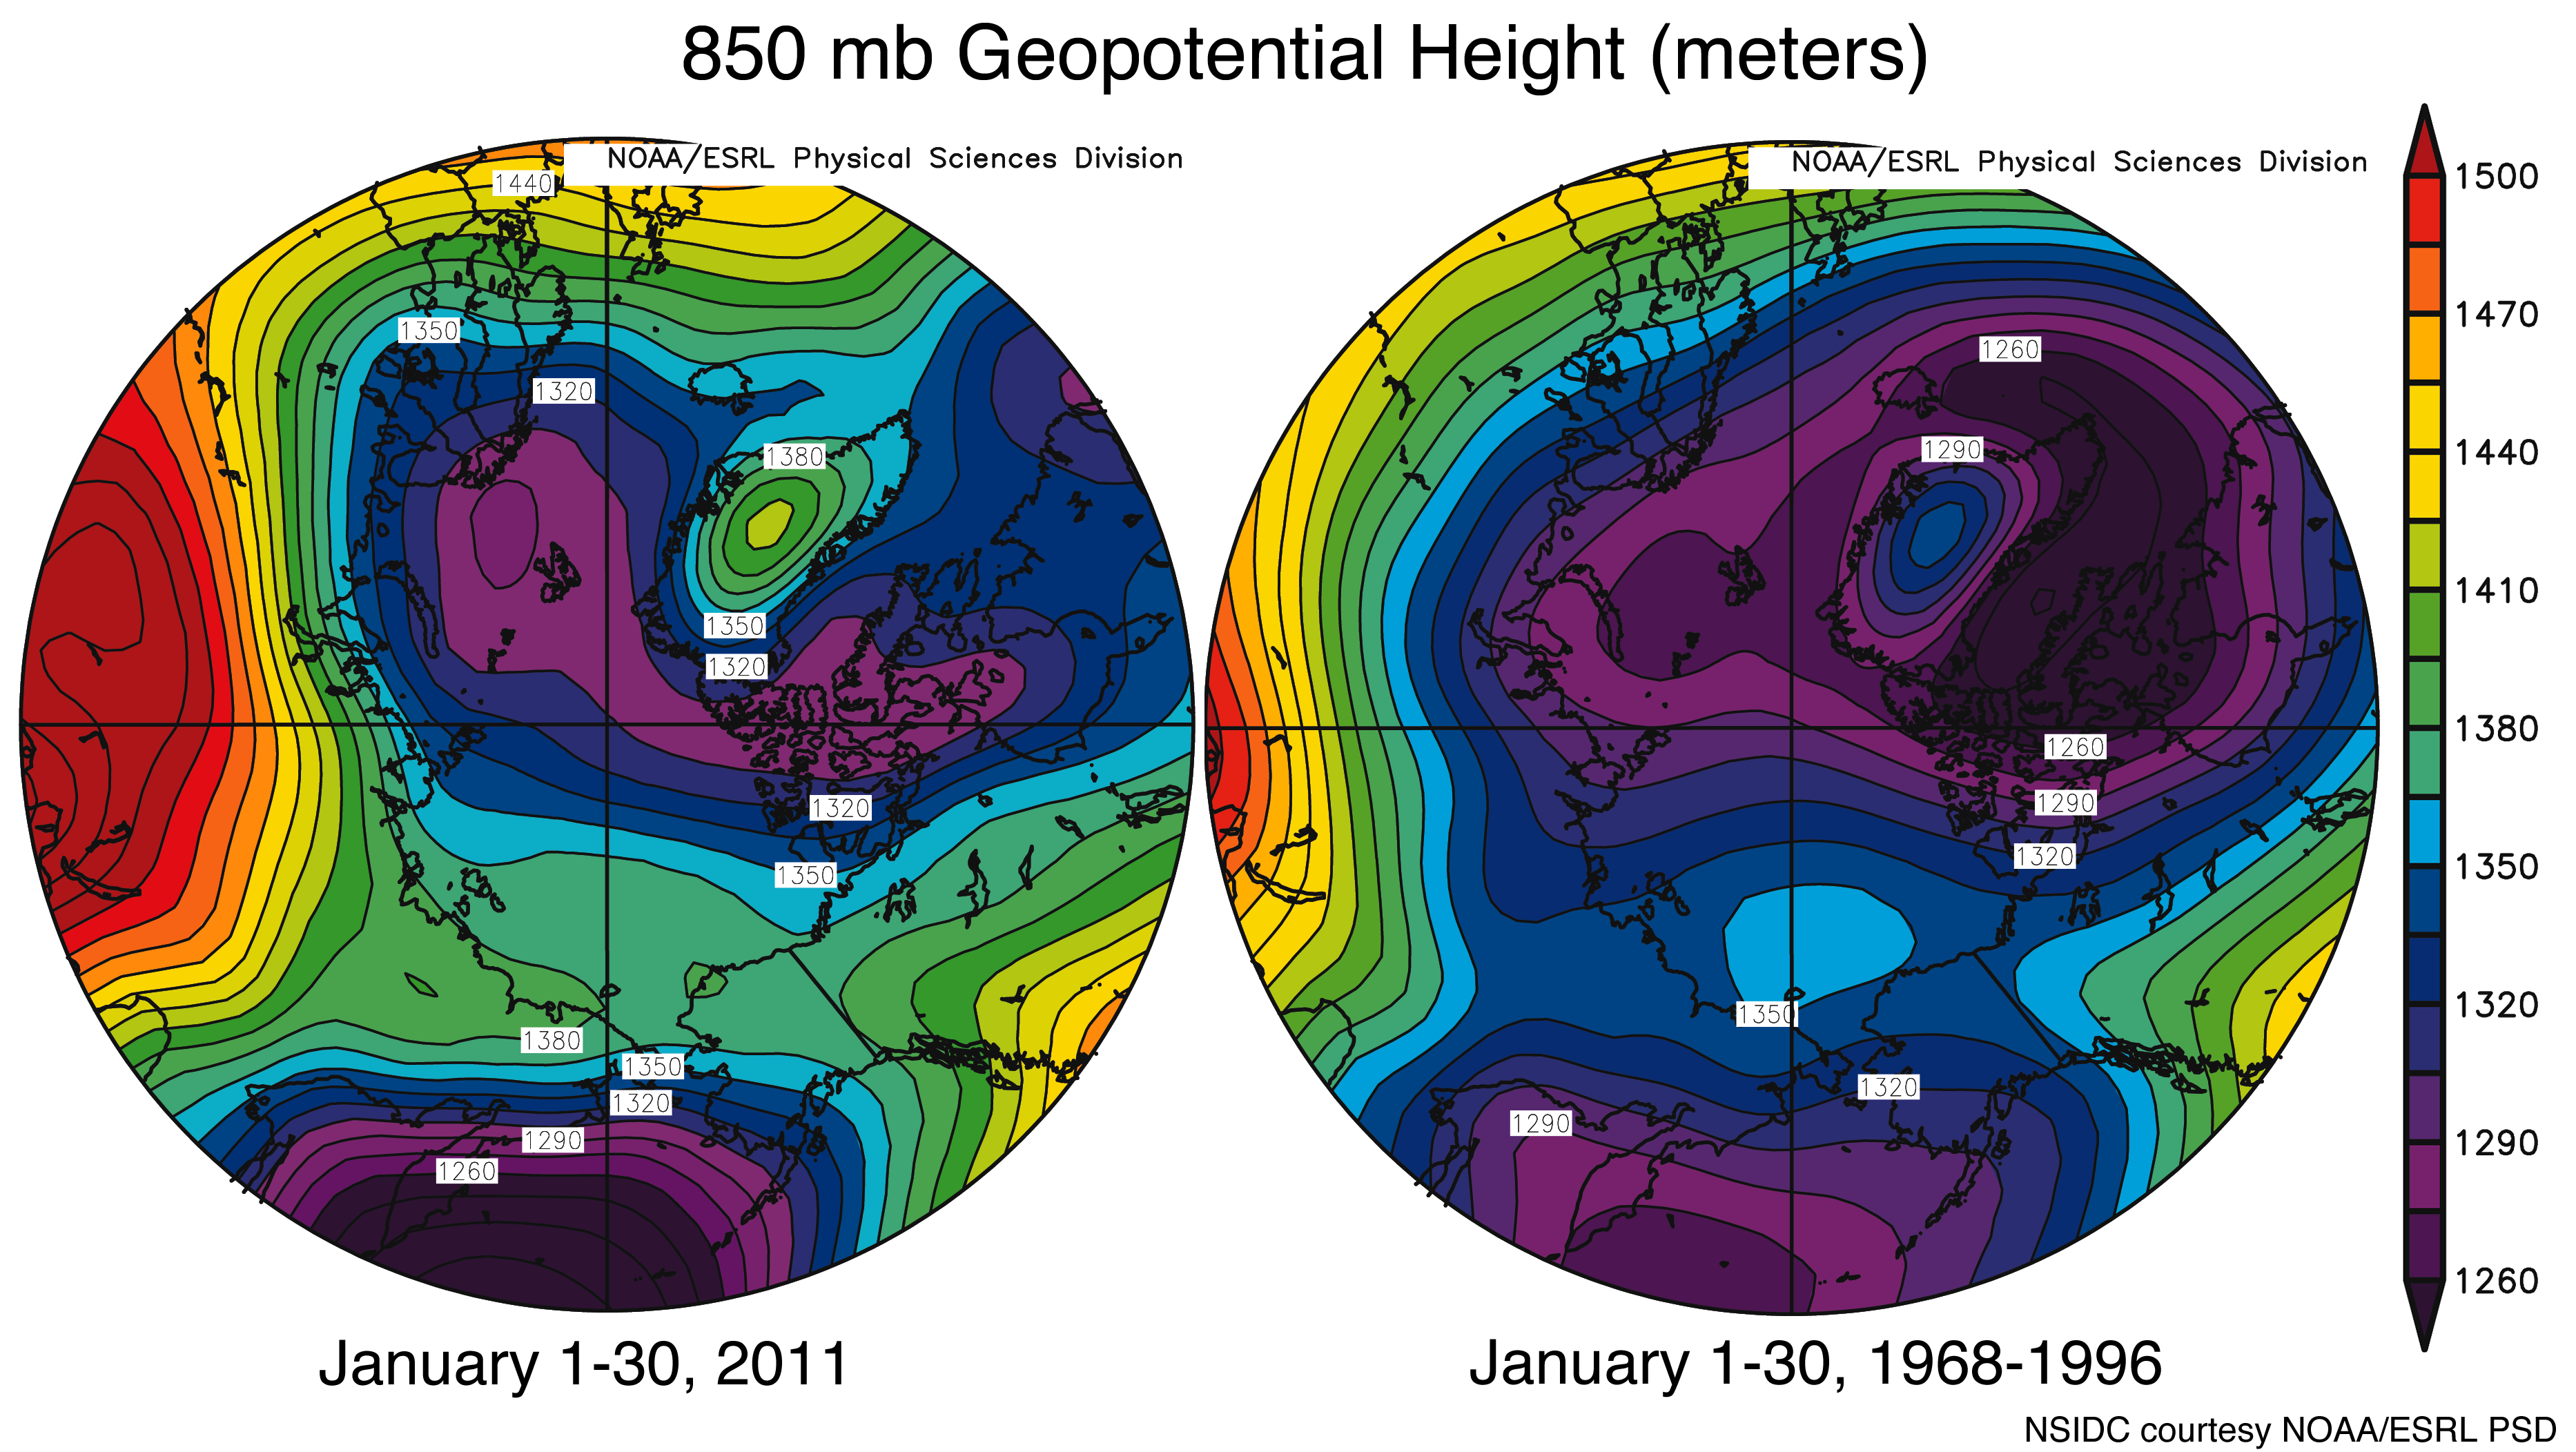
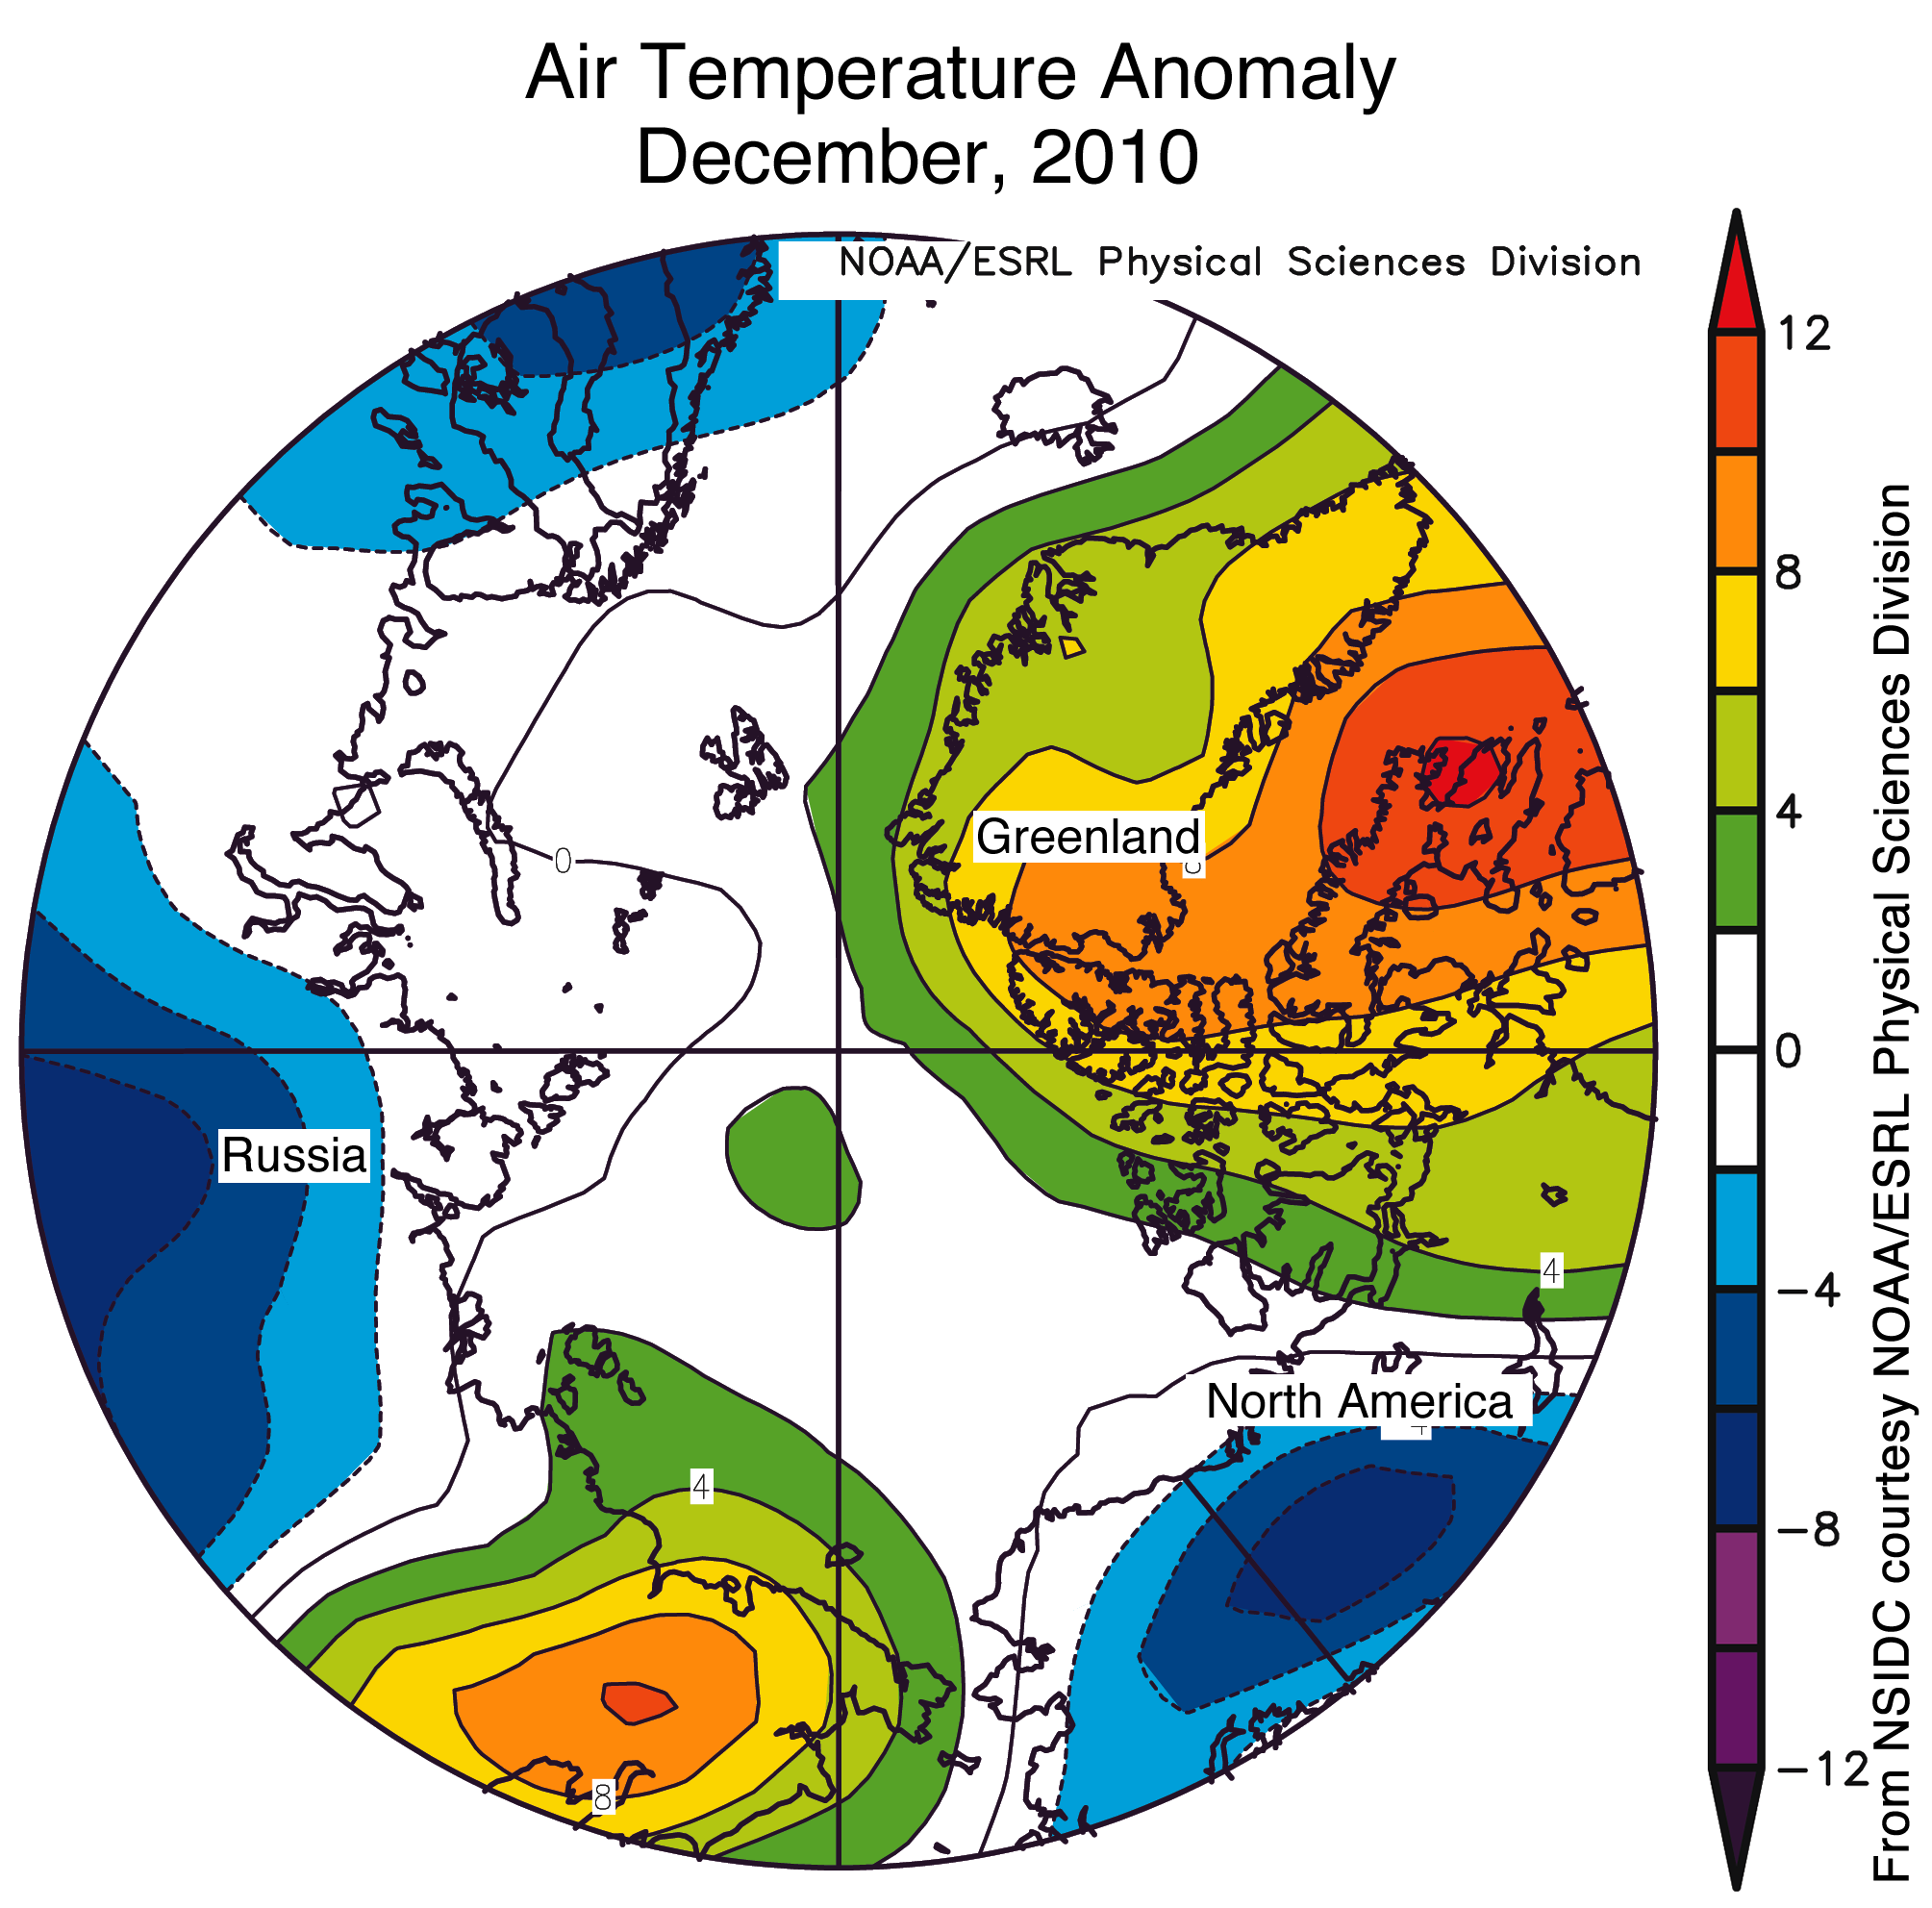
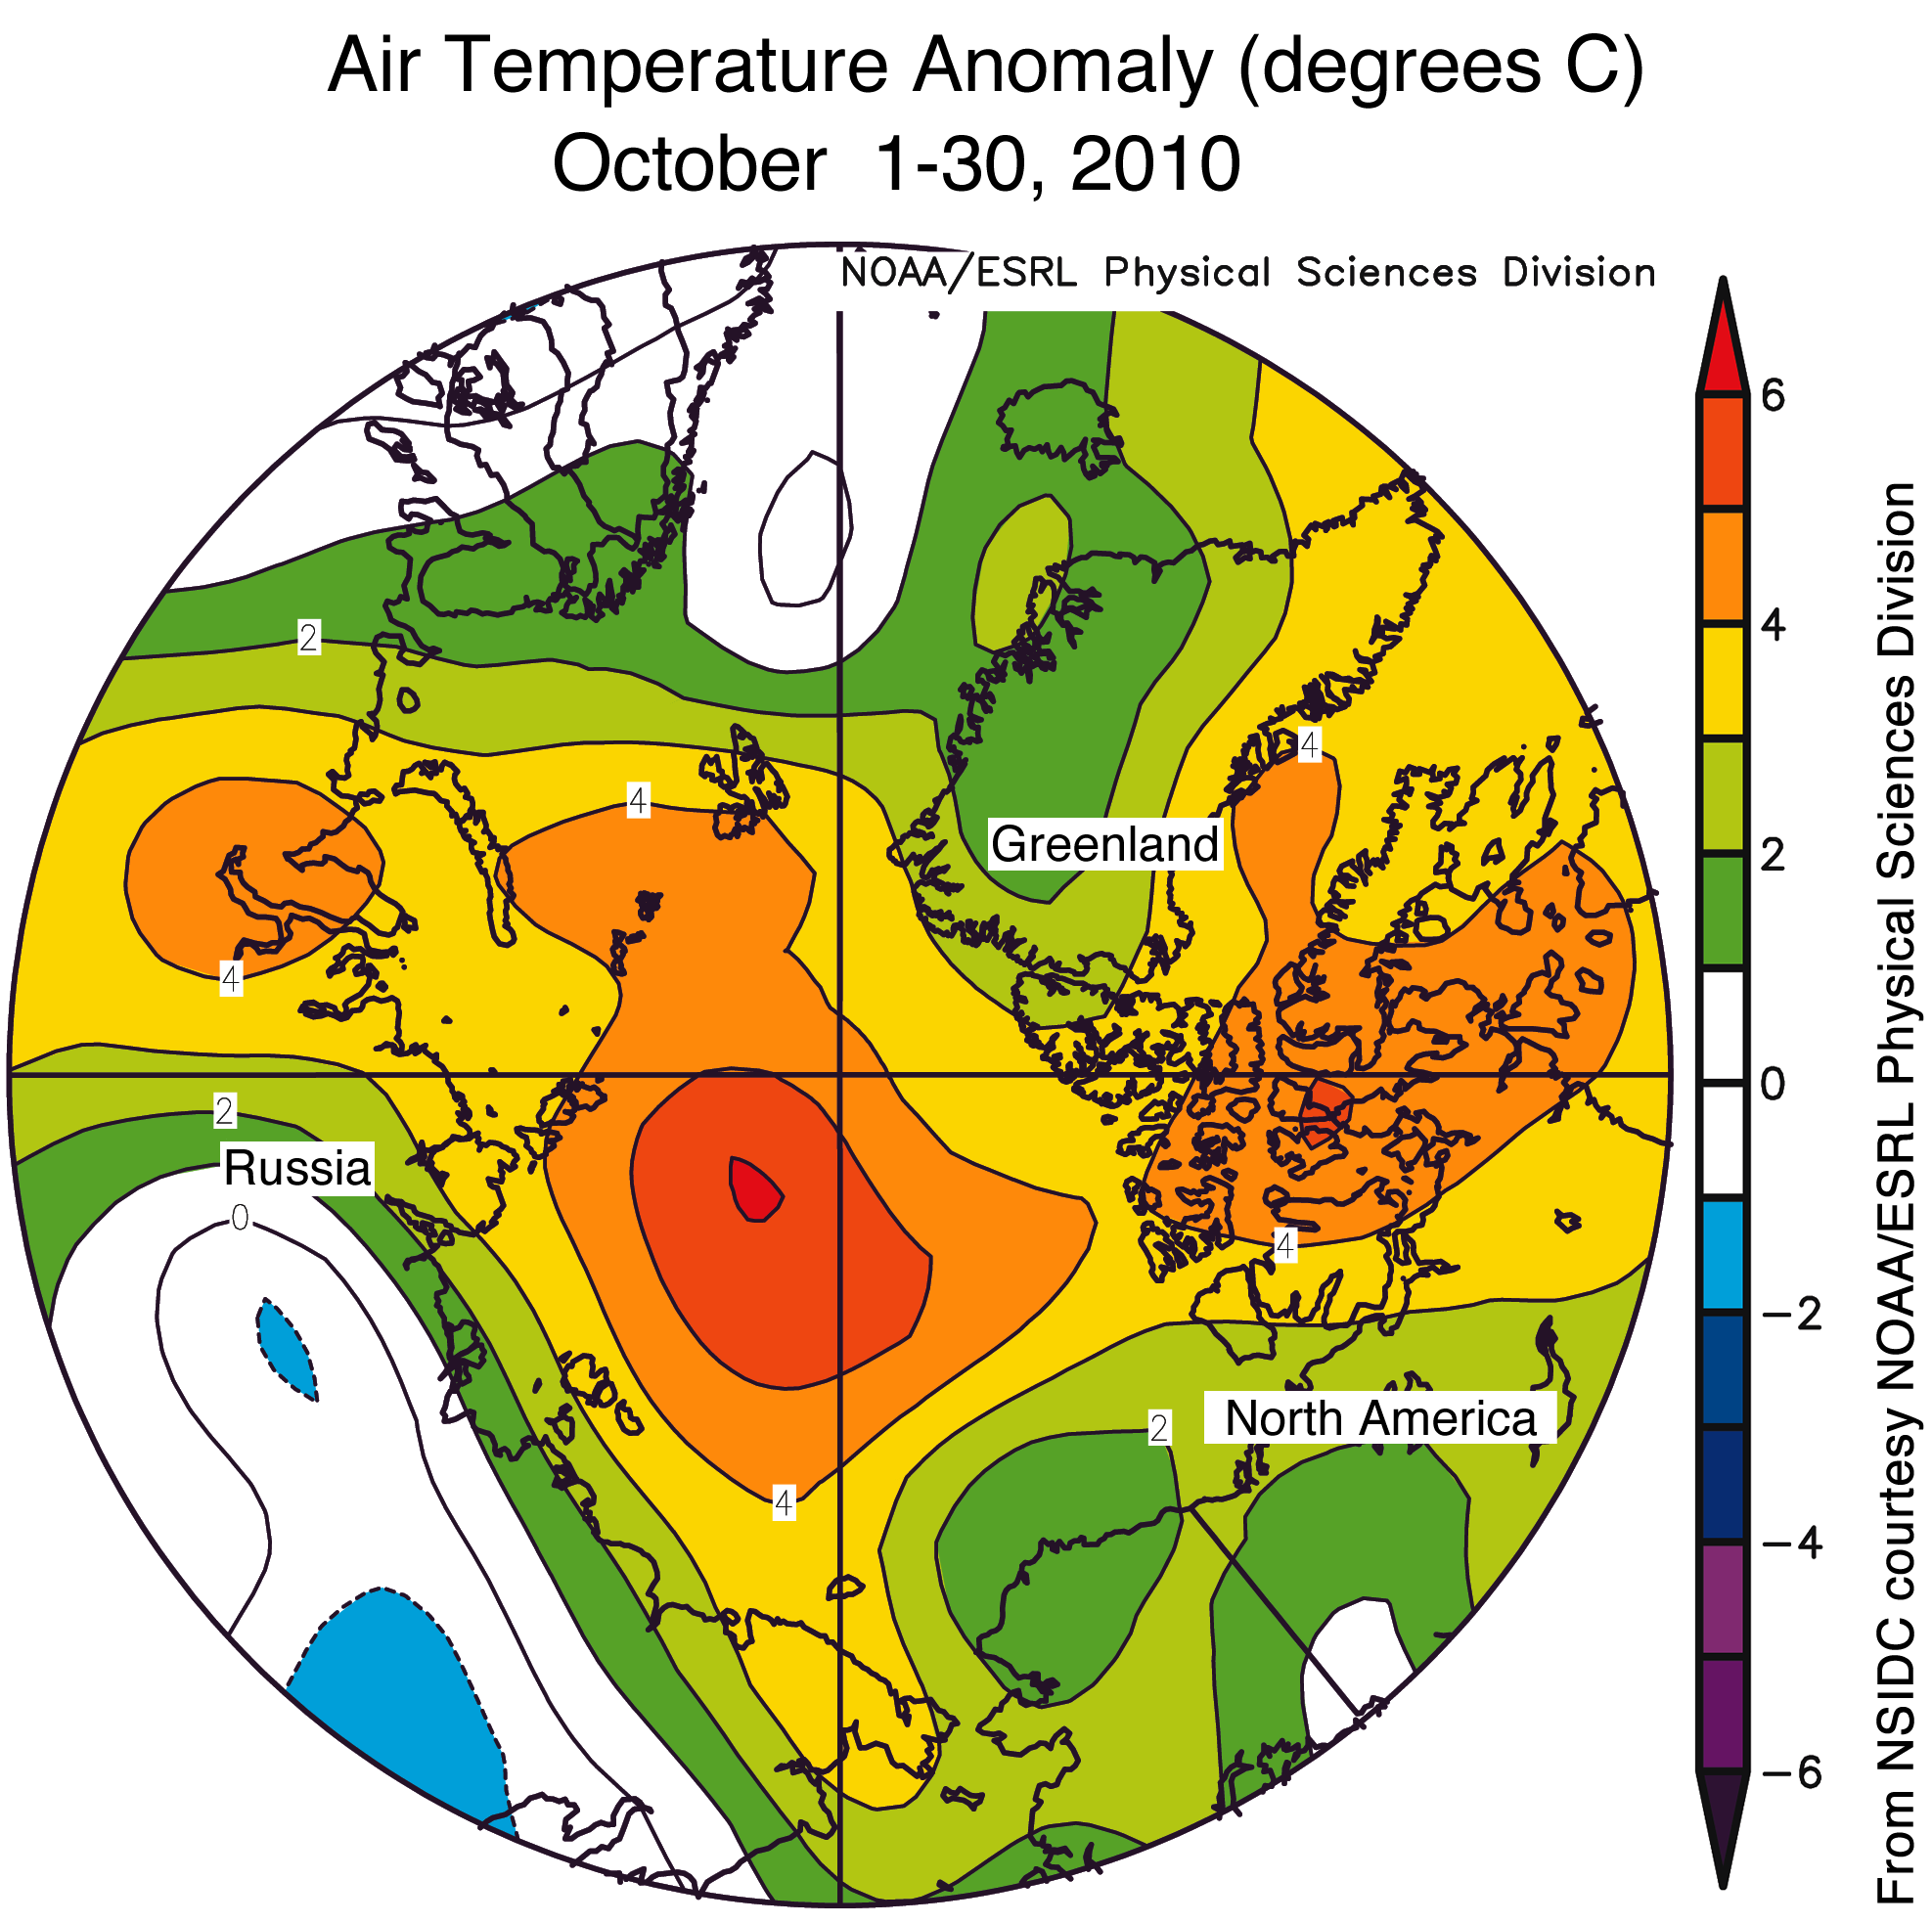
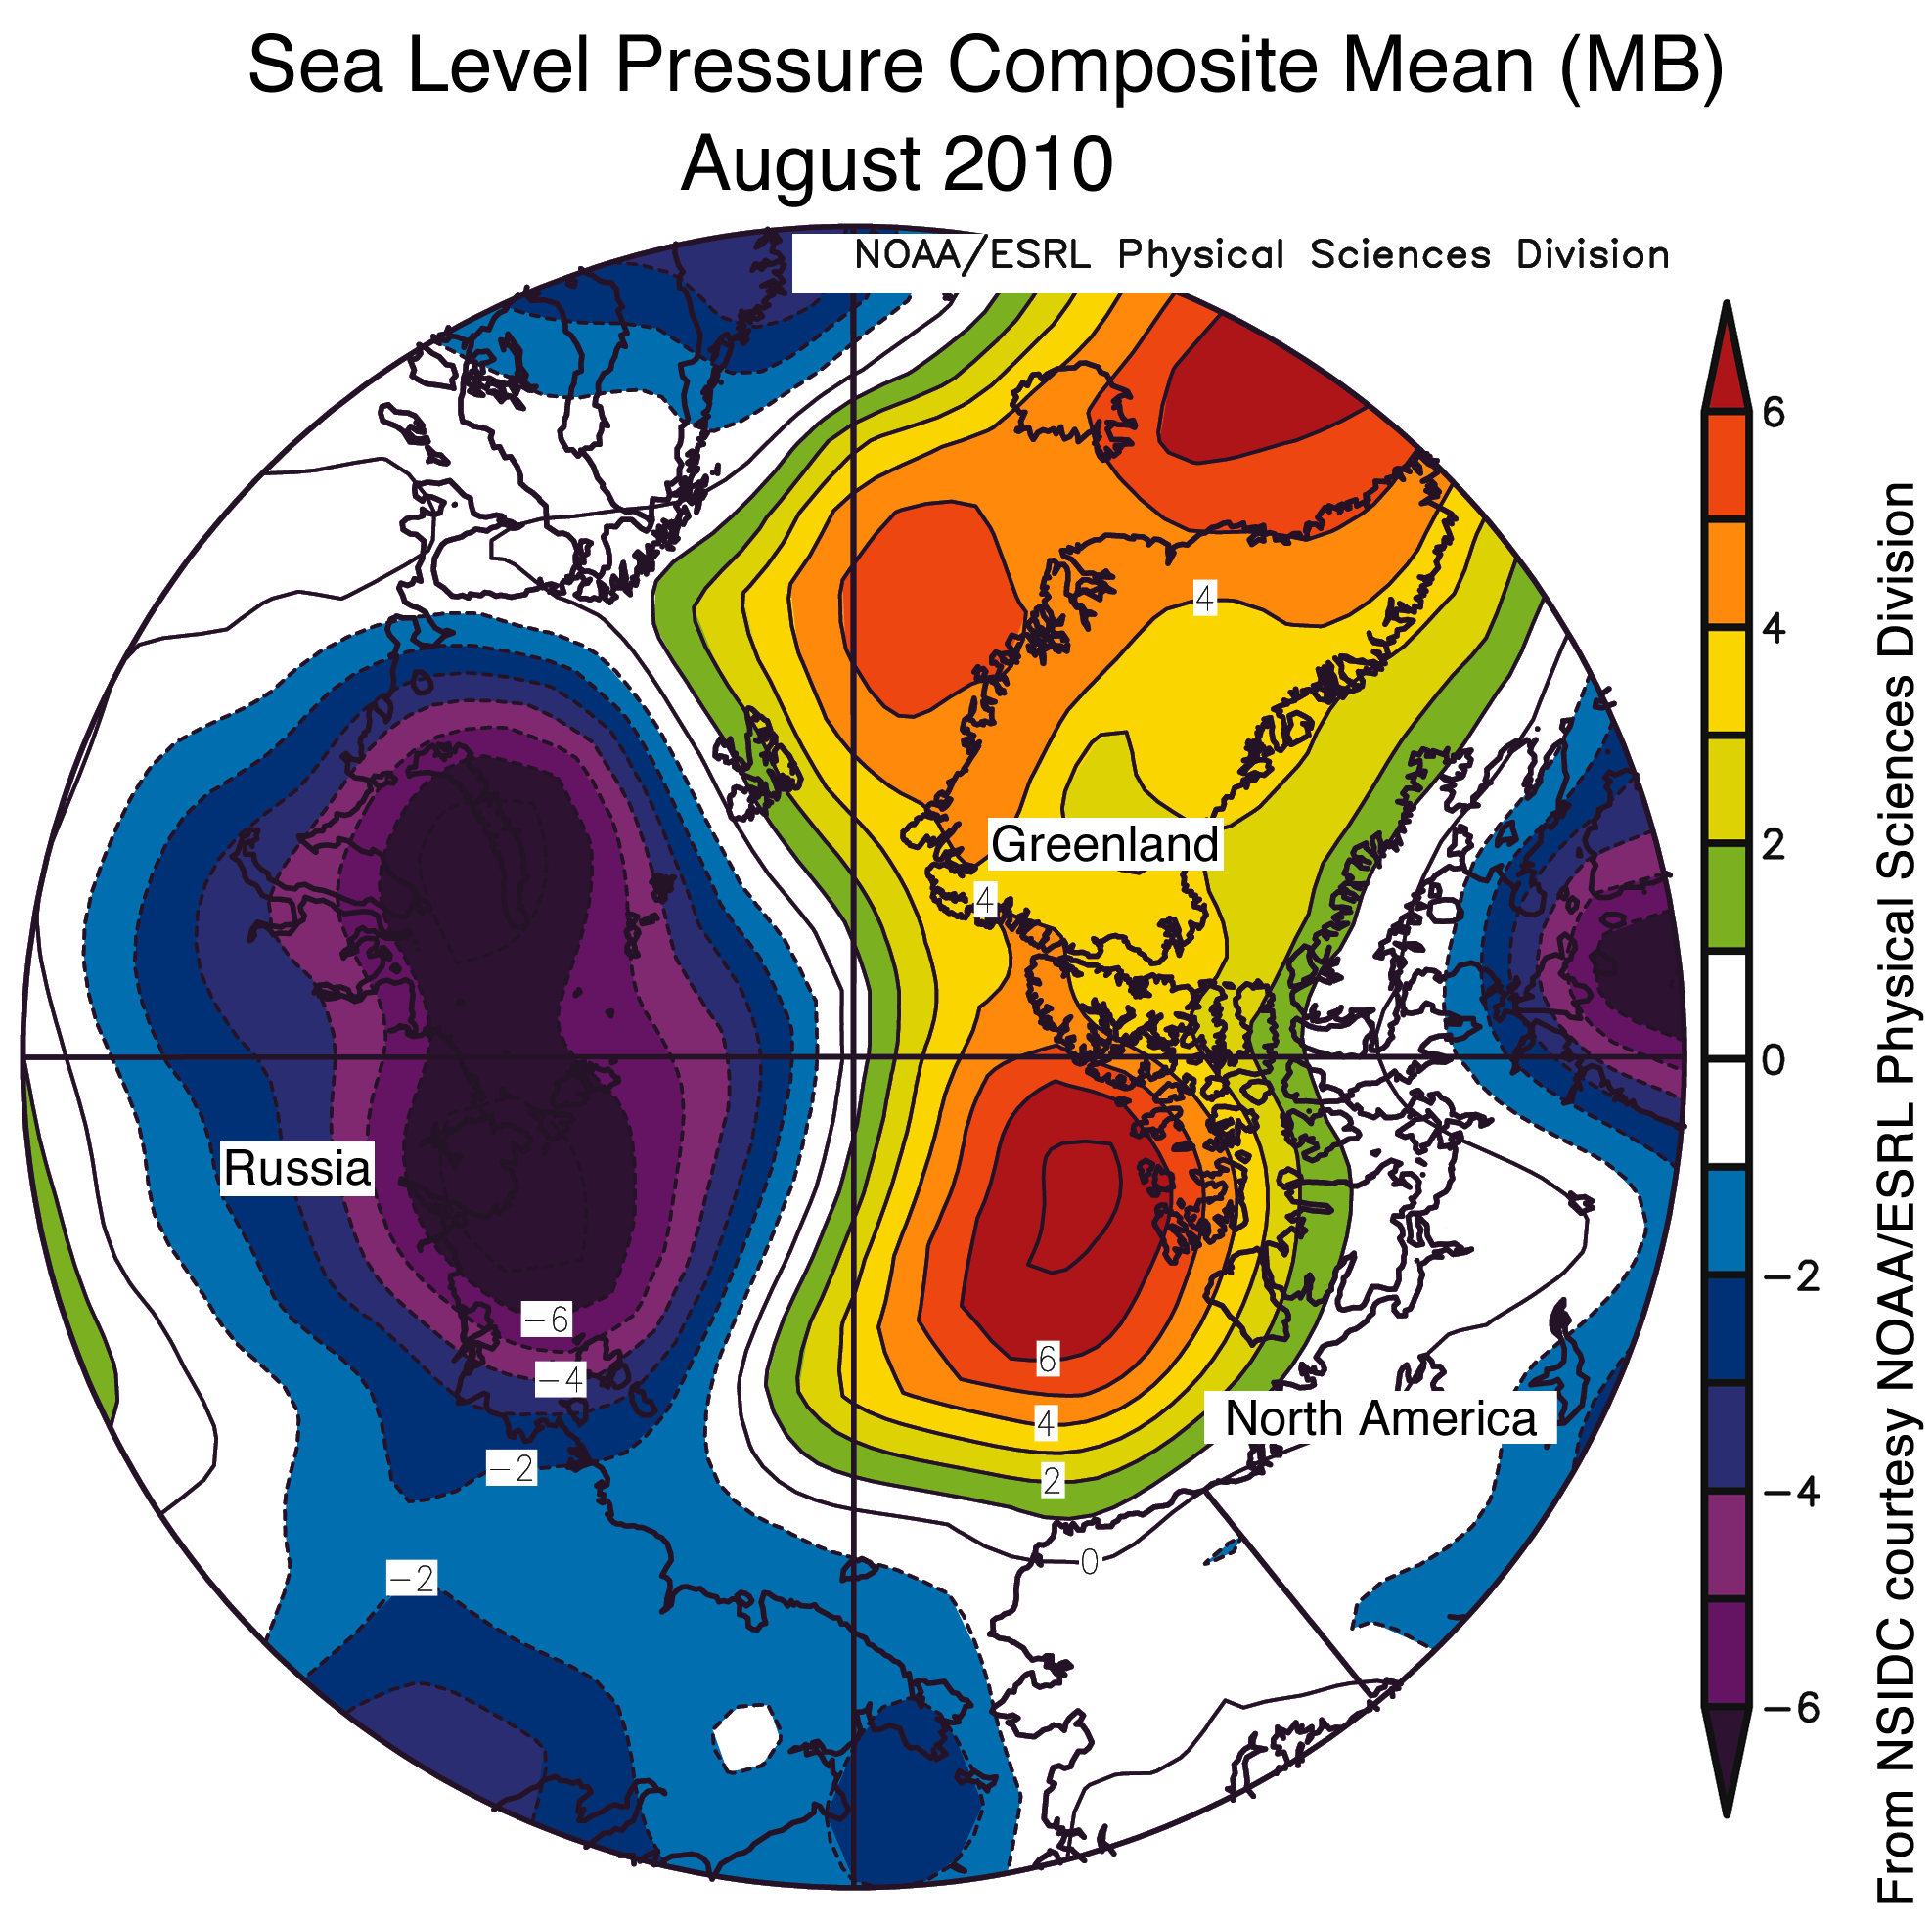
Figure 4. Air temperature anomalies for March 2011 show unusually warm conditions centered over the Chukchi Sea and relatively cool conditions over Greenland, the Norwegian Sea, and part of Canada.
—Credit: NSIDC courtesy NOAA ESRL PSD

High-resolution image


Warm temperatures continue

Air temperatures over almost all of the Arctic Ocean were above average, reaching 7 to 9 degrees Celsius (13 to 16 degrees Fahrenheit) above average over the Chukchi Sea. Below-average temperatures were found over Greenland, the Norwegian Sea and part of Canada.

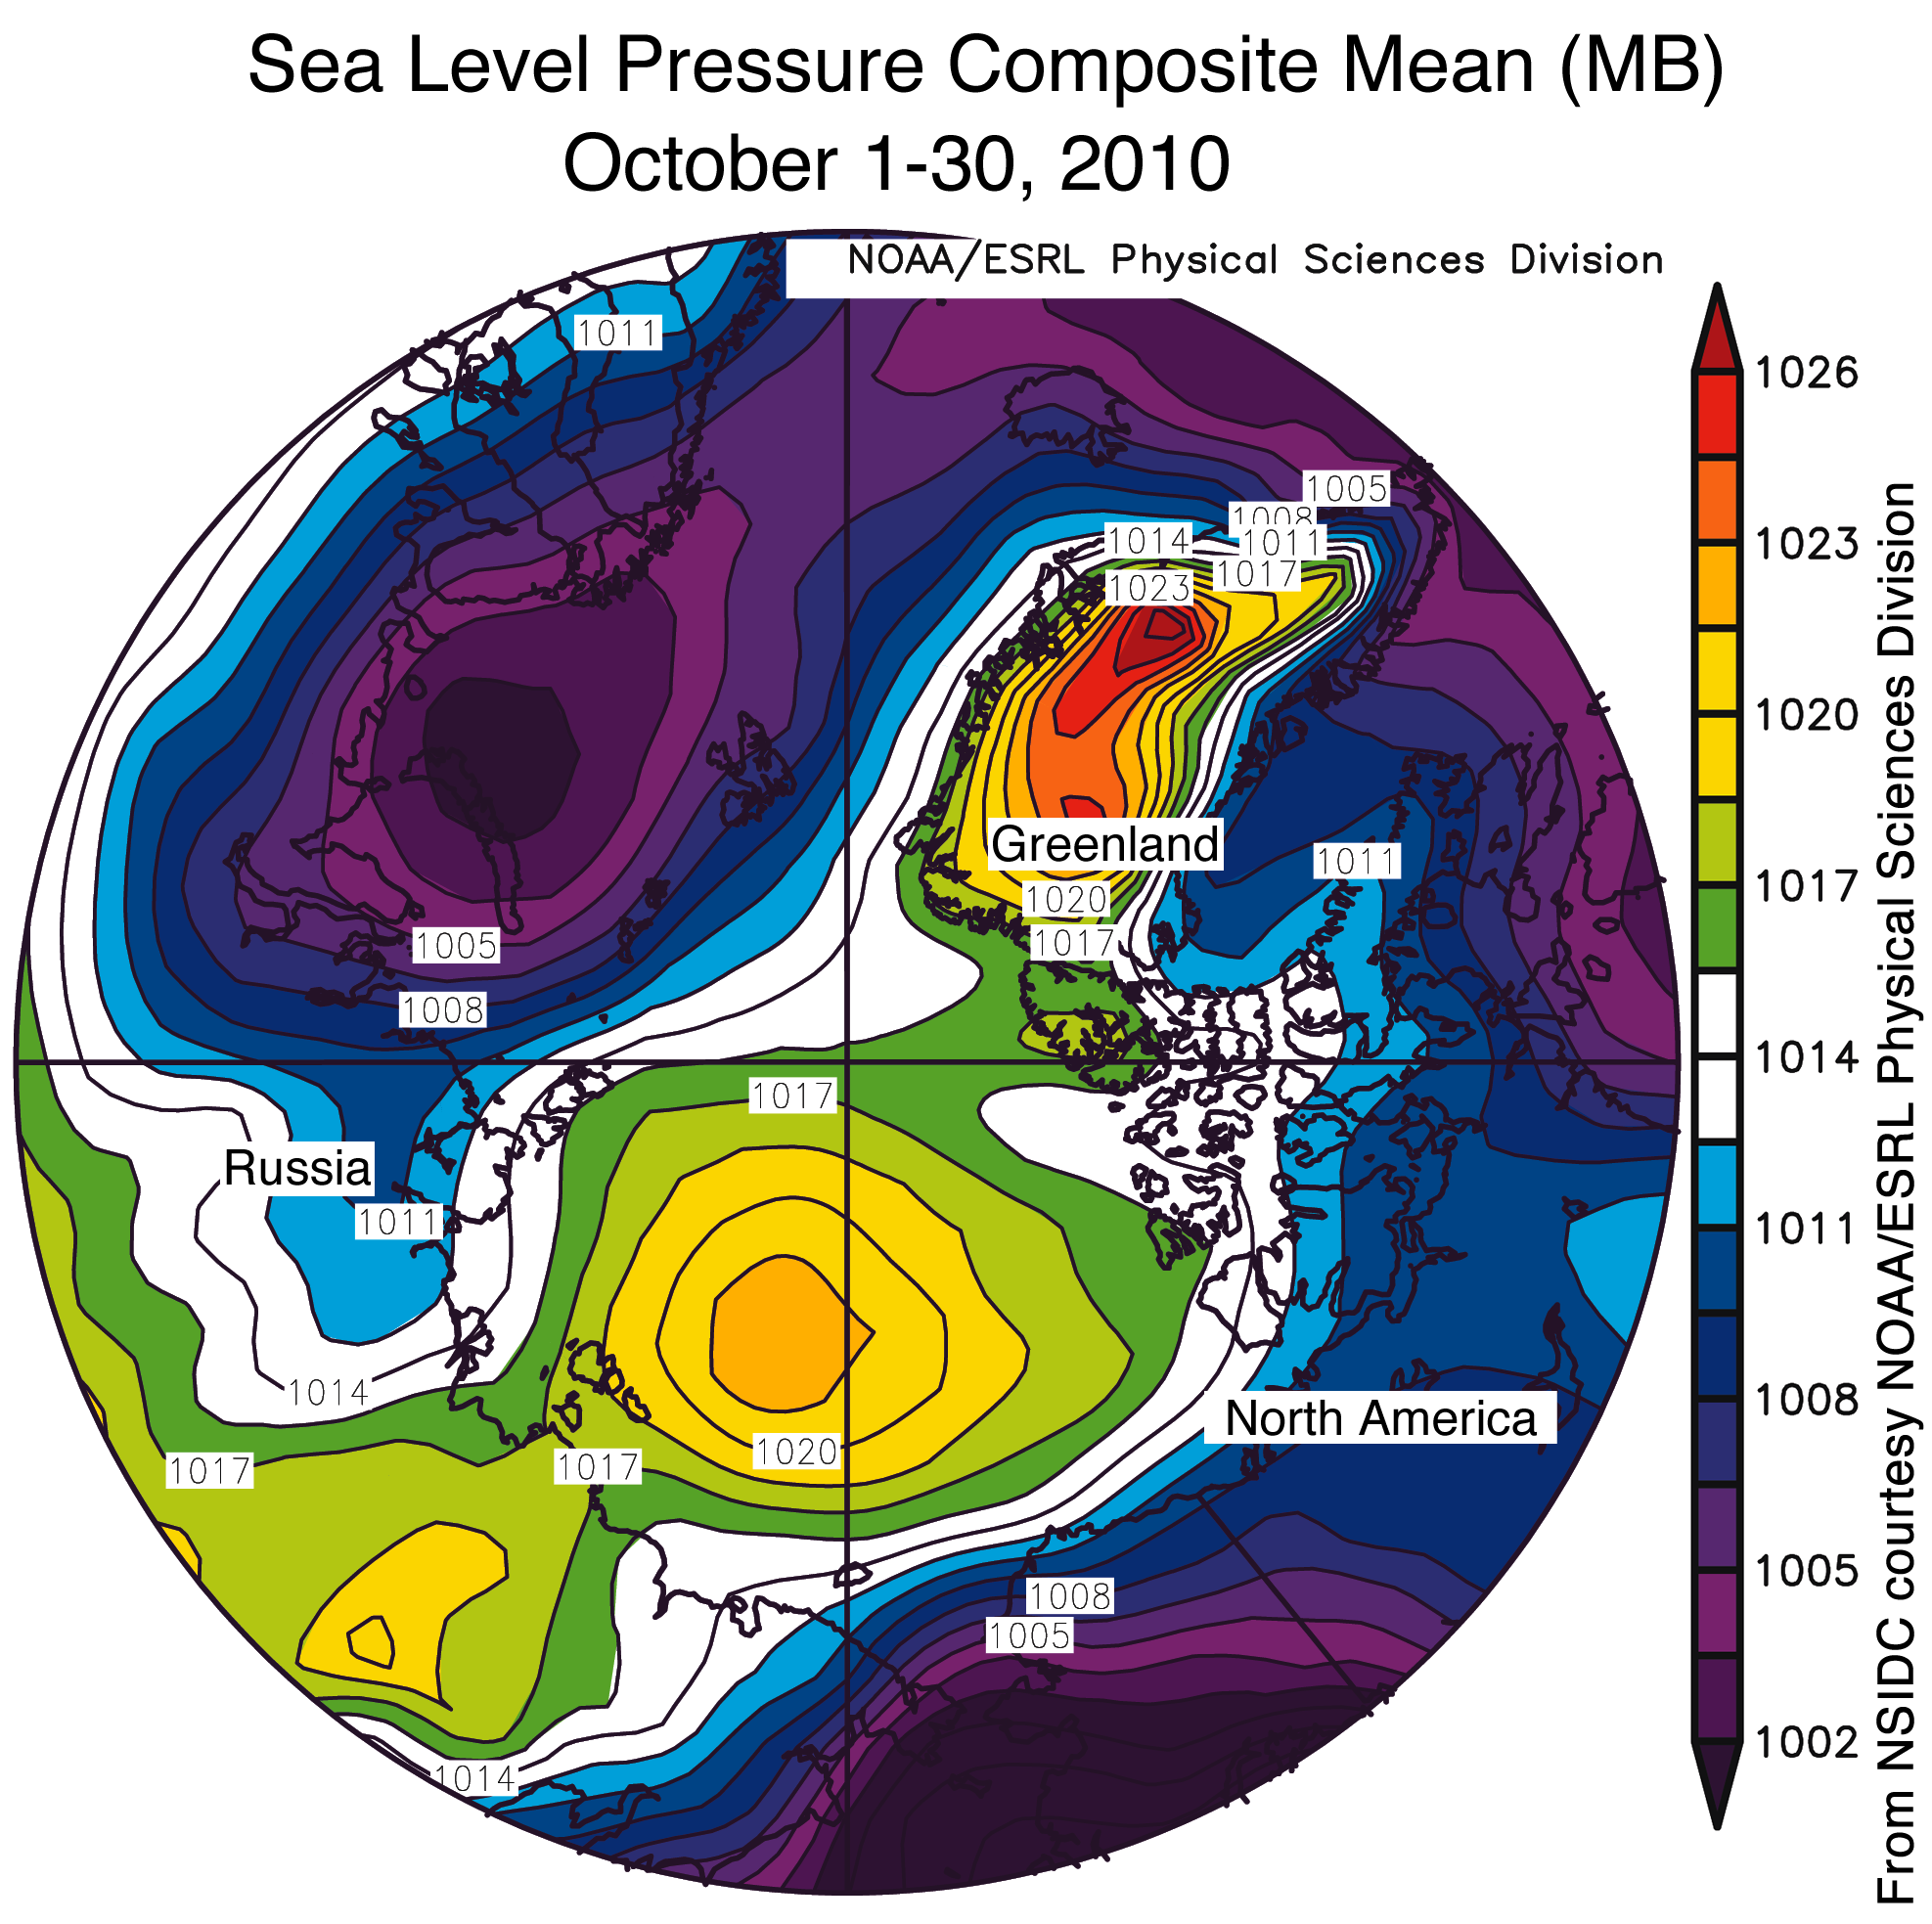
Atmospheric circulation for March was dominated by a broad low-pressure area, centered over the northern Barents Sea. Winds associated with this pattern drew warm, southerly air into the Chukchi Sea region.

As in February, the Arctic Oscillation (AO) mainly stayed in its positive phase, which tends to bring lower-than-average pressure over much of the Arctic, and higher-than-normal pressure in middle latitudes. For more information on current AO conditions, visit the NOAA Climate Prediction Center Web page.

figure 5: snow cover extent and anomaly
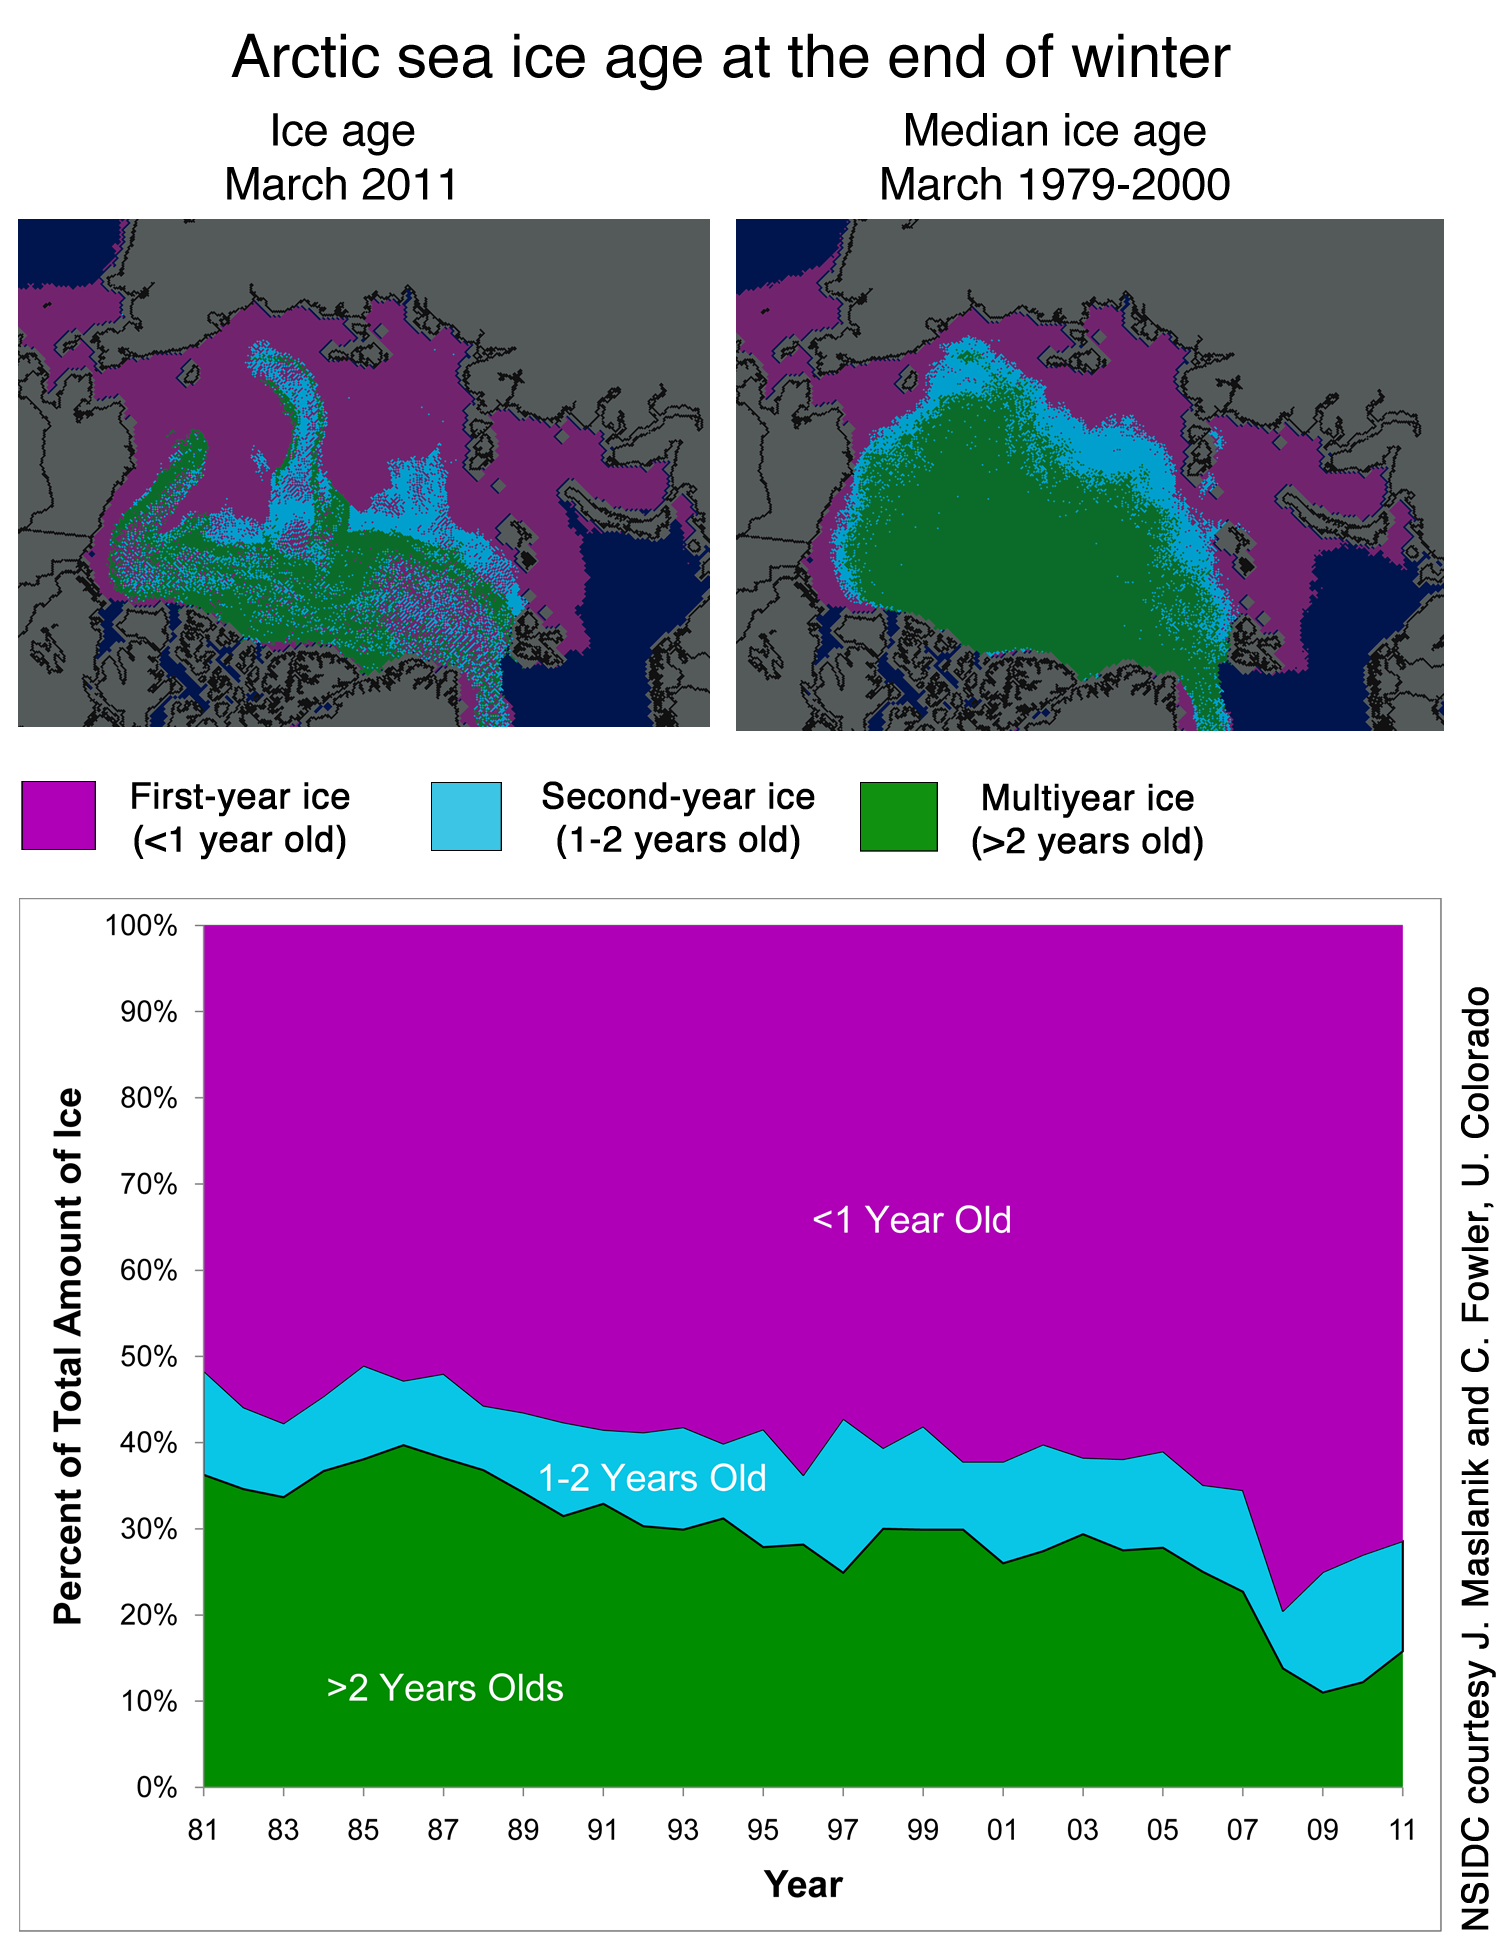
Figure 5. These images show ice age during the third week of March, for 2011 and averaged over the reference period of 1979 to 2000. The bottom figure shows ice age as a percentage of total ice in the Arctic.
—Credit: NSIDC courtesy J. Maslanik and C. Fowler, University of ColoradoHigh-resolution image


Ice age

Every year at the start of the melt season, scientists look at sea ice age, using data from satellites and buoys. Older ice that has survived several summer melt seasons tends to be thicker, while newer ice is thinner and more vulnerable to melt in summer. Over the past several decades, the spring ice cover has become increasingly dominated by younger and generally thinner ice, because of strong summer melting in recent years that has reduced the amount of ice surviving into winter.

This year the older, thicker ice has increased somewhat over last year, although it remains younger than the 1979 to 2000 average ice age. Data through the third week of March shows an increase in sea ice one to two years old, and older than two years old, compared to recent years. However, the amount of older ice remains much lower than in the mid-1980s, and there is still almost none of the oldest ice, older than four years old, that used to dominate much of the Arctic Ocean.

The distribution of old and young ice at the end of March 2011 also looks different than the standard comparison period of 1981 to 2000. Winds and ocean currents this winter resulted in an unusual tongue of old ice extending from north of the Canadian Arctic Archipelago into the Beaufort and Chukchi Seas, in a region that used to be dominated by old ice that usually survived the summer melt season. A similar tongue of old ice appeared in March 2010, which almost completely melted away during the summer of 2010. Whether the tongue of old ice seen this spring melts away this summer will depend largely on ocean temperature and the weather patterns that set up over the next six months.

Note: James Maslanik and colleagues recently recalculated their entire series of ice age data based on a minimum of 15% concentration. The old version used a 40% minimum. The reprocessed ice age data is therefore more consistent with other measures of sea ice, including NSIDC sea ice extent data, which use a threshold of 15%.

For previous analyses, please see the drop-down menu under Archives in the right navigation at the top of this page.

Annual maximum ice extent reached

Arctic sea ice extent appeared to reach its maximum extent for the year on March 7, marking the beginning of the melt season. This year’s maximum tied for the lowest in the satellite record. NSIDC will release a detailed analysis of 2010 to 2011 winter sea ice conditions during the second week of April.

map from space showing sea ice extent, continentsFigure 1. Arctic sea ice extent on March 7 was 14.64 million square kilometers (5.65 million square miles). The orange line shows the 1979 to 2000 median extent for that day. The black cross indicates the geographic North Pole. Sea Ice Index data. About the data. —Credit: National Snow and Ice Data Center
High-resolution image


Overview of conditions

On March 7, 2011, Arctic sea ice likely reached its maximum extent for the year, at 14.64 million square kilometers (5.65 million square miles). The maximum extent was 1.2 million square kilometers (471,000 square miles) below the 1979 to 2000 average of 15.86 million square kilometers (6.12 million square miles), and equal (within 0.1%) to 2006 for the lowest maximum extent in the satellite record.

graph with months on x axis and extent on y axis Figure 2. The graph above shows daily Arctic sea ice extent as of March 22, 2011, along with daily ice extents for 2006, which had the previous lowest maximum extent, and 2007, the year with the lowest minimum extent in September. Light blue indicates 2011, green shows 2007, light green shows 2006, and dark gray shows the 1979 to 2000 average. The gray area around the average line shows the two standard deviation range of the data. Sea Ice Index data.—Credit: National Snow and Ice Data Center
High-resolution image


Conditions in context

As of March 22, ice extent has declined for five straight days. However there is still a chance that the ice extent could expand again. Sea ice extent in February and March tends to be quite variable, because ice near the edge is thin and often quite dispersed. The thin ice is highly sensitive to weather, moving or melting quickly in response to changing winds and temperatures, and it often oscillates near the maximum extent for several days or weeks, as it has done this year.

Since the start of the satellite record in 1979, the maximum Arctic sea ice extent has occurred as early as February 18 and as late as March 31, with an average date of March 6.

Final analysis pending

In the beginning of April, NSIDC will issue a formal announcement with a full analysis of the 2010 to 2011 winter season, and graphics comparing this year to the long-term record. We will also announce the monthly average March sea ice extent, the measure scientists rely on for accurate analysis and comparison over the long term.

For previous analyses, please see the drop-down menu under Archives in the right navigation at the top of this page.

February Arctic ice extent ties 2005 for record low; extensive snow cover persists

Arctic sea ice extent for February 2011 tied with February 2005 as the lowest recorded in the satellite record. Sea ice extent was particularly low in the Labrador Sea and Gulf of St. Lawrence. In contrast, winter snow cover remained extensive in many parts of the Northern Hemisphere.

map from space showing sea ice extent, continentsFigure 1. Arctic sea ice extent for February 2011 was 14.36 million square kilometers (5.54 million square miles). The magenta line shows the 1979 to 2000 median extent for that month. The black cross indicates the geographic North Pole. Sea Ice Index data. About the data. —Credit: National Snow and Ice Data Center
High-resolution image


Overview of conditions

Sea ice extent averaged over the month of February 2011 was 14.36 million square kilometers (5.54 million square miles). This was a tie with the previous record low for the month, set in 2005. February ice extent remained below normal in both the Atlantic and Pacific sectors, particularly in the Labrador Sea and the Gulf of St. Lawrence.

While ice extent has declined less in winter months than in summer, the downward winter trend is clear. The 1979 to 2000 average is 15.64 million square kilometers (6.04 million square miles). From 1979 through 2003, the February extent averaged 15.60 million square kilometers (6.02 million square miles). Every year since 2004 has had a mean February extent below 15 million square kilometers (5.79 million square miles).

graph with months on x axis and extent on y axis Figure 2. The graph above shows daily Arctic sea ice extent as of February 28, 2011, along with daily ice extents for previous low-ice-extent years in the month of February. Light blue indicates 2011, green shows 2007, purple shows 2005 (the record low for the month was in 2005), and dark gray shows the 1979 to 2000 average. The gray area around the average line shows the two standard deviation range of the data. Sea Ice Index data.—Credit: National Snow and Ice Data Center
High-resolution image


Conditions in context

While ice extent grew at average rates for February, the overall extent remained anomalously low. Air temperatures over most of the Arctic Ocean were between 2 and 4 degrees Celsius (4 and 7 degrees Fahrenheit) higher than normal. Over the East Greenland Sea and north towards the Pole, air temperatures were 5 to 7 degrees Celsius (9 to 13 degrees Fahrenheit) higher than normal. Colder conditions, 2 to 6 degrees Celsius (4 to 11 degrees Fahrenheit) below average persisted over western Eurasia, east-central Eurasia and some of the Canadian Arctic.

As air temperatures dropped in the eastern Canadian Arctic in February, parts of the Labrador Sea started to freeze over. However, the Gulf of St. Lawrence remained mostly free of ice. As during winter 2010, when Environment Canada reported that sea ice in the Gulf of St. Lawrence was at the lowest level on record, the lack of ice will make it difficult for harp seals to give birth to their pups on the sea ice, as they normally do in February and March.

monthly graph
Figure 3. Monthly February ice extent for 1979 to 2011 shows a decline of 3.0% per decade. —Credit: National Snow and Ice Data Center
High-resolution image


February 2011 compared to past years

February 2011 tied February 2005 for the lowest ice extent for the month in the satellite record. Including 2011, the February trend is now at -3.0 percent per decade.

Through most of January, the Arctic Oscillation (AO) was generally in a strongly negative phase, similar to the pattern that dominated the winter of 2009 to 2010. This led to very warm temperatures over the eastern Arctic, helping to account for the low ice extents over the Labrador Sea and Gulf of Saint Lawrence. However, toward the end of January, the AO returned to a positive phase, and ice began to grow in the Labrador Sea and Gulf of St. Lawrence. For more information on current AO conditions, visit the NOAA Climate Prediction Center Web page.

figure 4: masie graph
Figure 4. Ice motion charts for December 2009 and December 2010 show mean sea ice drift, with the size and direction of the arrows indicating average speed and direction of ice motion. December 2010 saw stronger anticyclonic (clockwise) motion that transported ice towards the southern Beaufort and Chukchi seas.—Credit: NSIDC courtesy James Maslanik and Chuck Fowler, CU Boulder
High-resolution image


Ice motion

Typically during a negative AO phase, weather patterns favor the retention of thick ice in the central Arctic and Canada basin, where it can better survive the summer. The negative AO also typically leads to a stronger Beaufort Gyre, which helps move ice from the western to eastern Arctic. There the ice thickens, ridging and rafting against the Siberian coast.

Last winter, the AO was in its most negative phase since at least 1951. However, slight differences from the typical AO pattern in the location of the sea level pressure anomalies had a significant impact on how the ice moved within and out of the Arctic Basin. During winter 2009 to 2010 the peak pressure anomalies were shifted towards the Barents and Kara seas, which helped transport ice from the Canadian Arctic towards the southern Beaufort and Chukchi seas. Since some of the oldest and thickest ice in the Arctic is found north of the Canadian Archipelago, this atmospheric pattern ended up further depleting the Arctic of its store of old, thick ice as that old ice melted during summer in these southerly locations.

This winter also saw a relatively strong negative AO index during December and January.  However, as we discussed in our January 5, 2011 post, the positive sea level pressure anomalies were centered near Iceland. This led to a more extensive anticyclonic (clockwise) transport pattern than last winter.  This may help keep a more extensive distribution of multiyear ice cover as summer approaches.

figure 5: snow cover extent and anomaly
Figure 5. The maps of January and February 2011 snow cover data show the extent of snow cover over the Northern Hemisphere (top), and the percent difference from average snow cover extent from 1971 to 2000 (bottom). Strong positive departures can be seen over the midwestern U.S., western China, and Mongolia.—Credit: NSIDC courtesy Dave Robinson and Thomas Estilow, Rutgers University
High-resolution image


January and February Northern Hemisphere snow cover

Sea ice extent is only one of a number of data sets scientists use to understand how climate is changing. Rutgers University and NOAA have compiled a 45-year record of Northern Hemisphere snow cover extent from NOAA snow charts. These data show that much of northern North America, Scandinavia and northern Eurasia are snow covered between 90 and 100 percent of the time in January and February. High elevation plains and mountains at lower latitudes, such as the southern Rocky Mountains in the U.S. and Hindu Kush in Asia, also have extensive snow cover.

Over this record, in January, Northern Hemisphere snow cover averages 47 million square kilometers (18.1 million square miles), and in February it averages 46 million square kilometers (17.8 square miles)—approximately 45 to 46 percent of the land area in the region. While sea ice extent was below average for January 2011, this month had the sixth-largest snow cover extent since the record started in 1966, at 49 million square kilometers (18.9 million square miles). Snow was unusually widespread over the mid-western and eastern United States, eastern Europe, and western China. Snow cover in February remained above average at 47.4 million square kilometers (18.3 million square miles), with more snow than usual in the western and central U.S., eastern Europe, Tibet and northeastern China.

Reduced sea ice extent and extensive snow cover are not contradictory, and are both linked to a strong negative phase of the Arctic Oscillation (see our January 5, 2011 post). A strongly negative AO favors outbreaks of cold Arctic air over northern Europe and the U.S., as many people experienced first-hand these last two winters. Whether this is a trend, or in any way linked to ongoing climate warming in the Arctic, remains to be seen.

Further reading

Stroeve, J.C., J. Maslanik, M.C. Serreze, I. Rigor and W. Meier. 2010. Sea ice response to an extreme negative phase of the Arctic Oscillation during winter 2009/2010. Geophysical Research Letters, doi: 2010GL045662.

For previous analyses, please see the drop-down menu under Archives in the right navigation at the top of this page.


Arctic Oscillation brings record low January extent, unusual mid-latitude weather

Arctic sea ice extent for January 2011 was the lowest in the satellite record for that month. The Arctic oscillation persisted in its strong negative phase for most of the month, keeping ice extent low.
map from space showing sea ice extent, continentsFigure 1. Arctic sea ice extent for January 2011 was 13.55 million square kilometers (5.23 million square miles). The magenta line shows the 1979 to 2000 median extent for that month. The black cross indicates the geographic North Pole. Sea Ice Index data. About the data. —Credit: National Snow and Ice Data Center
High-resolution image


Overview of conditions

Arctic sea ice extent averaged over January 2011 was 13.55 million square kilometers (5.23 million square miles). This was the lowest January ice extent recorded since satellite records began in 1979. It was 50,000 square kilometers (19,300 square miles) below the record low of 13.60 million square kilometers (5.25 million square miles), set in 2006, and 1.27 million square kilometers (490,000 square miles) below the 1979 to 2000 average.

Ice extent in January 2011 remained unusually low in Hudson Bay, Hudson Strait (between southern Baffin Island and Labrador), and Davis Strait (between Baffin Island and Greenland). Normally, these areas freeze over by late November, but this year Hudson Bay did not completely freeze over until mid-January. The Labrador Sea remains largely ice-free.

graph with months on x axis and extent on y axis Figure 2. The graph above shows daily Arctic sea ice extent as of January 31, 2011, along with daily ice extents for previous low-ice-extent years in the month of January. Light blue indicates 2010-2011, green shows 2005-2006 (the record low for the month was in 2006), and dark gray shows the 1979 to 2000 average. The gray area around the average line shows the two standard deviation range of the data. Sea Ice Index data.—Credit: National Snow and Ice Data Center
High-resolution image


Conditions in context

Air temperatures over much of the Arctic were 2 to 6 degrees Celsius (4 to 11 degrees Fahrenheit) above normal in January. Over the eastern Canadian Arctic Archipelago, Baffin Bay/Davis Strait and Labrador Sea, temperatures were at least 6 degrees Celsius (11 degrees Fahrenheit) higher than average. Temperatures were near average over the western Canadian Arctic Archipelago and Scandinavia.

As in December 2010, the warm temperatures in January came from two sources: unfrozen areas of the ocean continued to release heat to the atmosphere, and the wind patterns accompanying the negative phase of the Arctic oscillation brought warm air into the Arctic. Near the end of January the negative Arctic oscillation pattern broke down and turned positive, which usually favors ice growth. It is unclear how long it will remain in a positive mode.

monthly graph
Figure 3. Monthly January ice extent for 1979 to 2011 shows a decline of 3.3% per decade. —Credit: National Snow and Ice Data Center
High-resolution image

January 2011 compared to past years

January 2011 had the lowest ice extent for the month since the beginning of satellite records. The linear rate of decline for the month is –3.3% per decade.

Ice extent for the Arctic as a whole increased at an average of 42,800 square kilometers (16,500 square miles) per day through the month of January, which is about average.

figure 4: masie grraph
Figure 4. This graph shows the ice extent in Hudson Bay from late November to the end of January, for the last five years. This year, Hudson Bay froze up substantially later than in previous years. MASIE data.—Credit: NSIDC /NIC MASIE Product
High-resolution image


Slow regional ice growth

In contrast, regional ice growth has been particularly slow compared to past years. Hudson Bay did not completely freeze up until mid-January, about a month later than normal according to Canadian Ice Service analyses. The Labrador Sea region is still largely free of ice, except in protected bays along the coast. Normally at this time of year, ice extends a few hundred kilometers from the coast all the way from Hudson Strait to Newfoundland.

figure 5: pressure map
Figure 5. These images show high and low atmospheric pressure patterns for January 2011 (left) and the January 1968-1996 average (right). Yellows and reds show higher pressures; blues and purples indicate lower pressures, as indicated by the height of the 850 millibar pressure level above the surface, called the pressure surface. Normally, the pressure surface is nearer to the surface around the pole, winds follow the pressure contours around the pole (the polar vortex), and cold air is trapped in the Arctic. This year, the pressure surface is allowing cold air to spill out of the Arctic into the mid-latitudes. —Credit: NSIDC courtesy NOAA/ESRL PSD
High-resolution image


Potential links with mid-latitude weather

While the Arctic has been warm, cold and stormy weather has affected much of the Northeast U.S. and Europe. Last winter also paired an anomalously warm Arctic with cold and snowy weather for the eastern U.S. and northern Europe. Is there a connection?

Warm conditions in the Arctic and cold conditions in northern Europe and the U.S. are linked to the strong negative mode of the Arctic oscillation. Cold air is denser than warmer air, so it sits closer to the surface. Around the North Pole, this dense cold air causes a circular wind pattern called the polar vortex , which helps keep cold air trapped near the poles. When sea ice has not formed during autumn and winter, heat from the ocean escapes and warms the atmosphere. This may weaken the polar vortex and allow air to spill out of the Arctic and into mid-latitude regions in some years, bringing potentially cold winter weather to lower latitudes.

Some scientists have speculated that more frequent episodes of a negative Arctic Oscillation, and the stormy winters that result, are linked to the loss of sea ice in the Arctic. Dr. James Overland of NOAA Pacific Marine Environmental Laboratory (PMEL) recently noted a link between low sea ice and a weak polar vortex in 2005, 2008, and the past two winters, all years with very low September sea ice extent. Earlier work by Jennifer Francis of Rutgers University and colleagues also suggested a relationship between autumn sea ice levels and mid-latitude winter conditions. Judah Cohen, at Atmospheric and Environmental Research, Inc., and his colleagues propose another idea—a potential relationship between early snowfall in northern Siberia, a negative phase of the Arctic Oscillation, and more extreme winters elsewhere in the Northern Hemisphere. More research on these ideas may shed light on the connections and have the potential to improve seasonal weather forecasting.

Further reading

Francis, J.A., Chan, W-H., Leathers, D.J., Miller, J.R., Veron, D.E., 2009. Winter Northern Hemisphere weather patterns remember summer. Geophys. Res. Lett. 36, L07503, doi:10.1029/2009GL037274.

Overland, J.E., Wang, M-Y., 2010. Large-scale atmospheric circulation changes are associated with the recent loss of Arctic sea ice. Tellus 62A, 1-9.

Cohen, J., J. Foster, M. Barlow, K. Saito, and J. Jones, 2010. Winter 2009-2010: A case study of an extreme Arctic Oscillation event. Geophys. Res. Lett., 37, L17707, doi:10.1029/2010GL044256.

For previous analyses, please see the drop-down menu under Archives in the right navigation at the top of this page.

Repeat of a negative Arctic Oscillation leads to warm Arctic, low sea ice extent

Arctic sea ice extent for December 2010 was the lowest in the satellite record for that month. These low ice conditions are linked to a strong negative phase of the Arctic Oscillation, similar to the situation that dominated the winter of 2009-2010.
map from space showing sea ice extent, continentsFigure 1. Arctic sea ice extent for December 2010 was 12.00 million square kilometers (4.63 million square miles). The magenta line shows the 1979 to 2000 median extent for that month. The black cross indicates the geographic North Pole. Sea Ice Index data. About the data. —Credit: National Snow and Ice Data Center
High-resolution image


Overview of conditions

Arctic sea ice extent averaged over December 2010 was 12.00 million square kilometers (4.63 million square miles). This is the lowest December ice extent recorded in satellite observations from 1979 to 2010, 270,000 square kilometers (104,000 square miles) below the previous record low of 12.27 million square kilometers (4.74 million square miles) set in 2006 and 1.35 million square kilometers (521,000 square miles) below the 1979 to 2000 average.

As in November, ice extent in December 2010 was unusually low in both the Atlantic and Pacific sides of the Arctic, but particularly in Hudson Bay, Hudson Strait (between southern Baffin Island and Labrador), and in Davis Strait (between Baffin Island and Greenland). Normally, these areas are completely frozen over by late November. In the middle of December, ice extent stopped increasing for about a week, an unusual but not unique event.

graph with months on x axis and extent on y axis Figure 2. The graph above shows daily Arctic sea ice extent as of January 2, 2011, along with daily ice extents for previous low-ice-extent years in the month of November. Light blue indicates 2010-2011, pink shows 2006-2007 (the record low for the month was in 2006), green shows 2007-2008, and dark gray shows the 1979 to 2000 average. The gray area around the average line shows the two standard deviation range of the data. Sea Ice Index data.—Credit: National Snow and Ice Data Center
High-resolution image


Conditions in context

The low ice conditions in December occurred in conjunction with above-average air temperatures in regions where ice would normally expand at this time of year. Air temperatures over eastern Siberia were 6 to 10 degrees Celsius (11 to 18 degrees Fahrenheit) above normal in December. Over the eastern Canadian Arctic Archipelago, Baffin Bay/Davis Strait and Hudson Bay, temperatures were at least 6 degrees Celsius (11 degrees Fahrenheit) higher than average. Southern Baffin Island had the largest anomalies, with temperatures over 10 degrees Celsius (18 degrees Fahrenheit) higher than normal. By sharp contrast, temperatures were lower than average (4 to 7 degrees Celsius, 7 to 13 degrees Fahrenheit) over the Alaska-Yukon border, north-central Eurasia, and Scandinavia.

The warm temperatures in December came from two sources: unfrozen areas of the ocean continued to release heat to the atmosphere, and an unusual circulation pattern brought warm air into the Arctic from the south. Although the air temperatures were still below freezing on average, the additional ocean and atmospheric heat slowed ice growth.

monthly graph
Figure 3. Monthly December ice extent for 1979 to 2010 shows a decline of 3.5% per decade. —Credit: National Snow and Ice Data Center
High-resolution image


December 2010 compared to past years

December 2010 had the lowest ice extent for the month since the beginning of satellite records. The linear rate of decline for the month is –3.5% per decade.

figure 4: air temperature map
Figure 4. Air temperatures were higher than normal over Baffin Island, Hudson Bay, and eastern Siberia for the month of December, which was associated with low sea ice extent in those areas. The temperature pattern resulted from a negative phase of the Arctic Oscillation.—Credit: NSIDC courtesy NOAA/ESRL PSD
High-resolution image


Negative phase of the Arctic Oscillation

As in December 2009, a strongly negative phase of the Arctic Oscillation dominated the middle and high latitudes of the Northern Hemisphere in December 2010, bringing higher-than-normal pressures to the Arctic region, with lower-than-normal pressures in middle latitudes. However, unlike 2009, when higher-than normal pressures centered near the central Arctic , in December 2010 higher pressures centered near Iceland and the eastern tip of the Aleutians in the Pacific, and yielded a different pattern of winds. As a result, different areas experienced warm anomalies in 2010, and a different pattern of ice extent emerged.

Our January 5, 2010 post discussed the connection between very warm temperatures over much of the high Arctic in December 2009 and a strongly negative phase of the Arctic Oscillation.

figure 5: year long graph
Figure 5. This full-year graph puts 2010 sea ice extent in context. The gray line shows the 1979 to 2000 climatology, thick blue-gray indicates the 1979 to 2008 (30-year) climatology, dashed green shows 2007, and 2009 is shown in sky blue. Sea Ice Index data.—Credit: National Snow and Ice Data Center
High-resolution image


2010 year in review

Despite a late date of the maximum in winter sea ice extent, the minimum sea ice extent for September 2010 was third lowest in the 1979 to 2010 satellite record, above only 2007 (the record low) and 2008. The late summer of 2010 saw an open Northwest Passage: this year, the deep water channel (the northern route) from M’Clure Strait to Lancaster Sound was navigable. The Northern Sea Route along the Siberian coast also became briefly navigable.

2010 started out with a highly negative phase of the Arctic Oscillation, an atmospheric pattern that in the past has favored the survival of old ice through the winter, and more ice at the end of this summer. But this tendency seems to be changing. A recent study led by Julienne Strove of NSIDC showed that while wind patterns linked with the strongly negative Arctic Oscillation winter of 2009-2010 transported much old ice into the southern Beaufort and Chukchi Seas, most of this ice later melted. It may be that with a warmer Arctic, old rules regarding links between the atmospheric pressure patterns and sea ice extent no longer hold. So far the winter of 2010-2011 has also had a strongly negative Arctic Oscillation, but it is not yet clear how this pattern will affect summer sea ice.

figure 6: antarctic sea ice
Figure 6. The graph of Antarctic sea ice extent as of January 3, 2011. Light blue indicates 2010-2011, dark blue shows 2009-2010, and dark gray shows the 1979 to 2000 average. The gray area around the average line shows the two standard deviation range of the data—Credit: National Snow and Ice Data Center
High-resolution image


A note on Antarctica

While sea ice is growing in the Arctic, it is early summer in the Antarctic and sea ice is melting. For the past four months, Antarctic sea ice extent has remained well above average. The high ice extent around Antarctica appears to relate to a persistently positive phase of the Southern Annular Mode—an Antarctic counterpart to the Arctic Oscillation—and to the mild La Niña conditions in the Pacific. In December 2010, the monthly mean Southern Annular Mode index was lower, and Antarctic sea ice extent had dropped back to within about standard deviation of the mean.

For more information about Antarctic sea ice, see the Frequently Asked Questions section.


Antarctic sea ice data is available on the Sea Ice Index.

New sea ice data

NSIDC has recently released a new sea ice extent product, called the Multisensor Analyzed Sea Ice Extent (MASIE). The MASIE project is a collaborative effort with the U.S. National Ice Center to provide a daily high-resolution sea ice extent estimate based on the NOAA Interactive Mapping System (IMS) product. This new product is considered more accurate for tracking the current position of the ice edge; for climate studies, the passive microwave product (on which Arctic Sea Ice News & Analysis is based) is preferred for a more consistent, long-term average. For more information, read an article about the product at the NSIDC Monthly Highlights Web site.

Further reading

Stammerjohn, S. E., D. G. Martinson, R. C. Smith, X. Yuan, and D. Rind, 2008. Trends in Antarctic annual sea ice retreat and advance and their relation to El Nino — Southern Oscillation and Southern Annular Mode variability. Journal of Geophysical Research, 113, C03S90, doi: 10.1029/2007JC004269.

Stroeve, J.C., J. Maslanik, M. C. Serreze, I. Rigor, W. Meier, and C. Fowler. 2010. Sea ice response to an extreme negative phase of the Arctic Oscillation during winter 2009/2010. Geophysical Research Letters. In Press.

For previous analyses, please see the drop-down menu under Archives in the right navigation at the top of this page.

Slow ice growth leads to low November ice extent

Arctic sea ice grew more slowly than average in November, leading to the second-lowest ice extent for the month. At the end of November, Hudson Bay was still nearly ice-free.

map from space showing sea ice extent, continentsFigure 1. Arctic sea ice extent for November 2010 was 9.89 million square kilometers (3.82 million square miles). The magenta line shows the 1979 to 2000 median extent for that month. The black cross indicates the geographic North Pole. Sea Ice Index data. About the data.
—Credit: National Snow and Ice Data Center
High-resolution image


Overview of conditions

Arctic sea ice extent averaged over November 2010 was 9.89 million square kilometers (3.82 million square miles). This is the second-lowest November ice extent recorded over the period of satellite observations from 1979 to 2010, 50,000 square kilometers (19,300 square miles) above the previous record low of 9.84 million square kilometers (3.80 million square miles) set in 2006.

Ice extent was unusually low in both the Atlantic and Pacific sectors of the Arctic and in Hudson Bay. Typically by the end of November, nearly half of Hudson Bay has iced over. But on November 30, only 17% of the bay was covered by sea ice. Compared to the 1979 to 2000 average, the ice extent was 12.4% below average for the Arctic as a whole.

graph with months on x axis and extent on y axis Figure 2. The graph above shows daily Arctic sea ice extent as of December 4, 2010, along with daily ice extents for previous low-ice-extent years in the month of November. Light blue indicates 2010, pink shows 2006 (the record low for the month) and dark gray shows the 1979 to 2000 average. The gray area around the average line shows the two standard deviation range of the data. Sea Ice Index data.—Credit: National Snow and Ice Data Center
High-resolution image

Conditions in context

As temperatures drop in autumn, open water areas on the Arctic coastal seas quickly refreeze. After this rapid increase in ice extent during October, ice growth slows in November. This November, ice extent over the entire Arctic grew at an average rate of 74,000 square kilometers per day (28,600 miles per day), which is slower than average. However, local weather conditions kept ice extent very low in some locations, contributing to the low extent for the month.

Near-surface air temperatures over the Siberian and Alaskan side of the Arctic were 3 to 5 degrees Celsius (5 to 9 degrees Fahrenheit) warmer than normal in November. Air temperatures over Baffin Bay were also unusually warm (8 degrees Celsius, or 14 degrees Fahrenheit above average). The warm air came from two sources: unfrozen areas of the ocean continued to release heat to the atmosphere; and a circulation pattern brought warm air into the Arctic from the south.

monthly graph
Figure 3. Monthly November ice extent for 1979 to 2010 shows a decline of 4.7% per decade. —Credit: National Snow and Ice Data Center
High-resolution image

November 2010 compared to past years

November 2010 had the second-lowest ice extent for the month since the beginning of satellite records. The linear rate of decline for the month is –4.7 % per decade.

–>figure 4: multiyear ice grpah
Figure 4. Older, thicker multiyear ice cover has decreased since 1992. The solid red line shows the annual multiyear ice loss in the Beaufort Sea. Dashed red shows the cumulative multiyear ice loss in the Beaufort Sea. Black indicates multiyear ice loss through Fram Strait. —Credit: NSIDC courtesy Geophysical Research Letters
High-resolution not available

Loss of multiyear ice

The loss of multiyear ice has contributed to low summer ice extents in recent years, because thinner first-year ice melts out more easily than older, thicker ice. Last summer, multiyear ice that had moved into the Beaufort and Chukchi seas during the previous winter largely melted out (see our October post).

Recent research from scientists at the NASA Jet Propulsion Laboratory shows that summer melt of old, thick ice in the Beaufort Sea has contributed substantially to the overall loss of thick multiyear ice in the Arctic. Using data from the QuikSCAT satellite, researchers Ron Kwok and Glenn Cunningham found that the Beaufort Sea lost 947,000 square kilometers (366,000 square miles) of multiyear ice during the summers of 1993 to 2009.

The study also showed that multiyear ice loss increased in the last few years. From 2005 to 2008, the Beaufort Sea lost 490,000 square kilometers (189,000 square miles) of multiyear ice, 32% of the total loss of multiyear ice in the Arctic Ocean during that time period.

figure 5: seals on sea ice and a satellite map
Figure 5. The top figure shows Pacific walrus on floes within the outlined broken pack southwest of St. Lawrence Island on April 20, 2007. The bottom figure is a MODIS image of the Bering Sea pack at the same time. The red box indicates the location of the walrus groups shown above.—Credit: National Snow and Ice Data Center courtesy top: G. Carleton Ray, bottom: NASA
High-resolution image

Sea ice and ice-dependent animals

Many animals in the Arctic depend on the sea ice cover. A new study by researchers from the University of Virginia and NOAA suggests that seals and walrus rely on certain types of sea ice, called seascapes, for resting and reproduction. The character of these seascapes depends on local and regional weather and ocean conditions, and is changing in conjunction with the long-term downward trend in sea ice extent, cover, and structure.

Researchers G. Carleton Ray, James Overland, and Gary Hufford observed five seal and walrus species from the icebreaker Healy in the Bering Sea. They combined those observations with satellite images of the pack ice to determine the different seascapes that these species prefer. For example, walruses tend to haul out on thicker ice floes, separated by areas of open water, called broken ice. Ribbon and spotted seals instead gather in regions where the ice pack is thin and more dispersed, called loose pack. Understanding how these animals interact with their environments, a field known as landscape ecology, is crucial in this time of fast-changing ice conditions.

Further Reading

Kwok, R. and G. F. Cunningham. 2010. Contribution of melt in the Beaufort Sea to the decline in Arctic multiyear ice coverage: 1993-2009. Geophysical Research Letters, vol. 37. doi:10.1029/2010GL044678.

Ray, G. C., J. E. Overland, G. L. Hufford. 2010. Seascape as an organizing principle for evaluating walrus and seal sea ice habitat in Beringia. Geophysical Research Letters, vol. 37. doi:10.1029/2010GL044452.

Stroeve, J.C., J. Maslanik, M. C. Serreze, I. Rigor, W. Meier, and C. Fowler. 2010. Sea ice response to an extreme negative phase of the Arctic Oscillation during winter 2009/2010. Geophysical Research Letters. In Press.

For previous analyses, please see the drop-down menu under Archives in the right navigation at the top of this page.

Arctic ice extent remains low despite rapid growth

After reaching its minimum extent on September 19, Arctic sea ice grew rapidly through the first half of October before slowing down late in the month. Even with that rapid growth, ice extent for October was the third lowest for that month in the satellite record. Air temperatures in the Arctic were higher than normal.

map from space showing sea ice extent, continentsFigure 1. Arctic sea ice extent for October 2010 was 7.69 million square kilometers (2.97 million square miles). The magenta line shows the 1979 to 2000 median extent for that month. The black cross indicates the geographic North Pole. Sea Ice Index data. About the data. —Credit: National Snow and Ice Data Center
High-resolution image


Overview of conditions

Sea ice extent averaged over October 2010 was the third lowest over the satellite data record at 7.69 million square kilometers (2.97 million square miles). This was 1.60 million square kilometers (618,000 square miles) below the 1979 to 2000 average for October, but 920,000 square kilometers (355,000 square miles) above the record low for the month, which occurred in October 2007.

graph with months on x axis and extent on y axis Figure 2. The graph above shows daily Arctic sea ice extent as of November 1, 2010, along with daily ice extents for years with the previous four lowest minimum extents. Light blue indicates 2010, dark blue shows 2009, purple shows 2008, dotted green indicates 2007, and dark gray shows the 1979 to 2000 average. The gray area around the average line shows the two standard deviation range of the data. Sea Ice Index data.—Credit: National Snow and Ice Data Center
High-resolution image

Conditions in context

Following the minimum ice extent on September 19, the ice cover quickly expanded as polar darkness returned to the Arctic and air temperatures dropped. Ice grew at an average daily rate for the month of October of 92,700 kilometers per day (35,800 square miles per day). This was similar to the growth rate in 2009, but slower than the growth rate following the 2007 and 2008 minimum ice extents. It was slightly faster than the 1979 to 2000 average rate of 82,200 square kilometers (31,700 square miles) per day.

At the end of October, ice growth slowed, and at the end of the month extensive open water areas remained in the Beaufort, Chukchi, Kara and Barents seas. This region had the warmest ocean surface temperatures at the end of the melt season.

monthly graph
Figure 3. Monthly October ice extent for 1979 to 2010 shows a decline of 6.2% per decade. —Credit: National Snow and Ice Data Center
High-resolution image

October 2010 compared to past years

Even with the rapid ice growth at the beginning of the month, October 2010 had the third-lowest ice extent for the month in the satellite record. The linear trend for October steepened slightly from -5.9% per decade to -6.2% per decade.

figure 4: air temperature fields for Oct 2010
Figure 4. This map of Arctic air temperature anomalies shows warmer-than-usual conditions over much of the Arctic Ocean through the month of October.—Credit: NSIDC courtesy NOAA/ESRL PSD
High-resolution image

Warm air temperatures

While air temperatures were below freezing over much of the Arctic in October, they were 4 to 6 degrees Celsius (7 to 10 degrees Fahrenheit) higher than normal. The warm conditions resulted partly from regions of open water releasing heat to the atmosphere, and in part from an atmospheric circulation pattern that brought warm air from lower latitudes to the Arctic.

As noted in previous posts, open water in summer absorbs heat from the sun that would normally be reflected back to space by the bright sea ice cover. In order for the ocean to refreeze in autumn, it must first release the heat accumulated during summer in these open water areas to the atmosphere. While the unusually warm temperatures tend to be focused over areas of open water, winds can move this heat around, warming other regions of the Arctic.

figure 5: slp fields of the arctic
Figure 5. The map of sea level pressure for October 1 to 30, 2010, shows a high-pressure system cenetered over the Beaufort and Chukchi sea and Greenland, and low pressure over the Kara and Barents seas. This pattern tends to bring warm air from lower latitudes into the Arctic.—Credit: National Snow and Ice Data Center courtesy NOAA/ESRL PSD
High-resolution image

Arctic circulation and mid-latitude weather

In addition to the effects from open water, weather patterns also contributed to warm conditions in some areas. For most of October, a high-pressure system sat over the Beaufort and Chukchi seas and Greenland, while unusually low pressure dominated the Kara and Barents seas. This pattern resembles the atmospheric pattern observed in October 2009, bringing warm air from lower latitudes to warm the Arctic.

The warming effects of open water, caused by the loss of summer sea ice cover, could add another twist to the warmer Arctic weather trends lately seen in the Arctic. NOAA researcher James Overland recently noted connections between warmer air temperatures in the lower Arctic atmosphere and atmospheric circulation at lower latitudes, in the 2010 NOAA Arctic Report Card.

Further Reading

Screen, J.A. and I. Simmonds, 2010. The central role of diminishing sea ice in recent Arctic temperature amplification. Nature, 464, 1334-1337. doi:10.1038/nature09051. (subscription required)

Serreze, M. C., Barrett, A. P., Stroeve, J. C., Kindig, D. N. & Holland, M. M., 2009. The emergence of surface-based Arctic amplification. Cryosphere 3, 11–19. doi:10.5194/tc-3-11-2009

For previous analyses, please see the drop-down menu under Archives in the right navigation at the top of this page.

End of summer approaches for Arctic sea ice

Arctic sea ice generally reaches its annual minimumextent in mid-September. This August, ice extent was the second lowest in the satellite record, after 2007. On September 3, ice extent dropped below the seasonal minimum for 2009 to become the third lowest in the satellite record.

The Northwest Passage and the Northern Sea Route are largely free of ice, allowing the potential for a circumnavigation of the Arctic Ocean. At least two expeditions are attempting this feat, the Norwegian explorer Borge Ousland and the Peter I yacht from Russia.

map from space showing sea ice extent, continentsFigure 1. Arctic sea ice extent for August 2010 was 5.98 million square kilometers (2.31 million square miles). The magenta line shows the 1979 to 2000 median extent for that month. The black cross indicates the geographic North Pole. Sea Ice Index data. About the data. —Credit: National Snow and Ice Data Center
High-resolution image

Overview of conditions

Average ice extent for August was 5.98 million square kilometers (2.31 million square miles), 1.69 million square kilometers (653,000 square miles) below the 1979 to 2000 average, but 620,000 square kilometers (240,000 square miles) above the average for August 2007, the lowest August in the satellite record. Ice extent remained below the 1979 to 2000 average everywhere except in the East Greenland Sea near Svalbard.

The minimum ice extent for the year will probably occur in the next two weeks. NSIDC scientists are closely monitoring conditions and will report the minimum when it occurs.

graph with months on x axis and extent on y axis Figure 2. The graph above shows daily Arctic sea ice extent as of September 6, 2010, along with daily ice extents for years wtih the four lowest minimum extents. The solid light blue line indicates 2010; orange shows 2009, pink shows 2008; dashed green shows 2007; light green shows 2005; and solid gray indicates average extent from 1979 to 2000. The gray area around the average line shows the two standard deviation range of the data. Sea Ice Index data.—Credit: National Snow and Ice Data Center
High-resolution image

Conditions in context

At the end of August, ice extent had fallen to the fourth lowest in the satellite record, behind the seasonal minima recorded for 2007, 2008, and 2009. On September 3, ice extent fell below the seasonal minimum for 2009 to claim third lowest on record, with perhaps one to two weeks left in the melt season.

The daily rate of decline for August was 55,000 square kilometers (21,000 square miles) per day, close to the 1979 to 2000 average of 54,000 square kilometers (21,000 square miles).

monthly graph
Figure 3. Monthly August ice extent for 1979 to 2010 shows a decline of 8.9% per decade. —Credit: National Snow and Ice Data Center
High-resolution image

August 2010 compared to past years

Ice extent for August 2010 was the second lowest in the satellite record for the month. The linear rate of decline of August ice extent over the period 1979 to 2010 is now 8.9% per decade.

figure 4: ice concentration
Figure 4. This map of sea level pressure for August 2010 shows a return of the dipole anomaly, which was present in June but not in July.—Credit: NSIDC courtesy NOAA/ESRL PSD
High-resolution image

Return of the dipole anomaly

In August, a pattern of higher than average pressure over the northern Beaufort Sea and lower than average pressure over the Siberian side of the Arctic replaced the stormy and cool weather conditions that persisted through July. This atmospheric pattern, known as the dipole anomaly, brought relatively warm southerly winds into the Beaufort and Chukchi seas, where air temperatures were 1 to 3 degrees Celsius (1.8 to 5.4 degrees Fahrenheit) above normal for the month of August. The warmth enhanced melt in the region, and southerly winds contributed to ice loss by pushing the ice edge northward. This pattern is similar to the pattern at the end of the 2007 melt season, but not as pronounced. Air temperatures this August were also 1 to 3 degrees Celsius (1.8 to 5.4 degrees Fahrenheit) below normal over the Barents and Kara Seas.

figure 4: ice concentration
Figure 5. This image from NASA’s MODIS sensor on the Aqua satellite on August 25, 2010, shows open water and low-concentration ice in the Beaufort Sea, the region where large amounts of rotten ice were observed last year.—Credit: National Snow and Ice Data Center courtesy NASA/GSFC MODIS Rapid Response
High-resolution image

Rotten ice in the Beaufort and Chukchi seas

Last year, Dave Barber, a researcher from the University of Manitoba, reported unusual conditions in the Beaufort Sea with large regions of rotten ice. Satellite imagery from the NASA Moderate Resolution Imaging Spectroradiometer (MODIS) and Advanced Microwave Scanning Radiometer – Earth Observing System (AMSR-E) sensors suggest similar conditions this year in the Beaufort and Chukchi seas, where there are large areas with unconsolidated ice floes and low ice concentration.

figure 6: ice concentration
Figure 6. This graph of regional ice loss in the Arctic shows faster than normal ice loss in the Beaufort and Chukchi seas, and slower than normal ice loss in the East Siberian Sea and Central Arctic. The map in the bottom left corresponds to the regions plotted across the top of the graph. Colors in the bar graph correspond to August ice loss in different years.—Credit: National Snow and Ice Data Center
High-resolution image

Regional ice loss

The rate of ice loss in the summer varies from region to region depending on local air and ocean temperatures and wind patterns. This August, the decline in ice extent was unusually fast in the Beaufort and Chukchi Sea, likely because of the rotten ice that melted out completely. In addition, southerly winds linked to the dipole anomaly pattern brought warmer air into the region and helped push the ice edge northward.

However, the loss rate in the East Siberian Sea and the Central Arctic was slower than any of the past three years, and was also fairly slow (slower than the 1979 to 2000 average rate) in the Laptev and Kara Seas. The reason for slow ice loss in the Kara Sea, however, is that there was already very little ice in that region at the beginning of August. Such year-to-year variations demonstrate the importance of weather conditions in determining regional ice loss.

Further Reading

Barber, D. G., Galley, R., Asplin, M. G., De Abreau, R., K. A. Warner, M. Pucko, M. Gupta, S. Prinsenberg, and S. Julien, 2009: Perennial pack ice in the southern Beaufort Sea was not as it appeared in the summer of 2009, Geophysical Research Letters, 36, L24501, doi:10.1029/2009GL041434.

For previous analyses, please see the drop-down menu under Archives in the right navigation at the top of this page.

North by Northwest

The end of summer is approaching in the Arctic; temperatures are dropping and melt is ending in the high latitudes. Yet summer is not quite over in the lower latitudes of the Arctic Ocean, where sea ice extent continues to decline. Sea ice has melted out extensively in the northern route of the Northwest Passage, but the passage is not completely open.

Meanwhile, in the Antarctic, sea ice extent continues to be well above normal, largely because of atmospheric circulation patterns set up by a high Antarctic Oscillation mode.

map from space showing sea ice extent, continentsFigure 1. Daily Arctic sea ice extent on August 16 was 5.95 million square kilometers (2.30 million square miles). The orange line shows the 1979 to 2000 median extent for that day. The black cross indicates the geographic North Pole. Sea Ice Index data. About the data. —Credit: National Snow and Ice Data Center
High-resolution image

Overview of conditions

As of August 16, 2010, Arctic ice extent was 5.95 million square kilometers (2.30 million square miles),1.68 million square kilometers (649,000 square miles) below the 1979 to 2000 average.

graph with months on x axis and extent on y axis Figure 2. The graph above shows daily Arctic sea ice extent as of August 16, 2010. The solid light blue line indicates 2010; dashed green shows 2007; solid pink shows 2008; solid orange shows 2009; and solid gray indicates average extent from 1979 to 2000. The gray area around the average line shows the two standard deviation range of the data. Sea Ice Index data.—Credit: National Snow and Ice Data Center
High-resolution image

Conditions in context

As of August 16, only 2007 and 2008 had lower extent. Approximately one month remains in the melt season.

High pressure has moved in over the central Arctic Ocean, replacing stormier, lower-pressure conditions that persisted during July. Paired with lower pressure on the Siberian side, this pattern generates winds that push the ice northward and reduce the total ice extent, especially since much of the ice pack is spread out.

map showing nw passage and current ice conditions
Figure 3. Top: This image, from the Canadian Space Agency’s RADARSAT-2 satellite, shows the northern route of the Northwest Passage this August; although the passage is not completely open, sea ice cover is light. Bright, circular and other sharply defined shapes are sea ice; dark grey indicates calm ocean; white smudged regions are areas of ocean that have been roughened by winds. Bottom: The graph of ice area in the northern route of the Northwest Passage shows that ice retreated earlier than normal. The blue line tracks the area of sea ice for 2010, compared to average and to previous low ice years.—Credit: NSIDC courtesy Howell, Agnew, Wohlleben, and the Canadian Ice Service
High-resolution image

Early clearing in the Northwest Passage

Stephen Howell, Tom Agnew, and Trudy Wohlleben from Environment Canada report that sea ice conditions in the Northwest Passage are very light. Ice is still present at the mouth of the M’Clure Strait, in central Viscount-Melville Sound, and in Larsen Sound, as of early August. As a result, neither the northern route (Western Parry Channel) nor the southern route (Amundsen’s Passage) through the Northwest Passage are completely clear of ice. Sea ice area within the northern route is currently well below the 1968 to 2000 average and almost a month ahead of the clearing that was observed in 2007, according to ice chart data from the Canadian Ice Service. In the southern route, there is still a substantial amount of ice.

This year’s early clearing of sea ice probably resulted from record warm temperatures this past spring over the Western Canadian Arctic, as well as the decline in older, multiyear ice in the channel over recent years. Spring 2010 was the warmest in the region since 1948: some regions of the Western Canadian Arctic were more than 6°C (11°F) above normal. These warm conditions helped break the ice up early in the northern route. If winds push sea ice away from the entrance to M’Clure Strait, the northern route of the Northwest Passage could open completely this year. However, even scattered sea ice remains a significant threat to navigation.

figure 4: ice concentration
Figure 4. This map shows ice concentration on August 16, 2010, from the NASA AMSR-E sensor on the Aqua satellite. Lines mark two well-known routes through the Northwest Passage: Amundsen’s route is yellow, and the northern route is red.—Credit: NSIDC courtesy University of Bremen IUP
High-resolution image

History of the Northwest Passage

Conditions in the Northwest Passage are quite variable and do not necessarily reflect overall conditions in the Arctic. However, today’s conditions in the Northwest Passage would likely astonish 19th century explorers such as McClure, Franklin, and Amundsen. In upcoming decades, the passage will be increasingly likely to open during summer.

Last month, Canadian investigators located the wreckage of the HMS Investigator, which sank on an expedition led by Captain Robert McClure in the 1850s. The McClure expedition had set out to rescue the Franklin Expedition, which had gone missing after leaving Baffin Bay for the Northwest Passage in 1845. McClure attempted to enter the passage from the west through what is now called M’Clure Strait, but quickly became trapped in the ice. They remained trapped through two winters before being rescued by another ship. The Franklin Expedition was not so fortunate: all 128 men perished. It was another fifty years before Norwegian Roald Amundsen and a small crew successfully navigated the passage. Their trek, by the southern route, took over two years.

figure 4: ice concentration
Figure 5. This image shows melt onset anomalies in the Arctic Ocean for 2010, compared to the 1979 to 2000 average. Green, red, and yellow indicate areas of earlier melt onset, while blue and violet show regions of later melt onset. White and black indicate regions with no data.—Credit: NSIDC courtesy Thorsten Markus, NASA GSFC/data from DMSP SSM/I and NASA AMSR-E
High-resolution image

Melt onset

Despite a late spurt in ice growth this past winter, air temperatures remained higher than normal during spring and early summer, leading to an early melt onset over parts of the Arctic Ocean, though onset was later in other areas. Compared to the 1979 to 2000 average onset date, melt began one to two weeks earlier in the eastern Arctic. The central Arctic melt onset date was about average. In contrast, melt started about a week later than average in the western Arctic, including the Beaufort, Chukchi and East Siberian seas, and in the Bering Sea, one of the regions that experienced a surge in ice growth late in the winter.

Recent work by Thorsten Markus at NASA Goddard Space Flight Center shows that date of melt onset got steadily earlier from 1979 to 2008, in all regions of the Arctic except for the Sea of Okhotsk. Although this year showed some areas of later melt onset, compared to normal, the overall trend remains towards earlier melt. The largest trend is in the Barents Sea, where ice melt has begun about seven days earlier each decade since 1979.

Further Reading

Parks Canada 2010 Arctic Surveys: HMS Investigator and McClure’s Cache

Environment Canada

Canadian Ice Service

References

Markus, T., J. C. Stroeve, and J. Miller. 2009. Recent changes in Arctic sea ice melt onset, freeze-up, and melt season length, J. Geophys. Res., doi:10.1029/2009JC005436.

For previous analyses, please see the drop-down menu under Archives in the right navigation at the top of this page.

July sea ice second lowest: oldest ice begins to melt

Arctic sea ice extent averaged for July was the second lowest in the satellite record, after 2007. After a slowdown in the rate of ice loss, the old, thick ice that moved into the southern Beaufort Sea last winter is beginning to melt out.
map from space showing sea ice extent, continentsFigure 1. Arctic sea ice extent for July 2010 was 8.39 million square kilometers (3.24 million square miles). The magenta line shows the 1979 to 2000 median extent for that month. The black cross indicates the geographic North Pole. Sea Ice Index data. About the data. —Credit: National Snow and Ice Data Center
High-resolution image

Overview of conditions

Average ice extent for July was 8.39 million square kilometers (3.24 million square miles), 1.71 million square kilometers (660,000 square miles) below the 1979 to 2000 mean, but 260,000 square kilometers (100,000 square miles) above the average for July 2007, the lowest July in the thirty-two-year satellite record.

Stormy, cloudy, and relatively cool weather persisted through the month, which helped slow the rate of ice loss. The daily rate of decline for July was 77,000 square kilometers (29,700 square miles) per day, close to the 1979 to 2000 average of 84,400 square kilometers (32,600 square miles).

graph with months on x axis and extent on y axis Figure 2. The graph above shows daily Arctic sea ice extent as of August 3, 2010. The solid light blue line indicates 2010; dashed green shows 2007; solid pink shows 2006, and solid gray indicates average extent from 1979 to 2000. The gray area around the average line shows the two standard deviation range of the data. Sea Ice Index data.—Credit: National Snow and Ice Data Center
High-resolution image

Conditions in context

Cool, stormy weather this July has made it less likely that the upcoming 2010 sea ice minimum will set a new record. It would take a very unusual set of conditions in August to create a new record low.

If the daily rate of decline this August follows the average August rate of decline for 1979 to 2000, the daily sea ice minimum in September would be 5.00 million square kilometers (1.93 million square miles), considerably higher than the record minimum of 4.13 million square kilometers (1.59 million square miles) observed for September 16, 2007. A daily rate of decline identical to 2007 would yield a September minimum of 4.43 million square kilometers (1.71 million square miles); while daily decline rates similar to 2008 (the largest ever observed for August), would yield a September minimum of 4.08 million square kilometers (1.58 million square miles). If the daily rate of decline is similar to 2006, the slowest in recent years, the minimum would be 5.27 million square kilometers (2.03 million square miles).

sea level pressure
Figure 3. Monthly July ice extent for 1979 to 2010 shows a decline of 6.4% per decade. —Credit: National Snow and Ice Data Center
High-resolution image

July 2010 compared to past years

Ice extent for July 2010 was the second lowest in the satellite record for the month. The linear rate of decline of July ice extent over the period 1979 to 2010 is now 6.4% per decade.

figure 4: ice concentration
Figure 4. This map of ice age for the end of July, 2010, shows a region of open water north of Alaska, where old, thick ice has melted out. —Credit: NSIDC courtesy J. Maslanik and C. Fowler, CU Boulder
High-resolution image

Older, thicker ice melting in the southern Beaufort Sea

This past winter’s negative phase of the Arctic Oscillation transported old ice (four, five, and more years old) from an area north of the Canadian Archipelago. The ice was flushed southwards and westward into the Beaufort and Chukchi seas, as noted in our April post. Ice age data show that back in the 1970s and 1980s, old ice drifting into the Beaufort Sea would generally survive the summer melt season. However, the old, thick ice that moved into this region is now beginning to melt out, which could further deplete the Arctic’s remaining store of old, thick ice. The loss of thick ice has been implicated as a major cause of the very low September sea ice minima observed in recent years.

figure 4: ice concentration
Figure 5. This image from NASA’s MODIS sensor on the Aqua satellite on July 25, 2010 shows an individual floe of old ice, which broke away from the main ice pack and is melting away.—Credit: National Snow and Ice Data Center courtesy NASA/GSFC MODIS Rapid Response
High-resolution image

High-resolution images from MODIS

High-resolution (250-meter) visible imagery from the NASA Moderate Resolution Imaging Spectroradiometer (MODIS) sensor vividly shows the loss of the old, thick ice. A region of mostly old ice has become separated from the main pack along the north coast of Alaska, east of Point Barrow, where it has begun to melt in the warm shallow shelf waters. While cloud cover obscures some areas, it is clear that the old ice floe has broken up into many smaller floes. Whether this old ice will completely melt out by the end of summer will depend to some extent on weather conditions. However, smaller floes melt more easily than consolidated ice. This behavior is becoming more typical of the ice pack as the ice thins.

Further Reading

The Study of Environmental Change has released their September Sea Ice Outlook: July Report.

For previous analyses, please see the drop-down menu under Archives in the right navigation at the top of this page.