Sea ice loss during the first half of August stalled, though ice in the Beaufort Sea is finally starting to weaken. The Northern Sea Route appears closed off in 2021, despite being open each summer since 2008.
Overview of conditions
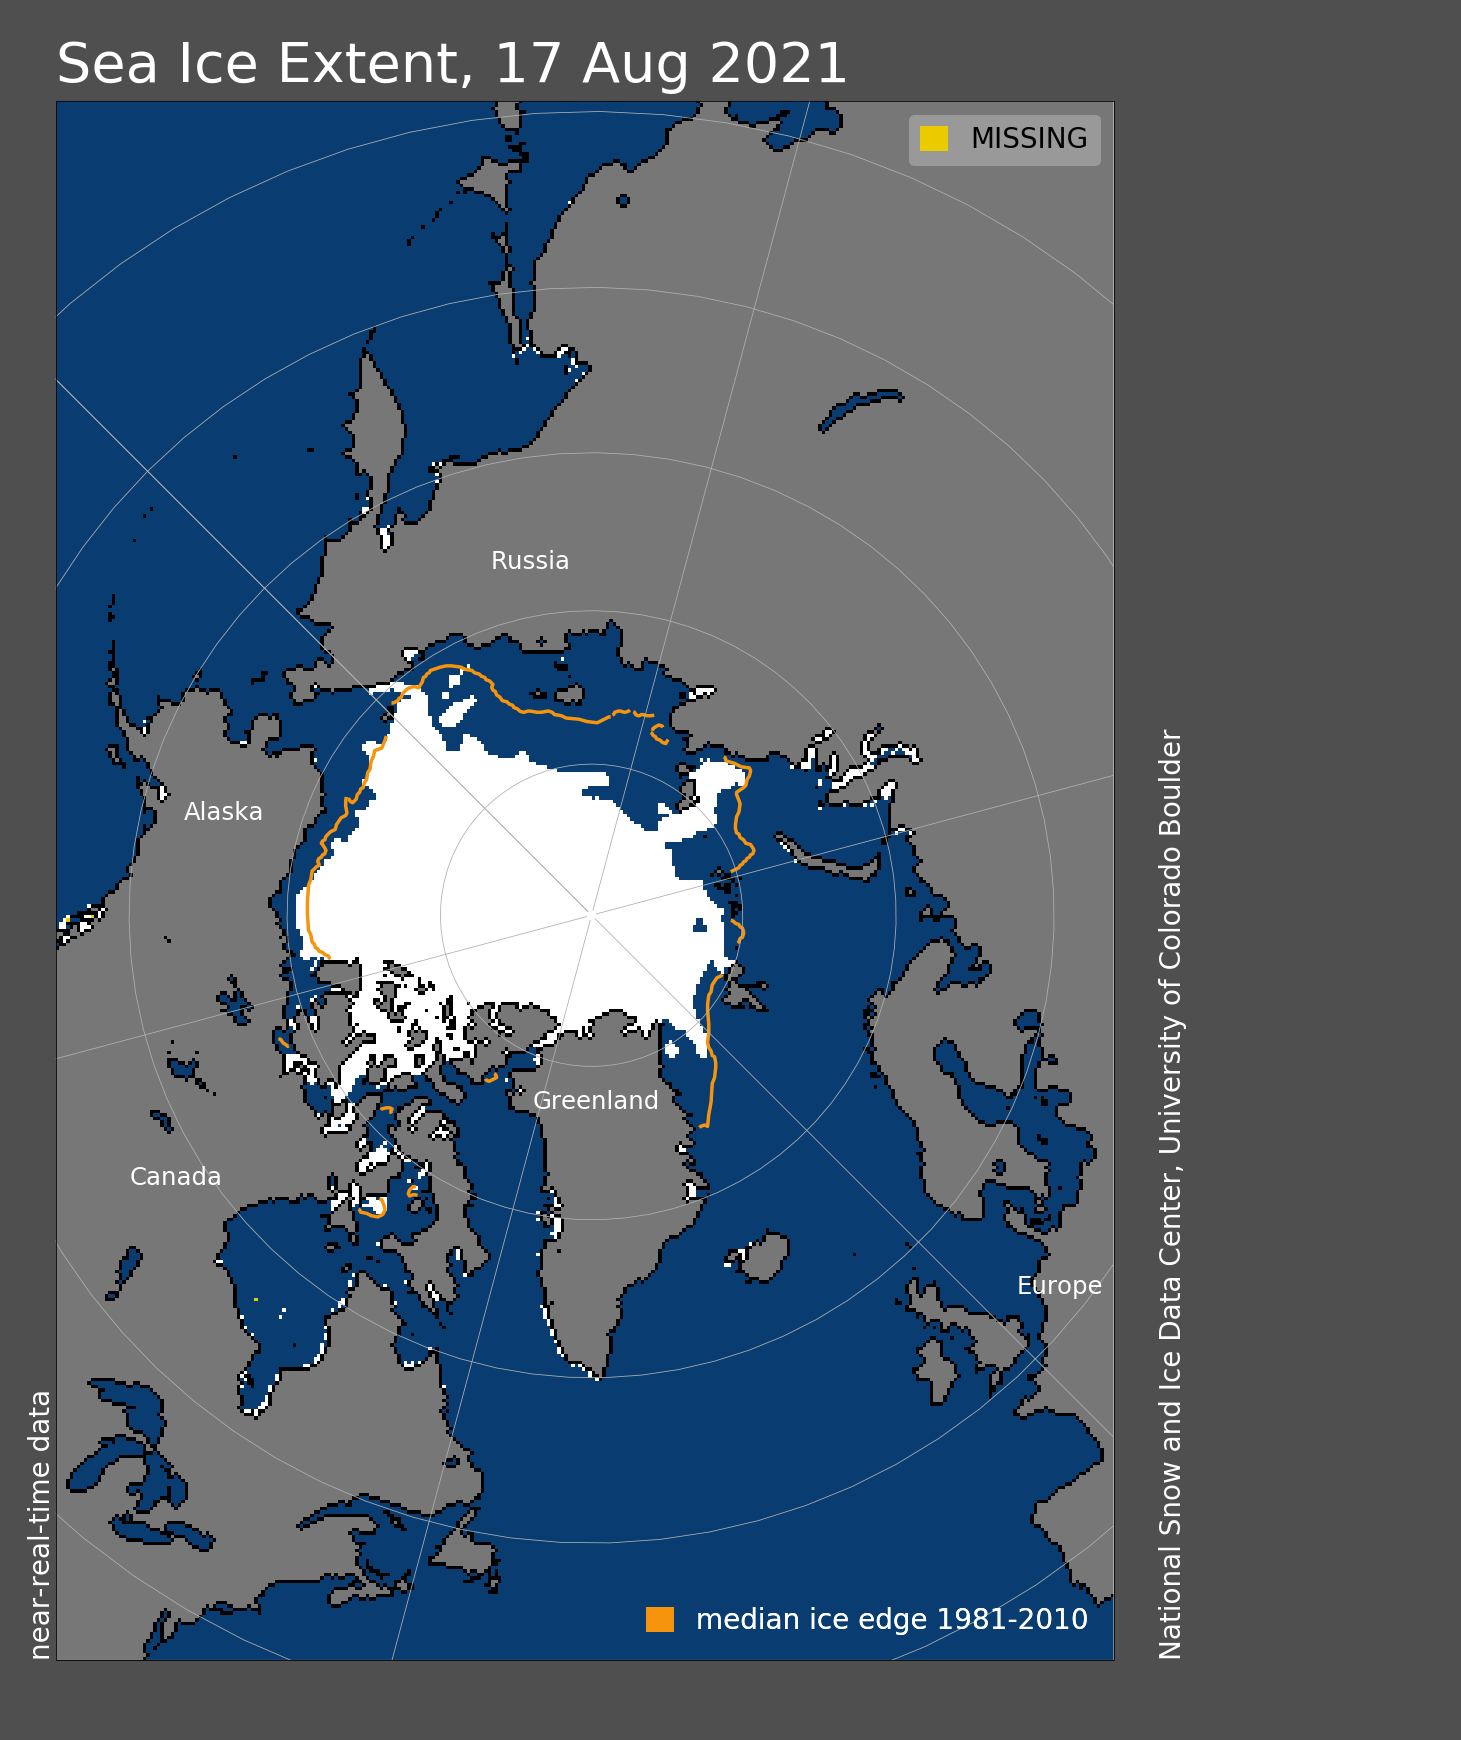
Figure 1a. Arctic sea ice extent for August 17, 2021 was 5.77 million square kilometers (2.23 million square miles). The orange line shows the 1981 to 2010 average extent for that day. Sea Ice Index data. About the data
Credit: National Snow and Ice Data Center
High-resolution image
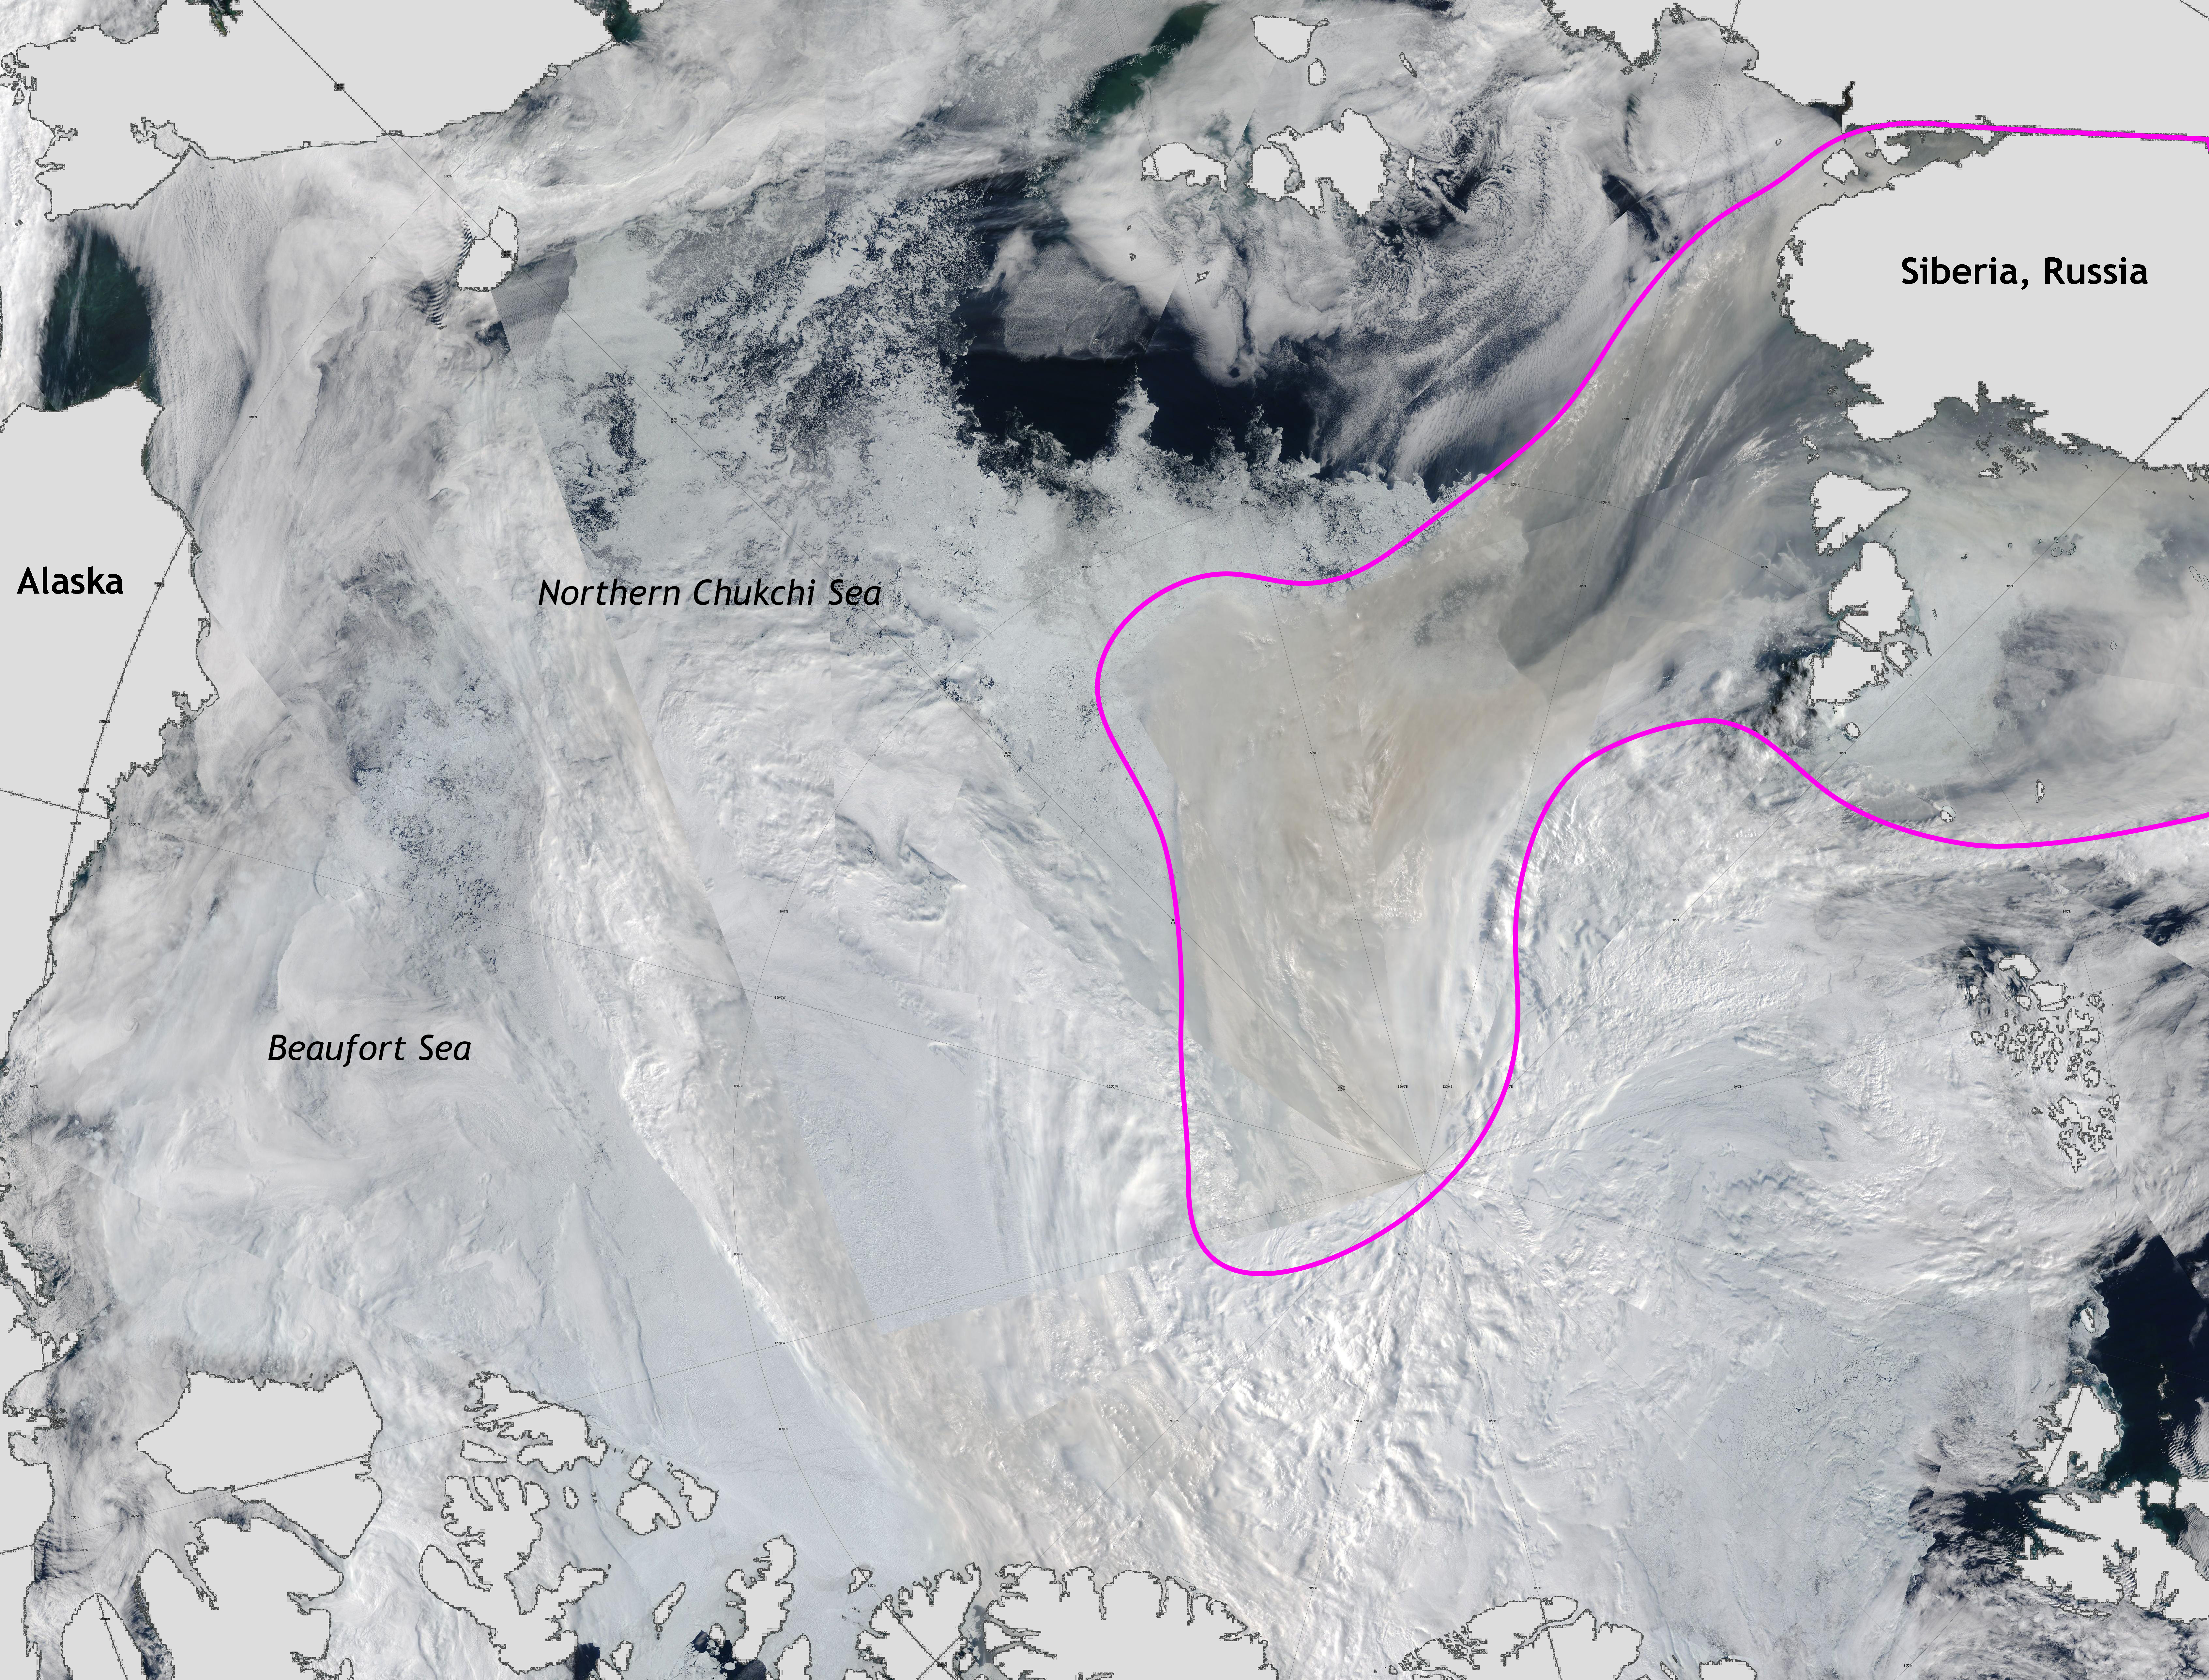
Figure 1b. This satellite image of the Arctic Ocean on August 8, 2021, shows sea ice break up in the Northern Chukchi and Beaufort Seas. The magenta outline depicts smoke from Siberian fires moving over Arctic sea ice. The Moderate Resolution Imaging Spectroradiometer (MODIS) on board NASA’s Terra and Aqua satellites took this image.
Credit: National Snow and Ice Data Center/NASA Worldview
High-image resolution
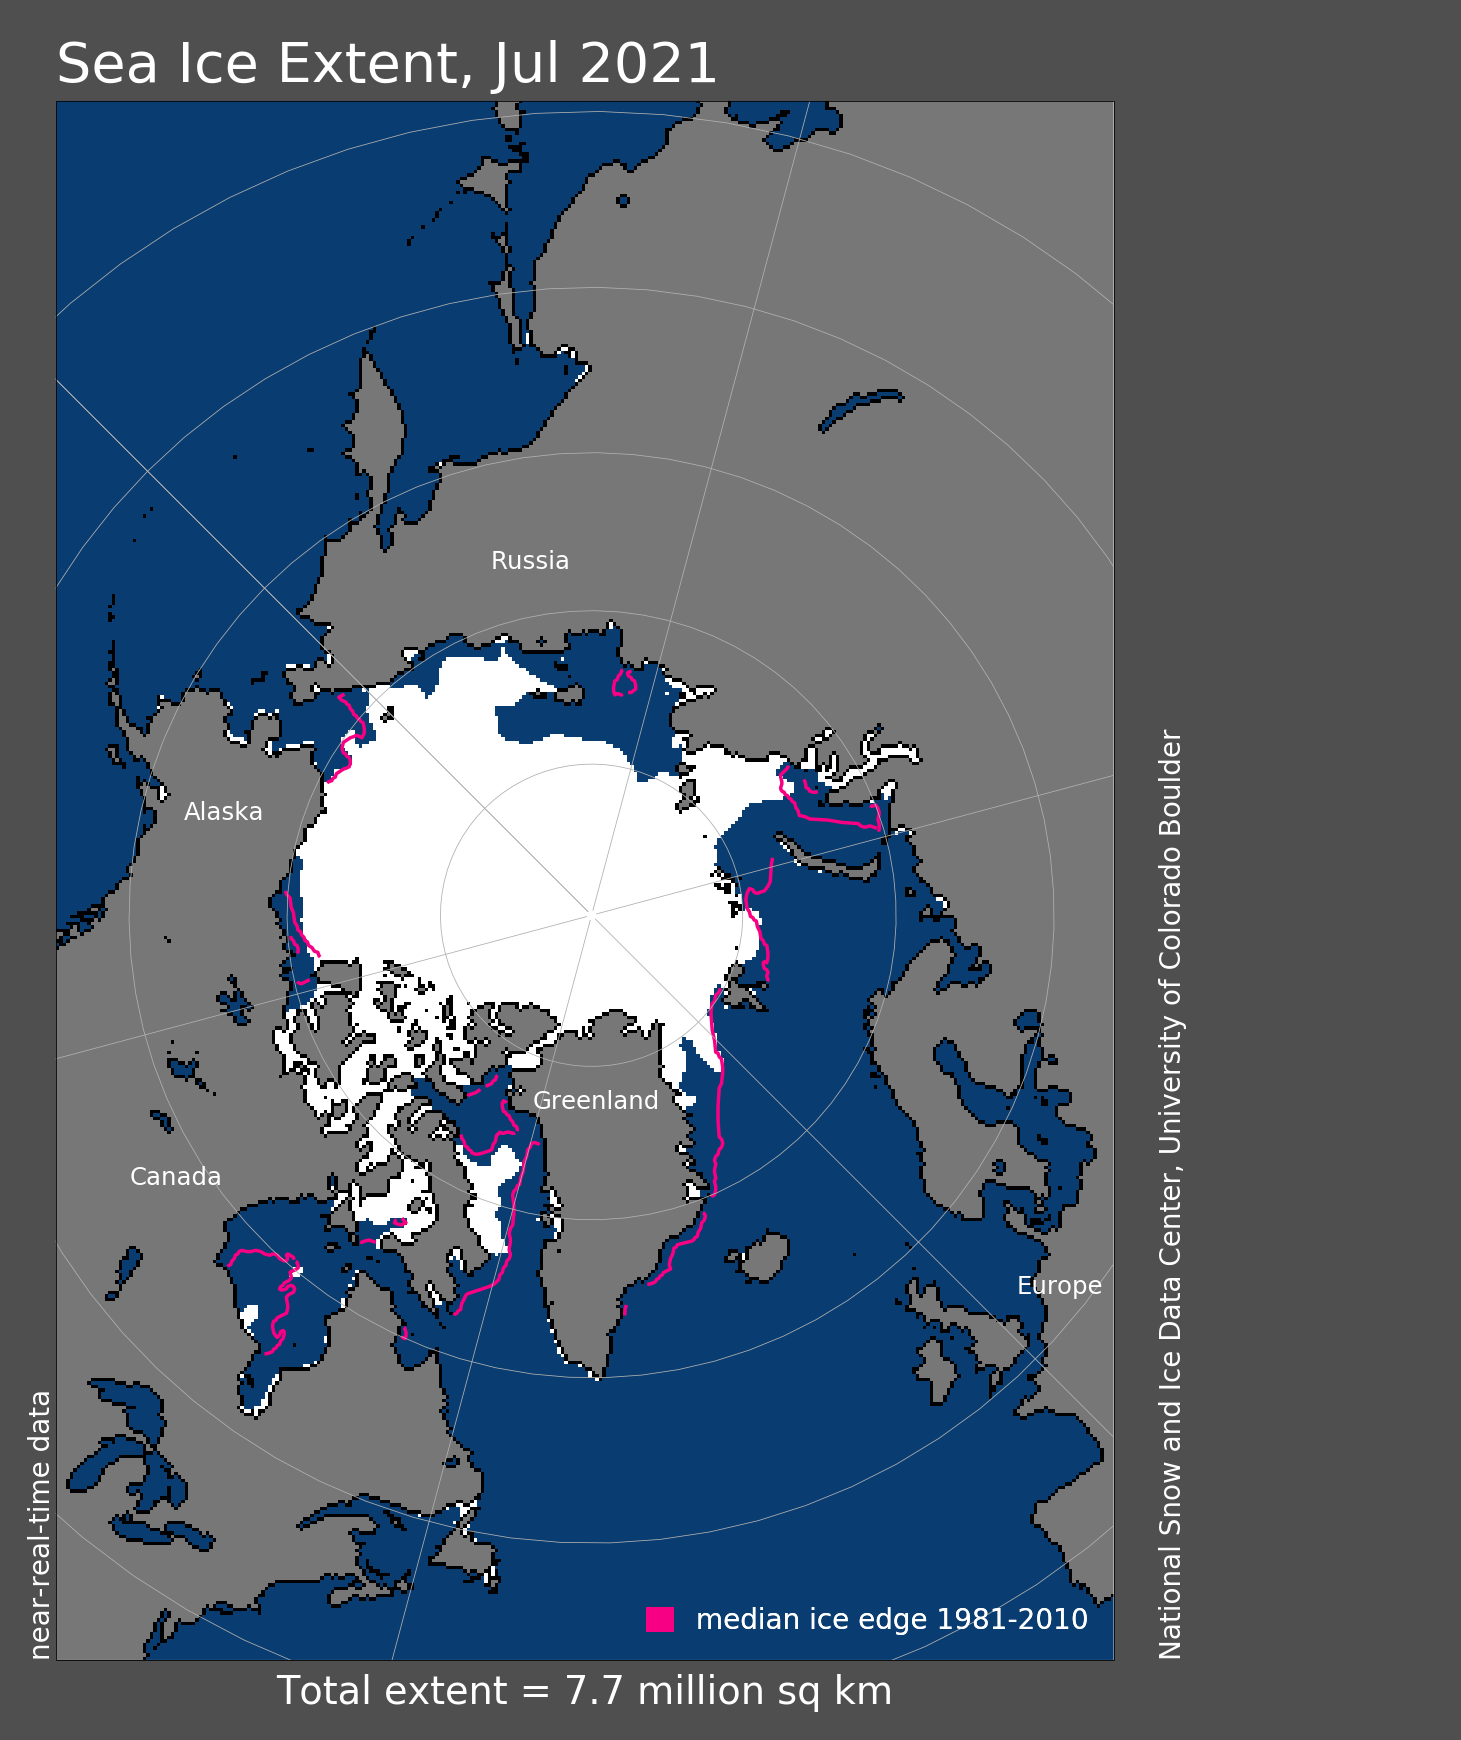
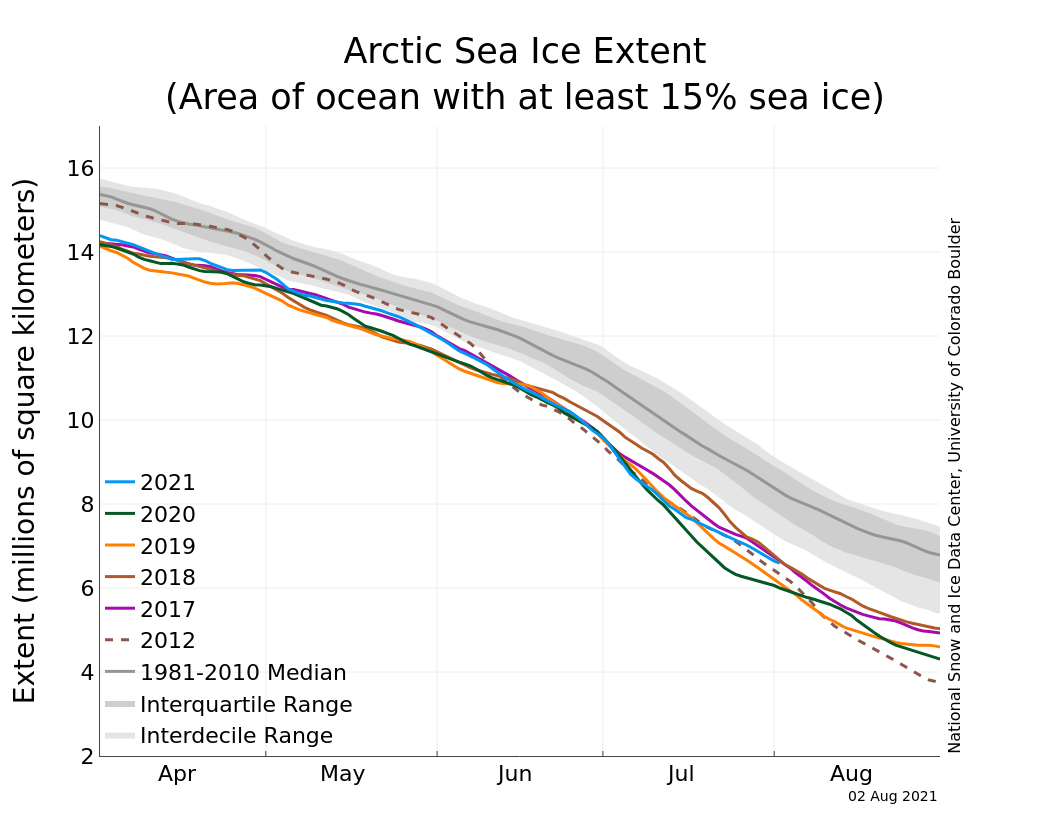
As of August 17, sea ice extent stood at 5.77 million square kilometers (2.23 million square miles), tracking above the last six years, as well as 2011, 2012, and 2007 (Figure 1a). Sea ice loss stalled between August 8 and 11 before picking up the pace again. While overall decline in total ice extent has slowed, the ice cover is becoming more diffuse within the northern Chukchi Sea and the western Beaufort Sea. Further reductions are likely in that region (Figure 1b). Ice motion during the first week of August pushed sea ice in the Beaufort Sea southwards, and ice within the Chukchi Sea moved towards the East Siberian Sea. While sea ice in the western Arctic has been more extensive than in recent summers, the Laptev Sea has lost more sea ice thus far than at any other time in the satellite record. However, ice remains south of Severnaya Zemlya in the Kara Sea, blocking the Northern Sea Route. Further south in the East Greenland Sea, there is only 119,000 square kilometers (45,900 square miles) of sea ice, the second least amount of ice for this time of year following 2002.
Conditions in context
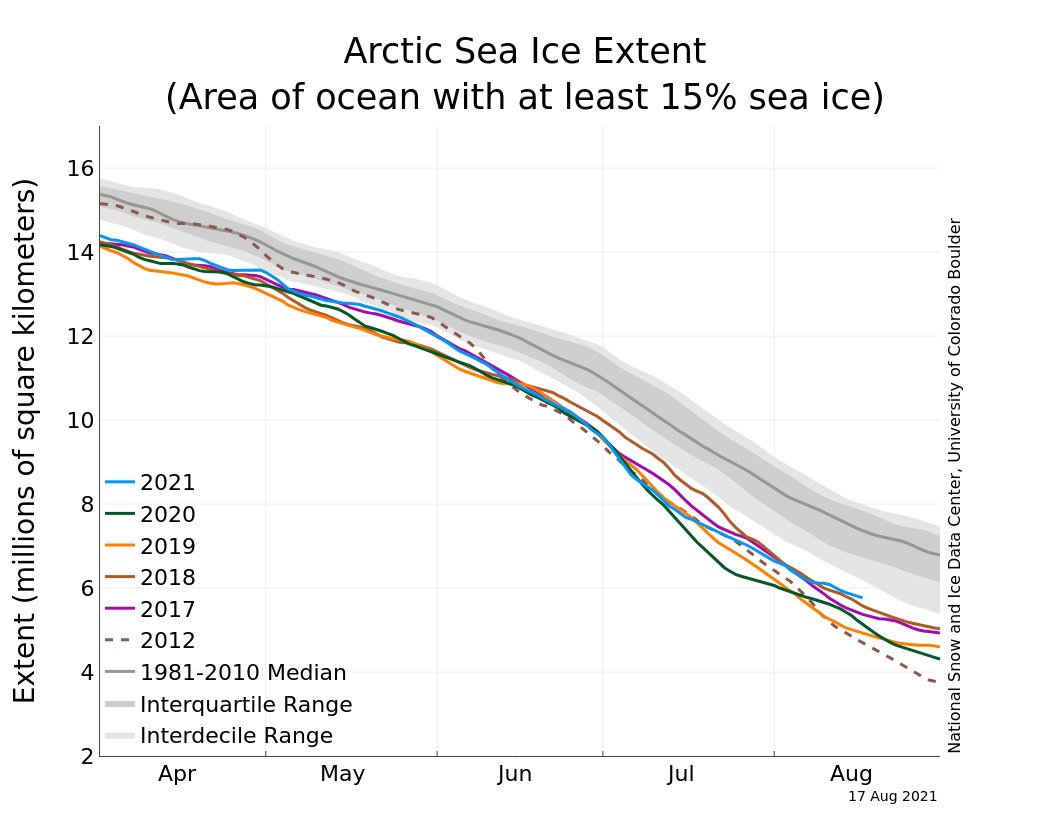
Figure 2a. Arctic sea ice extent for August 17, 2021 was 5.77 million square kilometers (2.23 million square miles). The orange line shows the 1981 to 2010 average extent for that day. Sea Ice Index data. About the data
Credit: National Snow and Ice Data Center
High-resolution image
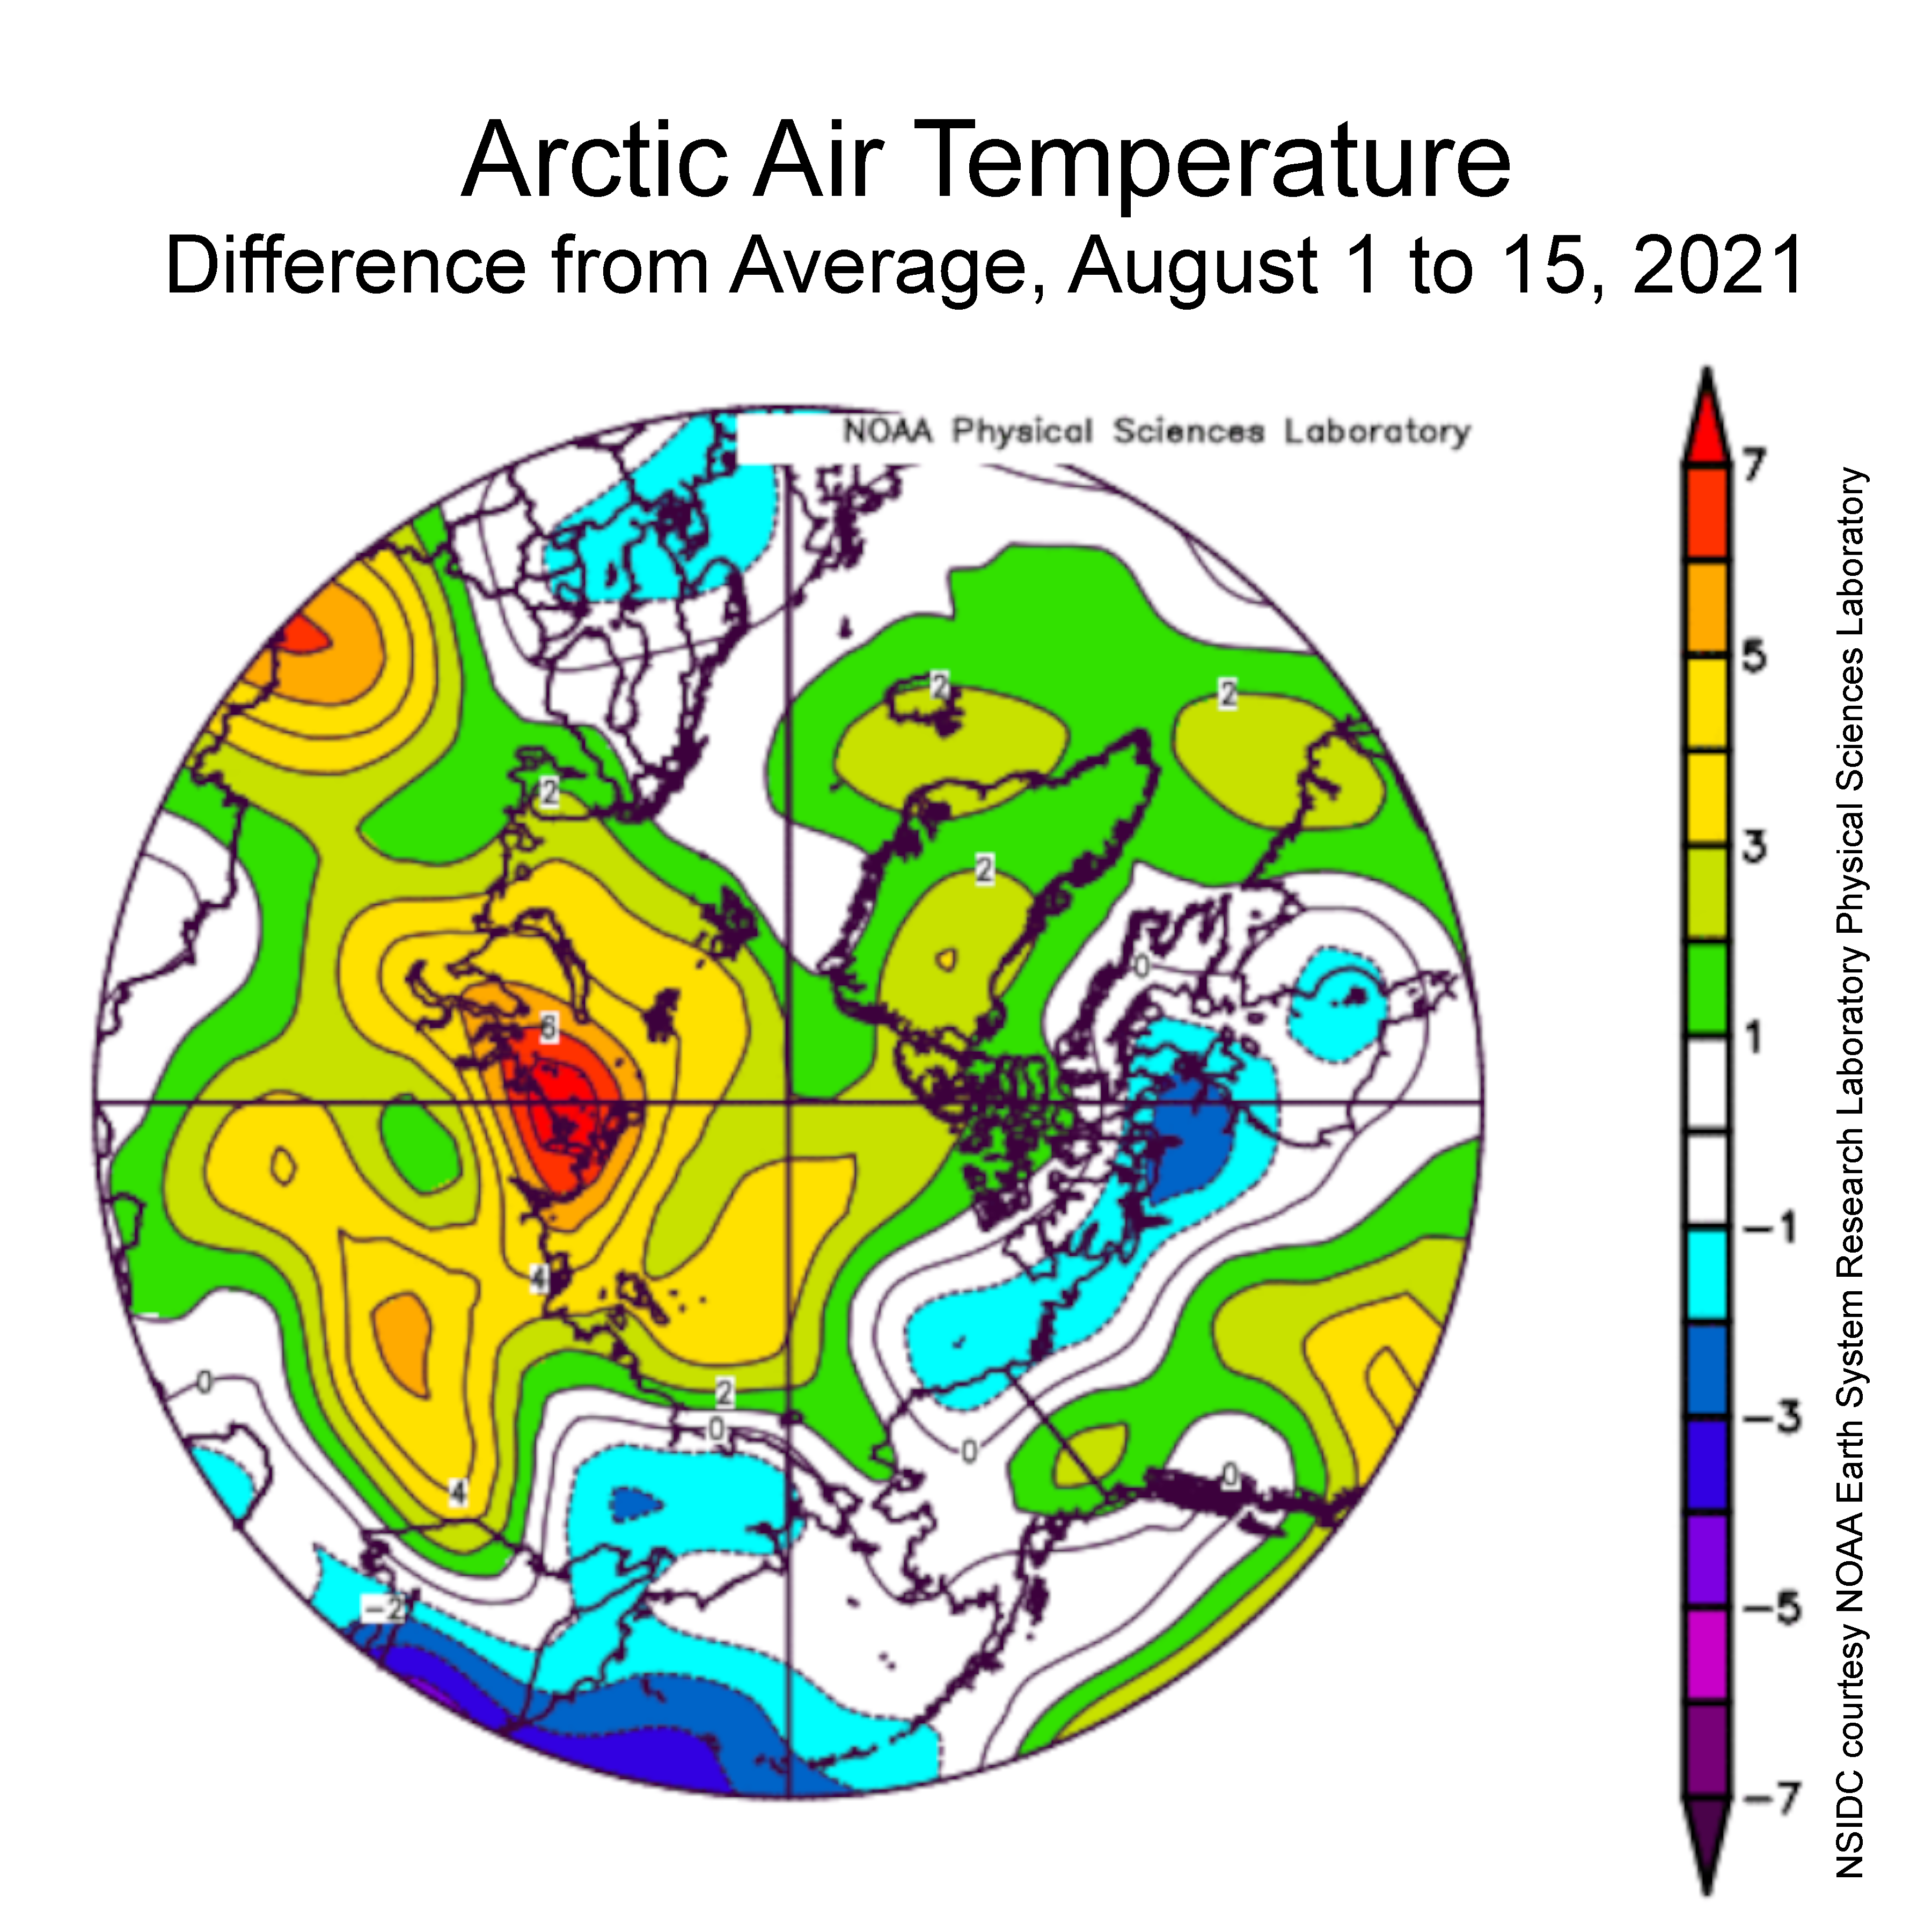
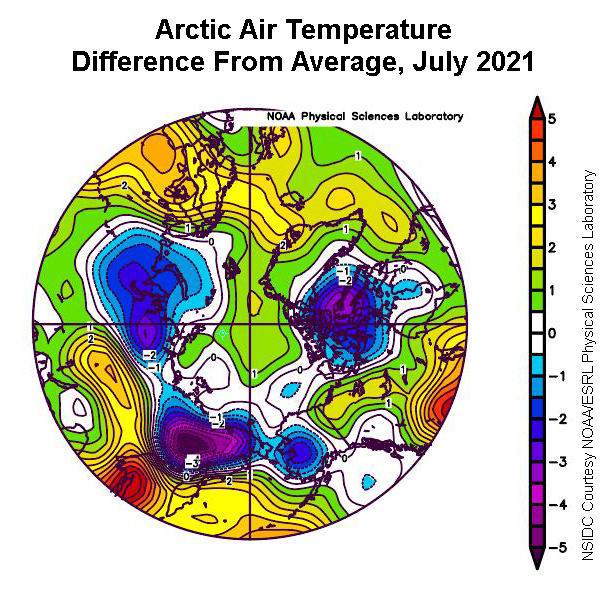
Figure 2b. This plot shows the departure from average air temperature in the Arctic at the 925 hPa level, in degrees Celsius, between August 1 to 15, 2021. Yellows and reds indicate higher than average temperatures; blues and purples indicate lower than average temperatures.
Credit: NSIDC courtesy NOAA Earth System Research Laboratory Physical Sciences Laboratory
High-resolution image
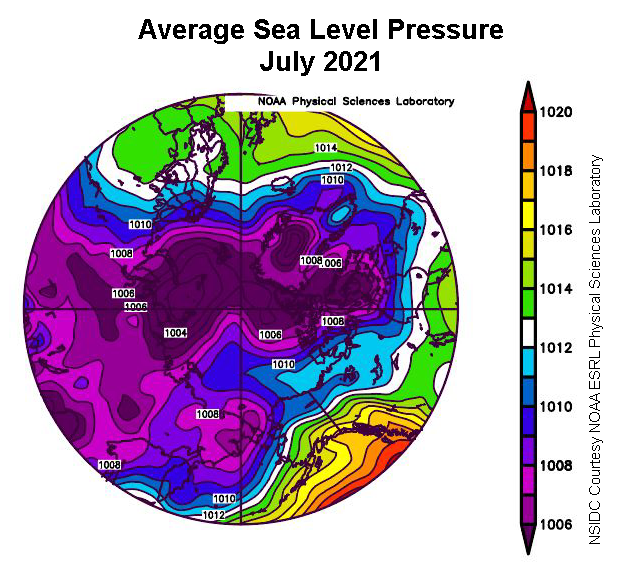
An unusually strong high-pressure system dominated over Siberia during the first half of August, extending towards the pole. This high pressure was coupled by low pressure over the Greenland Ice Sheet, promoting strong southwards ice motion from the center of the Arctic Ocean towards the North American and Siberian coastlines. Overall, air temperatures at the 925 millibar level (about 2,500 feet above the surface) were about 2 to 5 degrees Celsius (4 to 9 degrees Fahrenheit) above average over most of the Arctic Ocean, with air temperatures up to 7 degrees Celsius (13 degrees Fahrenheit) above average in the Kara Sea near Severnaya Zemlya (Figure 2b). However, while temperatures have mostly been higher than average, this is the time of the year when air temperatures start to drop as the sun dips lower on the horizon. Surface melting ends and melt ponds begin to refreeze, and thus remaining ice loss is primarily from below the sea ice, melting out the bottom from heat in the upper layer of the ocean.
Timing of melt onset is a mixed bag
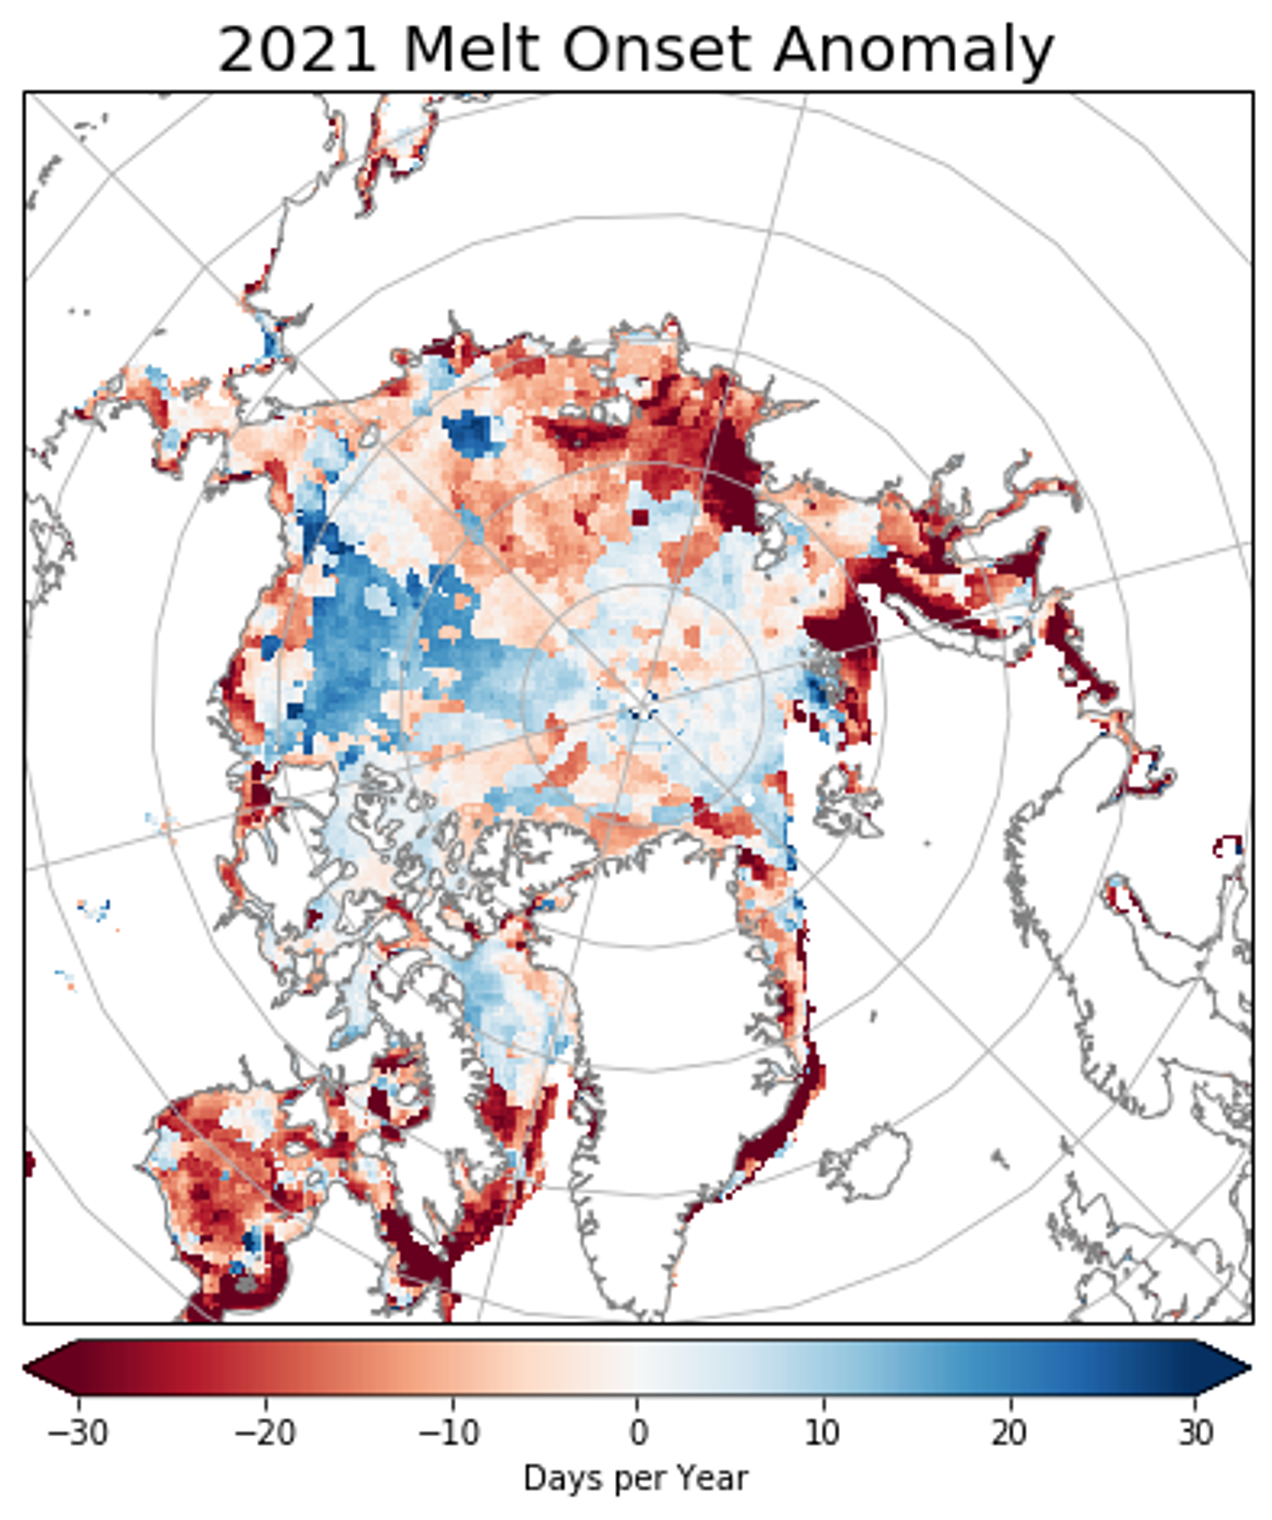
Figure 3. This map shows the date of sea ice melt onset in the Arctic for the 2021 melt season compared to the 1981 to 2010 average. Shades in red depict sea ice melt up to 30 days earlier than average, while shades in blue depict melt up to 30 days later than average.
Credit: Walt Meier, NSIDC; data courtesy J. Miller, NASA Goddard
High-resolution image
This summer sea ice retreated early within the Laptev Sea. This was in part a result of earlier melt onset, starting more than a month earlier than the 1981 to 2010 average over parts of the Laptev Sea (Figure 3). Earlier melt onset allows for earlier loss of the winter snow cover and earlier development of melt ponds that reduce the surface reflectivity, known as albedo. A lower surface albedo enhances summer ice melt by absorbing more of the sun’s energy. Melt this summer was also unusually early within Hudson Bay and Davis Strait, on average 16 days earlier. The sea ice within the Barents Sea near Franz Josef Land and within the Kara Sea around Novaya Zemlya also started to melt more than a month earlier than average. On the other hand, melt was about two to three weeks later than average in the northern Beaufort Sea, despite earlier melt observed near the coast. This later melt onset may have helped to reduce ice loss in the region this summer. Overall, pan-Arctic melt onset was five days earlier than average.
Multiyear ice near record low

Figure 4a. This graph shows the near record-low amount of multiyear ice in the Arctic as of week 31 (July 30 to August 5) of the 2021 melt season, comparing this year to the same week in previous years of the satellite record that began in 1979. Historical data through 2020 are provided by Tschudi et al., 2019a and quicklook data for 2021 by Tschudi et al., 2019b
Credit: Robbie Mallett
High-resolution image
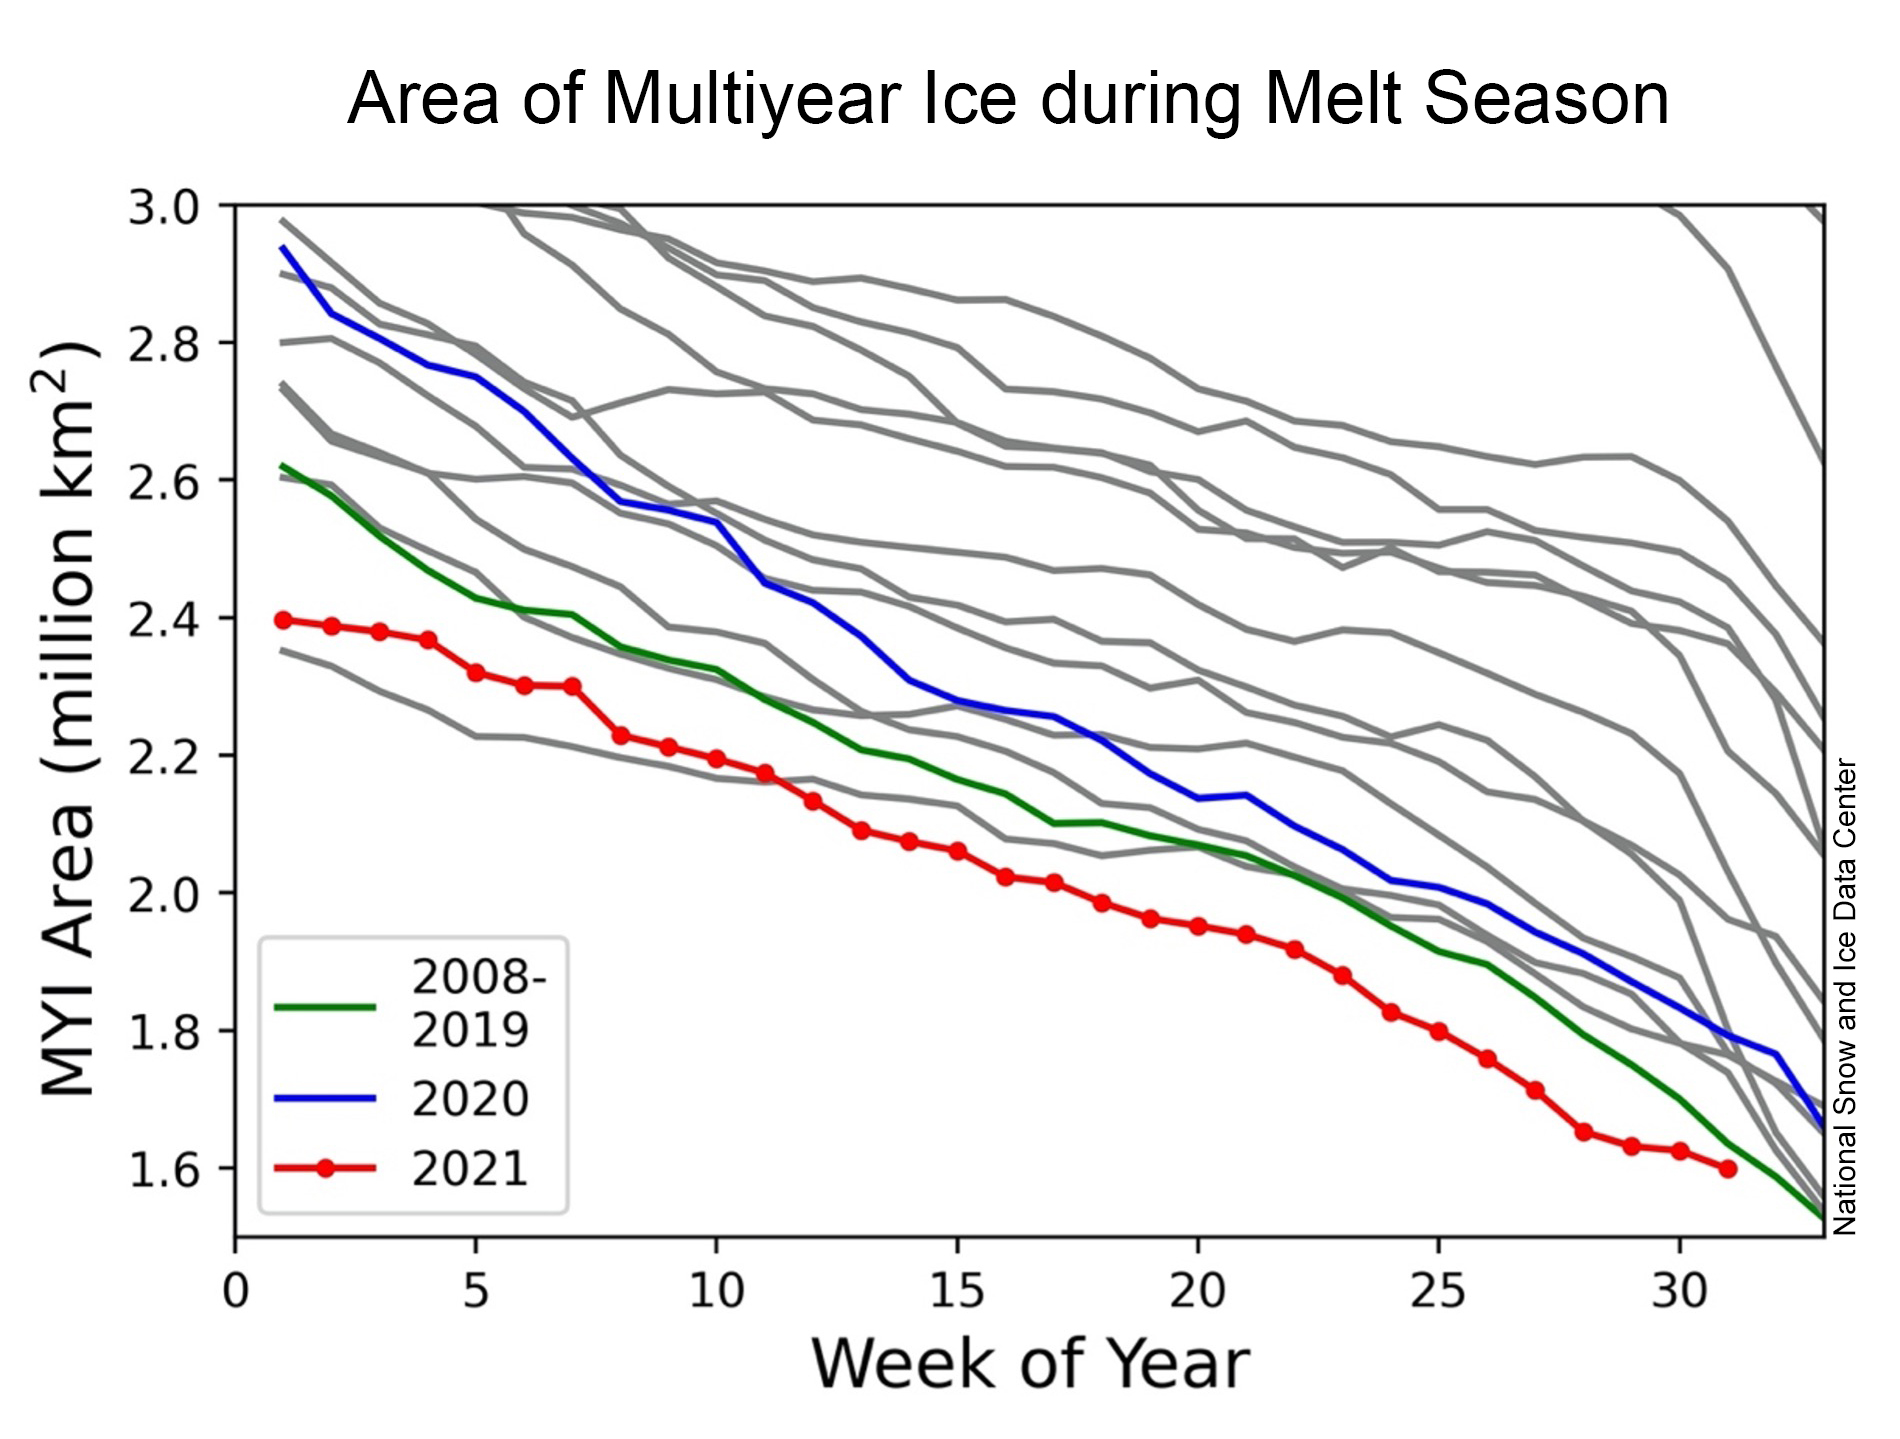
Figure 4b. This graph compares the area of multiyear ice in the Arctic between 2021, 2020, and the average from 2008 to 2019 as it melts out throughout the spring and summer. The grey lines depict previous years for general comparison. The area is calculated by adding all pixels in the Arctic that are older than one year based on the NSIDC ice age data product, and multiplying by the area per pixel of each grid cell. Historical data through 2020 are provided by Tschudi et al., 2019a and quicklook data for 2021 by Tschudi et al., 2019b
Credit: Robbie Mallett
High-resolution image
While the multiyear ice that advected into the Beaufort Sea has helped to stabilize ice loss in that region, multiyear ice for 2021 in the Arctic as a whole is at a record low. Based on ice age classification, the proportion of multiyear ice in the Arctic during the first week of August is at 1.6 million square kilometers (618,000 million square miles). The loss of the multiyear ice since the early 1980s started in earnest after the 2007 record low minimum sea ice cover that summer, and while there have been slight recoveries since then, it has not recovered to values seen in the 1980s, 1990s, or early 2000s. This loss of the oldest and thickest ice in the Arctic Ocean is one of the reasons why the summer sea ice extent has not recovered, even when weather conditions are favorable for ice retention.
2021 Arctic sea ice minimum forecasts
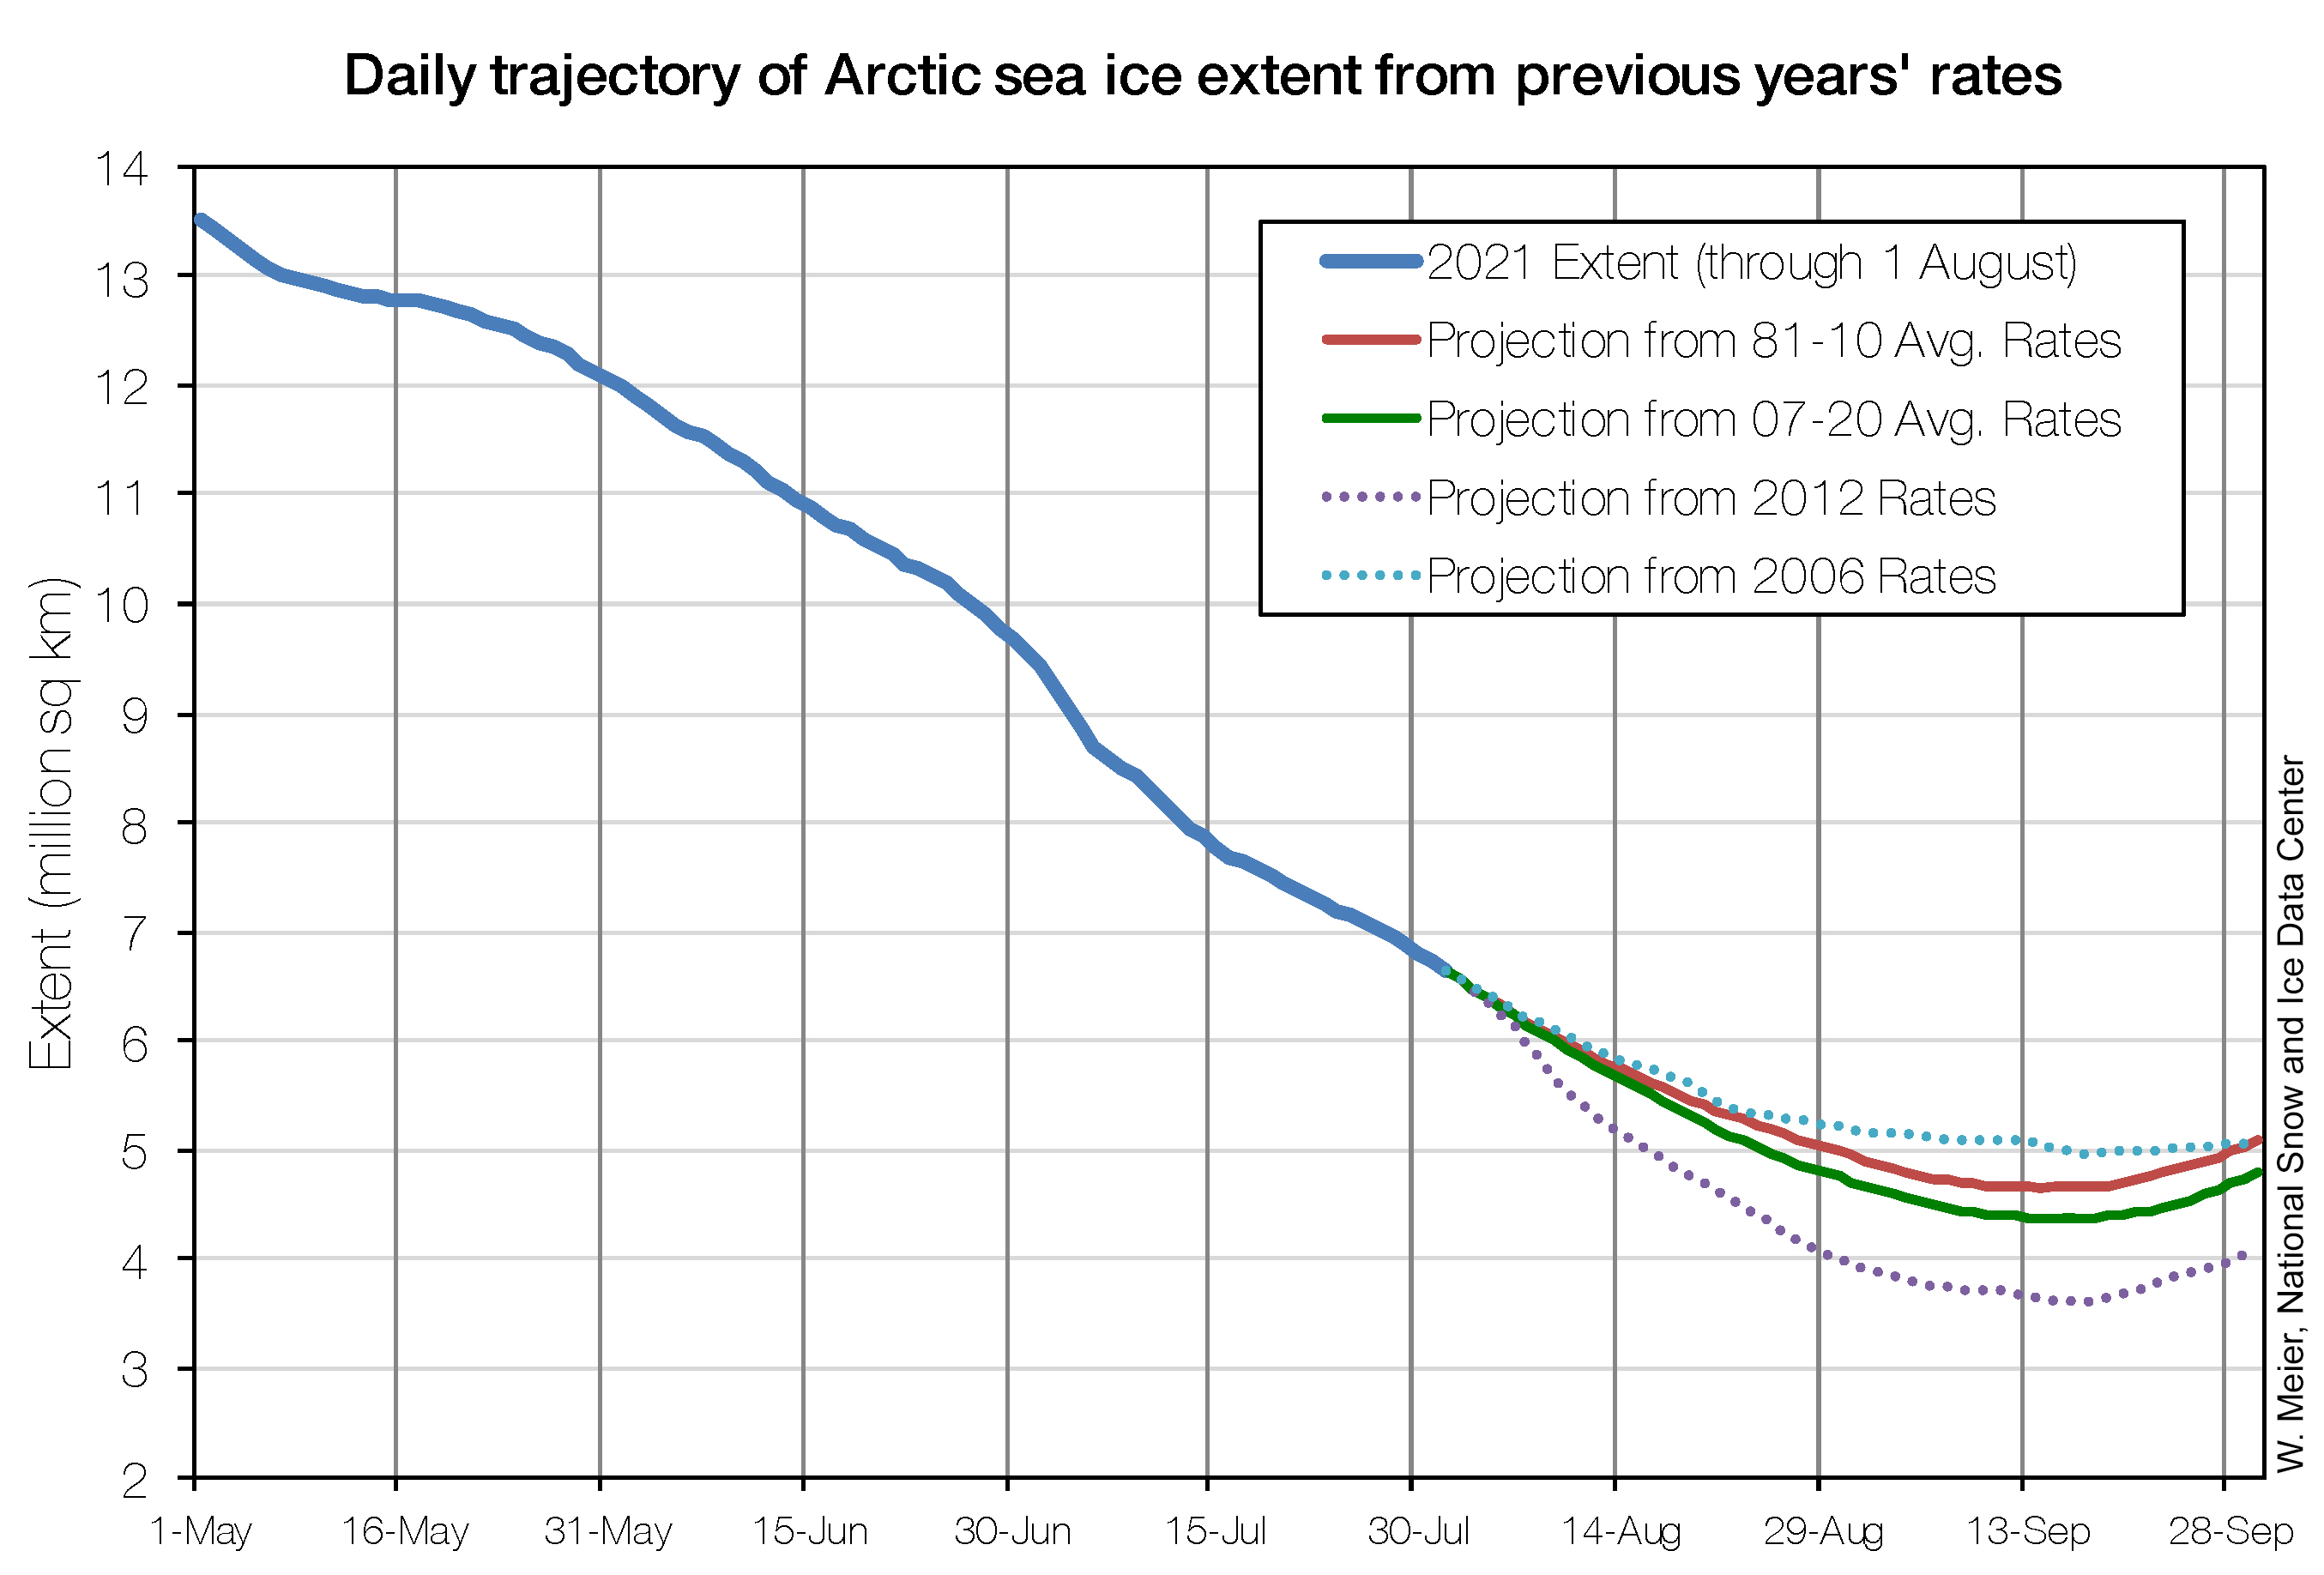
Figure 5. This figure shows Arctic sea ice extent projections for the 2021 minimum using data through August 1, 2021. The projections are based on the average loss rates for the 1981 to 2010 average in red, the 2007 to 2020 average in green, 2012 rates in dotted purple, and 2006 rates in dotted teal.
Credit: Walt Meier, National Snow and Ice Data Center
High-resolution image
In about three or four weeks, Arctic sea ice will reach its minimum extent for the 2021 melt season. A community effort, called the Sea Ice Prediction Network (SIPN), each years runs the Sea Ice Outlook. The Outlook is a forum for researchers and other interested people to provide a seasonal forecast of the September monthly average extent and the daily seasonal minimum. One submission by Arctic Sea Ice News & Analysis (ASINA) team member Walt Meier uses ice extent loss rates from previous years to project this year’s ice loss through the end of September (Figure 5). Projections of the minimum and September average extent are initially submitted using data through the beginning of May as starting points and updated Outlooks can be provided in following months as conditions evolve. Figure 5 shows the latest projection starting with observations on August 1, submitted to the August Outlook. The projections are based on the average loss rates for four different rates using data from previous years. The August Outlook report will be published later this month.
Further reading
Babb, D. G., J. C. Landy, D. G. Barber, and R. J. Galley. 2019. Winter sea ice export from the Beaufort Sea as a preconditioning mechanism for enhanced summer melt: A case study of 2016. Journal of Geophysical Research: Oceans, 124, 6575– 6600. doi:10.1029/2019JC015053.
Mallett, R. D. C., J. C. Stroeve, S. B. Cornish, et al. 2021. Record winter winds in 2020/21 drove exceptional Arctic sea ice transport. Communication Earth Environment 2, 149. doi:10.1038/s43247-021-00221-8.