A vast area of the Arctic Ocean remains ice free as November begins, far later in the season than is typical. The monthly average ice extent for October is the lowest in the satellite record. On October 24, a record difference was set in daily ice extent relative to the 1981 to 2010 average. Large heat transfers from the open water to the atmosphere have manifested as above-average air temperatures near the surface of the ocean.
Overview of conditions
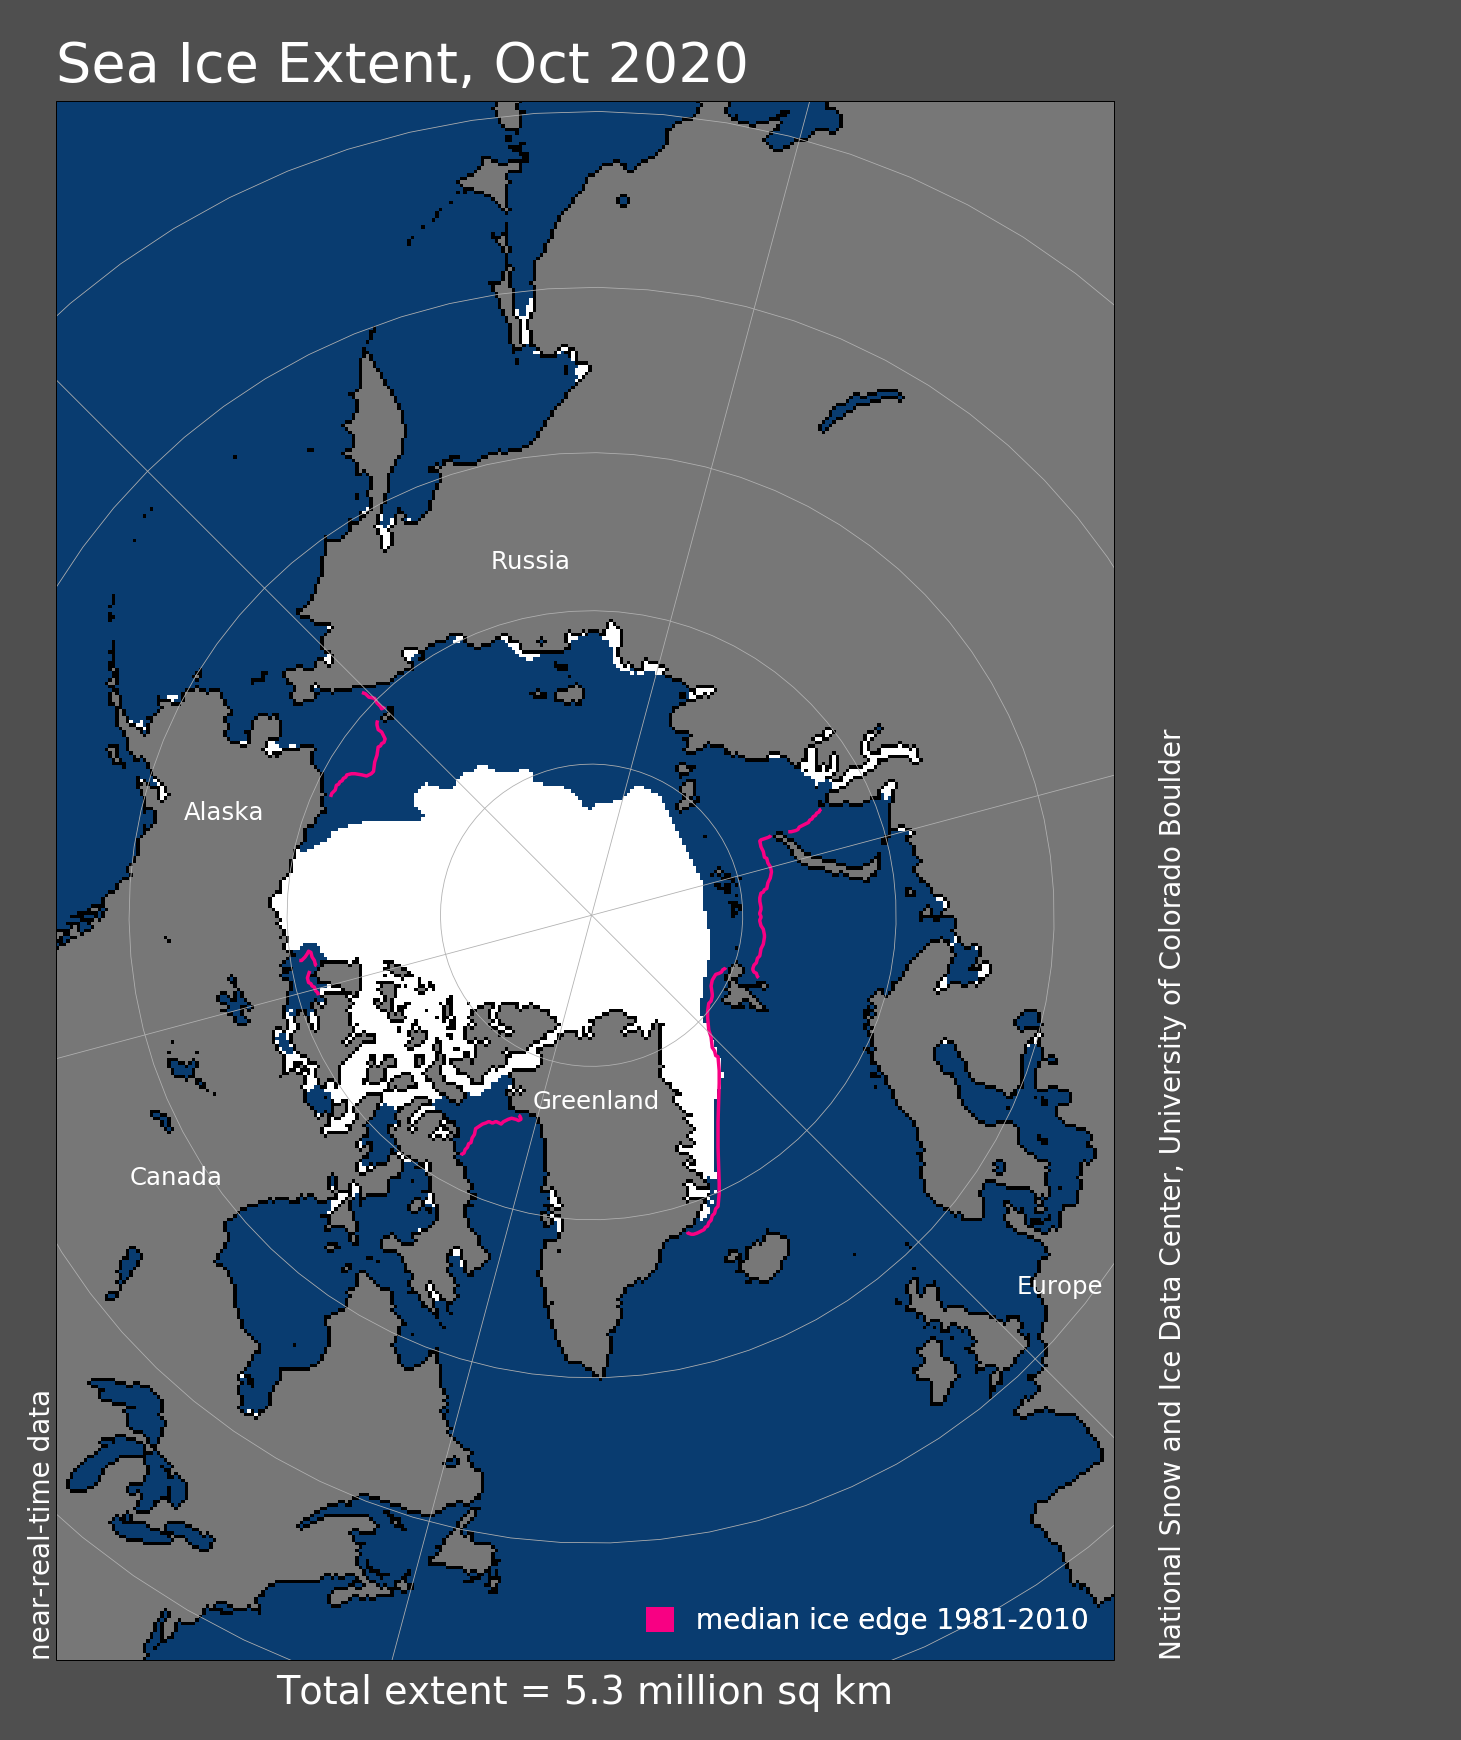
Figure 1. Arctic sea ice extent for October 2020 was 5.28 million square kilometers (2.04 million square miles). The magenta line shows the 1981 to 2010 average extent for that month. Sea Ice Index data. About the data
Credit: National Snow and Ice Data Center
High-resolution image
Sea ice extent for October 2020 was 5.28 million square kilometers (2.04 million square miles), placing it lowest in the satellite record for the month. This was 3.07 million square kilometers (1.19 million square miles) below the 1981 to 2010 October average and 450,000 square kilometers (173,700 square miles) below the record low mark for October set in 2019. October 2020 is the largest departure from average conditions seen in any month thus far in the satellite record, falling 3.69 standard deviations below the 1981 to 2010 mean. Ice extent is far below average in all of sectors of the Eurasian side of the Arctic Ocean and in Baffin Bay.
Conditions in context
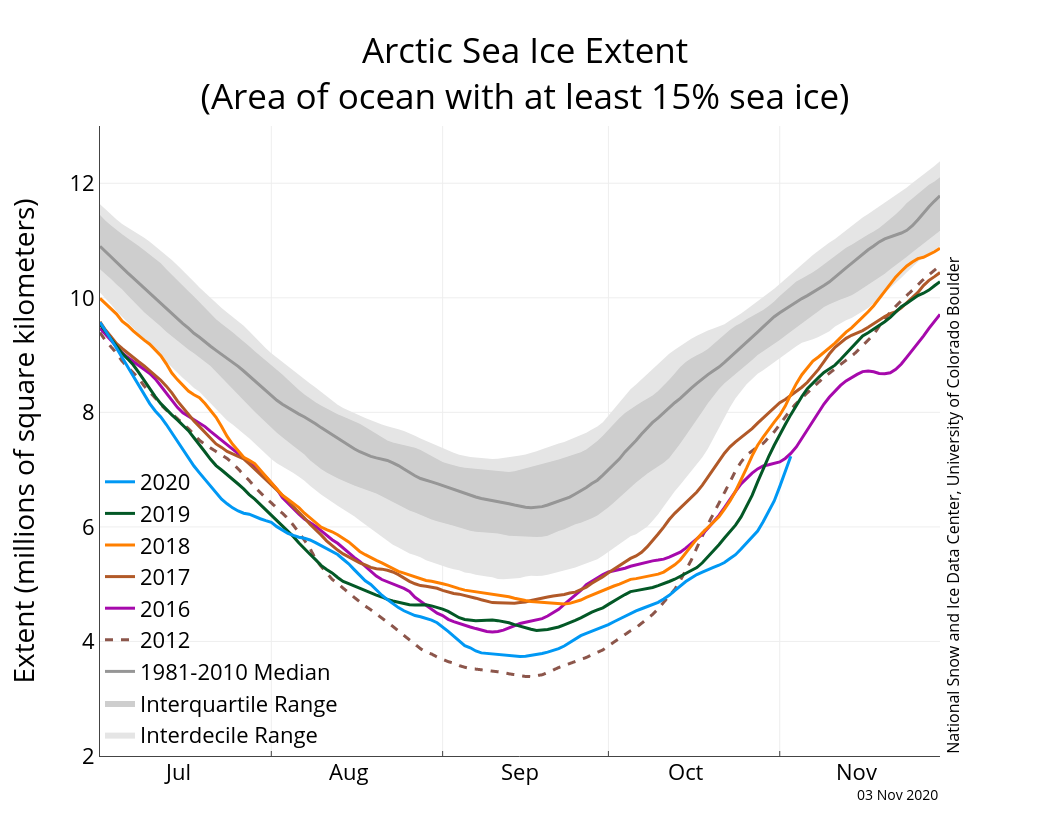
Figure 2a. The graph above shows Arctic sea ice extent as of November 3, 2020, along with daily ice extent data for four previous years and the 2012 record low year. 2020 is shown in blue, 2019 in green, 2018 in orange, 2017 in brown, 2016 in purple, and 2012 in dashed brown. The 1981 to 2010 median is in dark gray. The gray areas around the median line show the interquartile and interdecile ranges of the data. Sea Ice Index data.
Credit: National Snow and Ice Data Center
High-resolution image
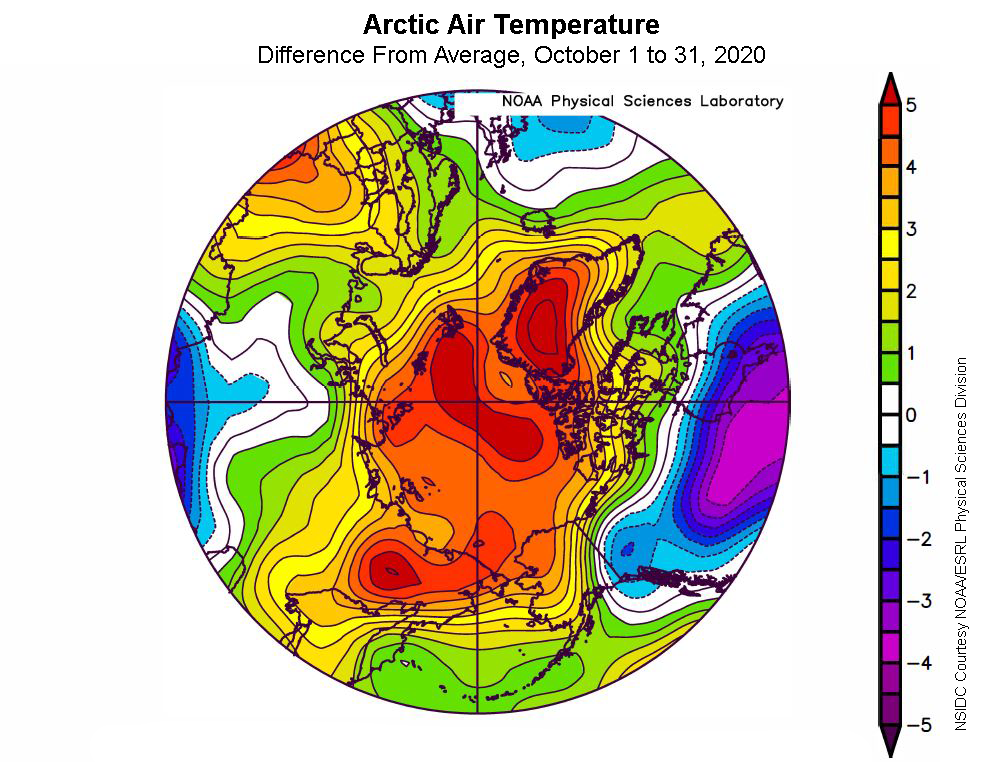
Figure 2b. This plot shows the departure from average air temperature in the Arctic at the 925 hPa level, in degrees Celsius, for October 2020. Yellows and reds indicate higher than average temperatures; blues and purples indicate lower than average temperatures.
Credit: NSIDC courtesy NOAA Earth System Research Laboratory Physical Sciences Division
High-resolution image
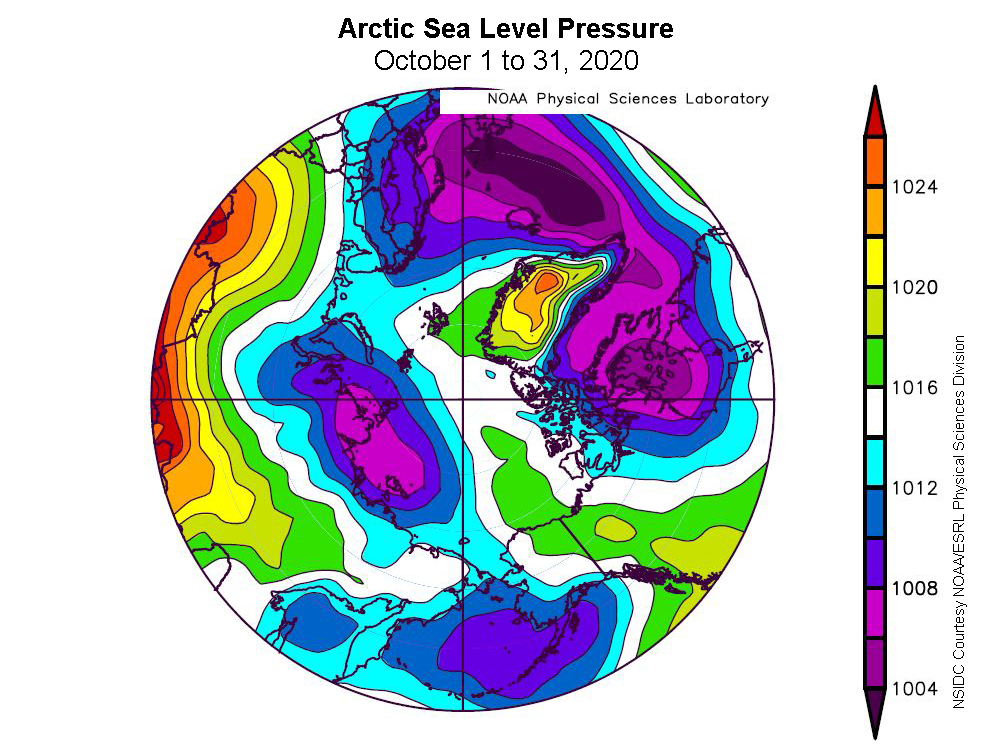
Figure 2c. This plot shows average sea level pressure in the Arctic in millibars (hPa) for October 2020. Yellows and reds indicate high air pressure; blues and purples indicate low pressure.
Credit: NSIDC courtesy NOAA Earth System Research Laboratory Physical Sciences Division
High-resolution image
Throughout the month, sea ice grew by an average of 71,200 square kilometers (27,500 square miles) per day, which is close to the average rate for 1981 to 2010. For the first three weeks of October, however, growth rates were well below average, around 51,600 square kilometers (19,900 square miles) per day. Following the pattern of recent years, growth became very rapid late in the month, averaging around 134,000 square kilometers (51,700 square miles) per day. From October 13 into early November, the daily sea ice extent was the lowest for that day in the satellite record. Sea ice growth in the last 10 days of the month was mostly along the Siberian coast, extending northward, and along the Eurasian side of the sea ice pack, extending southward. Based on passive microwave data, the Northern Sea Route remained open through nearly all of October.
Air temperatures at the 925 hPa level (about 2,500 feet above the surface) were 4 to 5 degrees Celsius (7 to 9 degrees Fahrenheit) above average for the month across much of the Central and Western Arctic Ocean and the Siberian Arctic coast, as well as over Northern Greenland. Elsewhere in the Arctic and the northernmost Atlantic regions, temperatures were near average to slightly below average. Temperatures in Central Canada were 1 to 4 degrees Celsius (2 to 7 degrees Fahrenheit) below average (Figure 2b).
The average sea level pressure pattern for October was characterized by below-average pressure over the Northern Atlantic Ocean and Laptev and Bering Seas, driving winds northward toward the Lena River region, Barents Sea, and Novaya Zemlya. Below-average pressure also occurred over the Hudson Bay (Figure 2c).
October 2020 compared to previous years
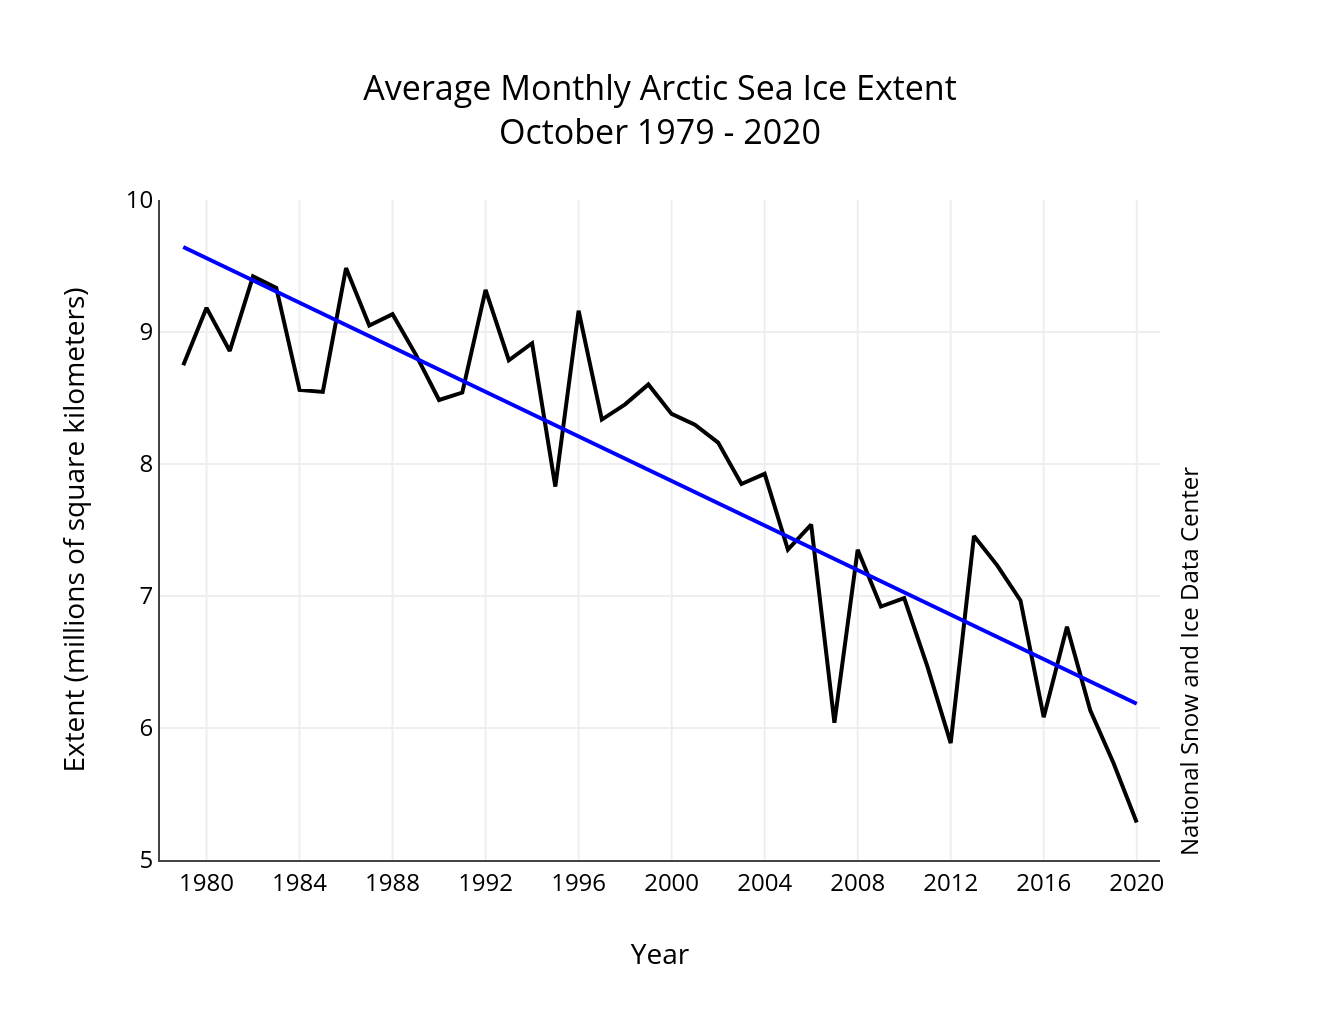
Figure 3. Monthly October ice extent for 1979 to 2020 shows a decline of 10.1 percent per decade.
Credit: National Snow and Ice Data Center
High-resolution image
Including 2020, the linear rate of decline for October sea ice extent is 10.1 percent per decade. This corresponds to a downward trend of -84,400 square kilometers (32,600 square miles) per year, or losing an area about the size of South Carolina each year. Over the 42-year satellite record, the Arctic has lost about 3.45 million square kilometers (1.33 million square miles) of ice in October, based on the difference in linear trend values in 2019 and 1979. This is comparable to twice the size of the state of Alaska.
Increasing departures from average in autumn
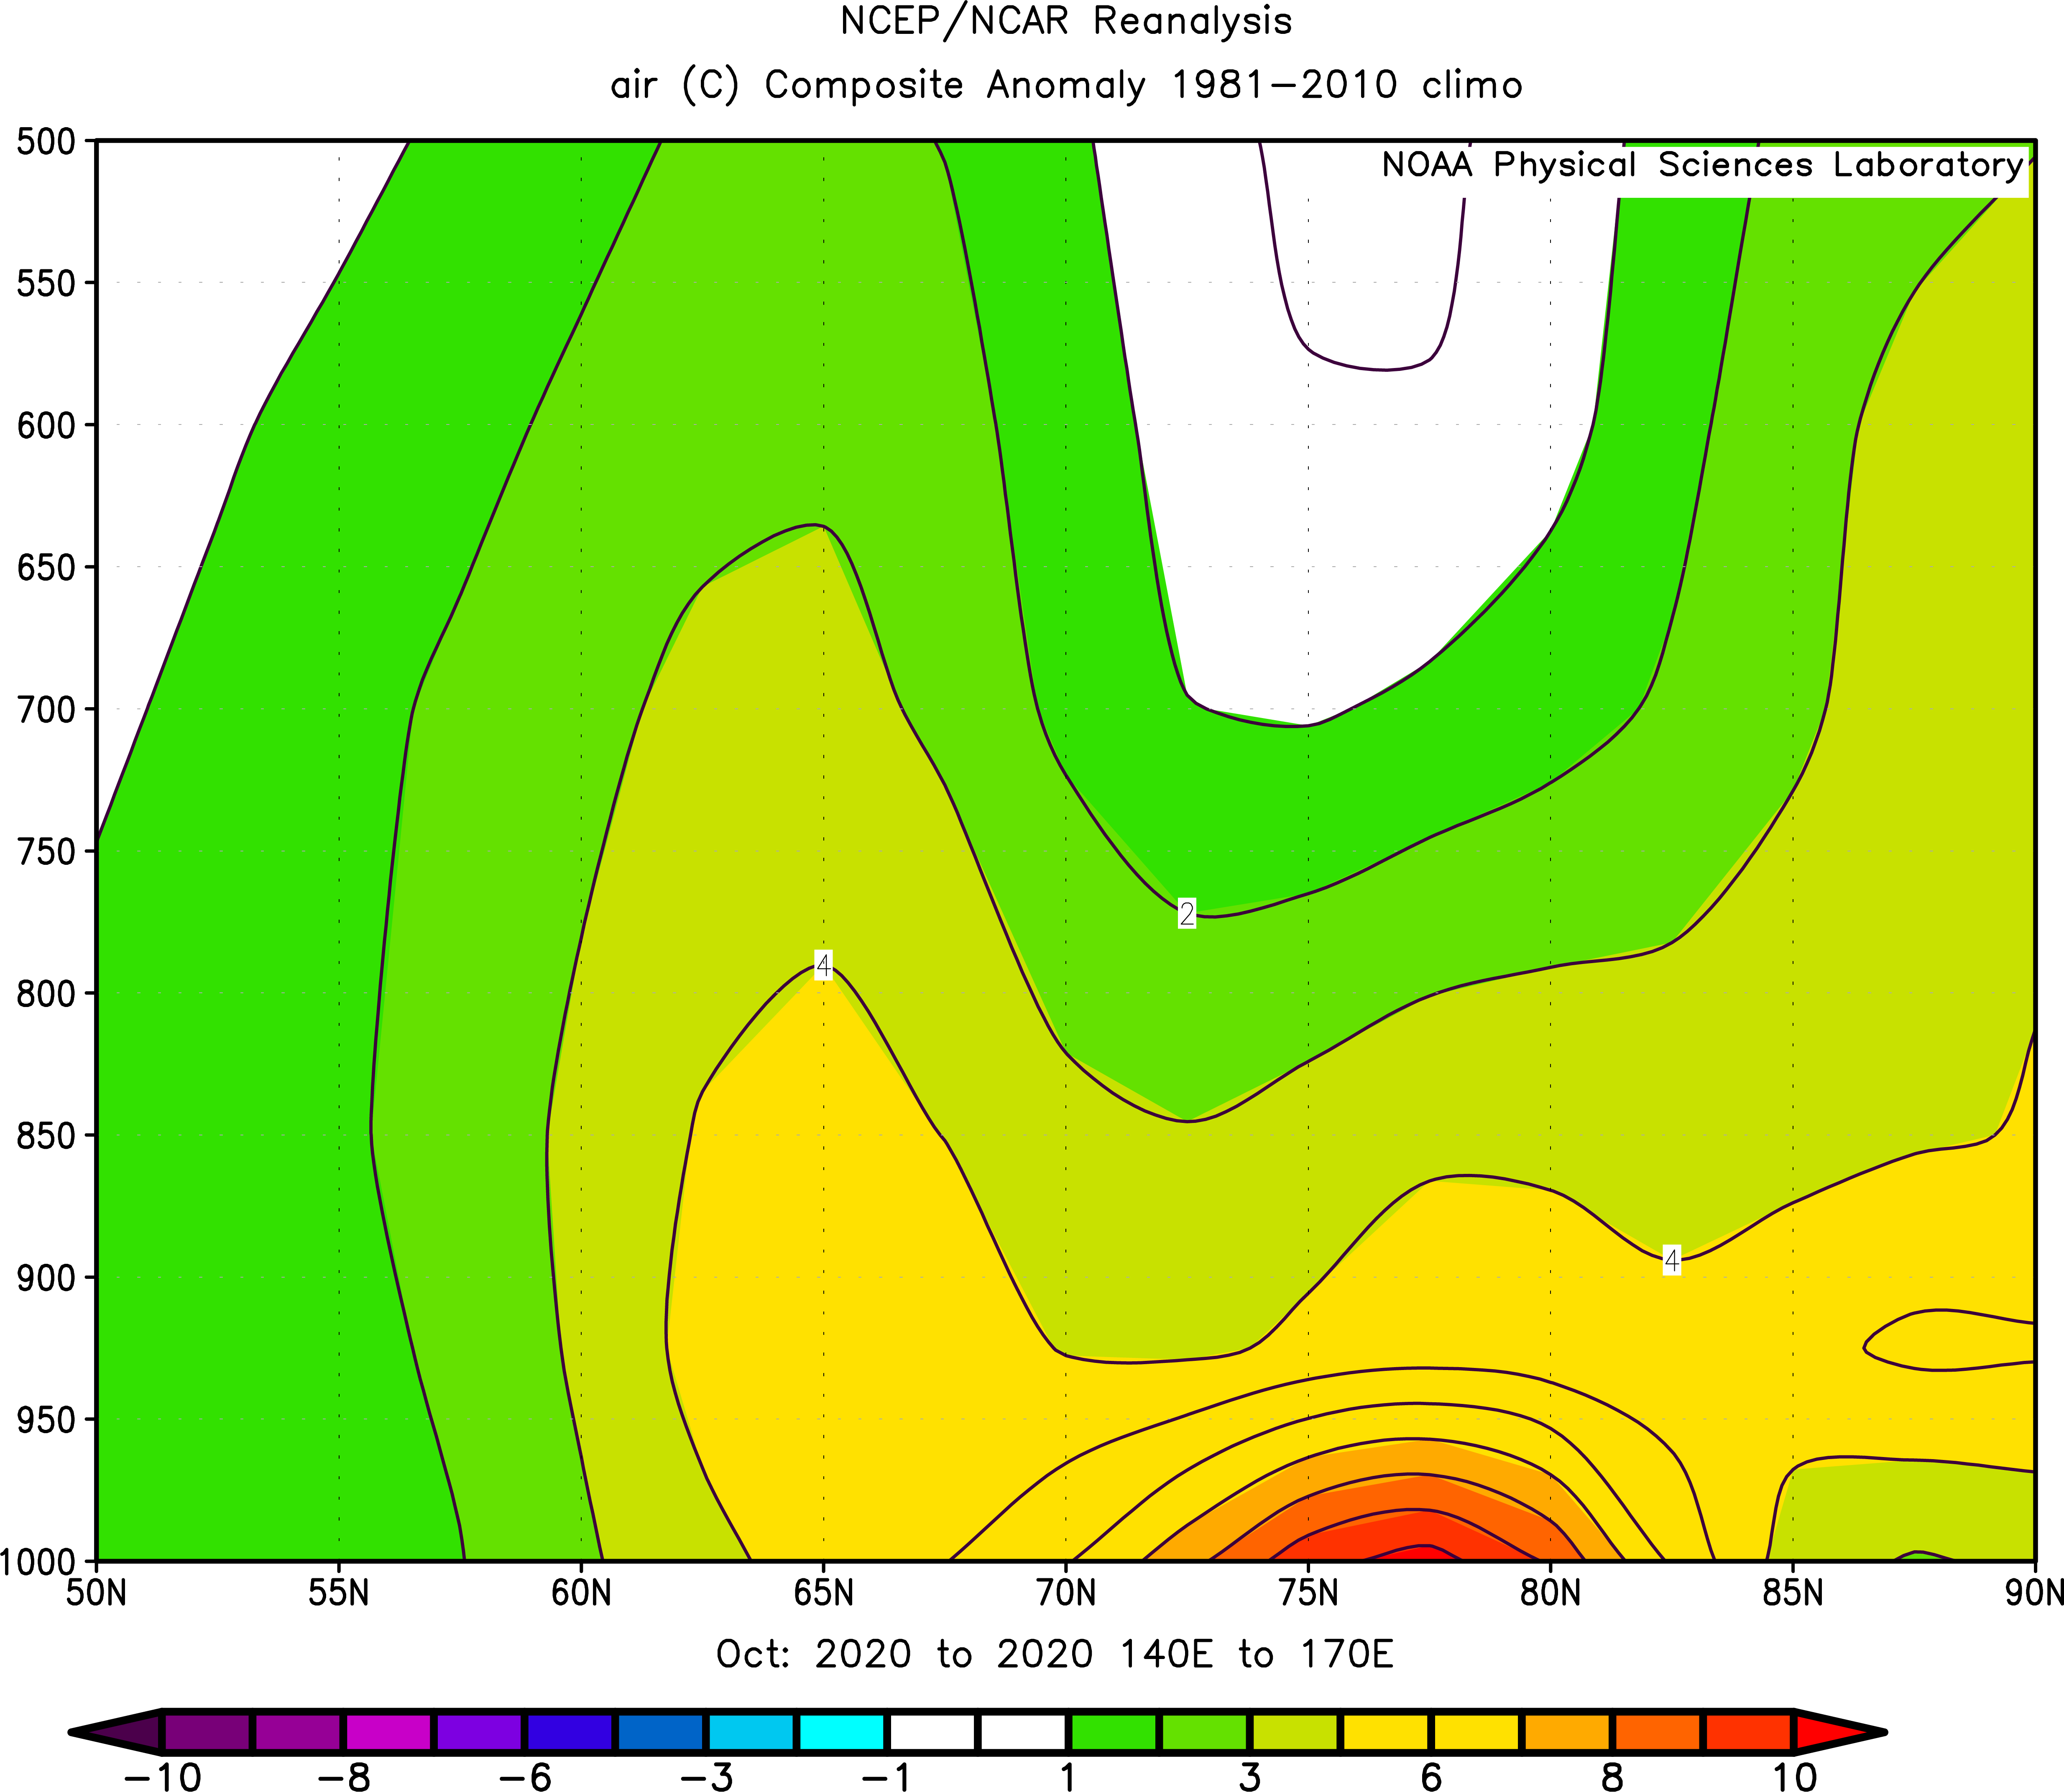
Figure 4a. This figure shows a profile of temperature (in color) for the lower half of the atmosphere (500 to 1,000 millibars, or about 18,000 feet to the surface) versus latitude, averaged along a swath of longitudes from 140 to 170 degrees E. With longer periods of open water during spring and summer, more solar energy is absorbed within the upper part of the ocean. This delays sea ice formation because before ice can form, the ocean must lose this heat to the atmosphere and then to space. This excess heat transferred to the atmosphere can be seen as the warm (red) layer over the open water region.
Credit: NCEP/NCAR Reanalysis
High-resolution image
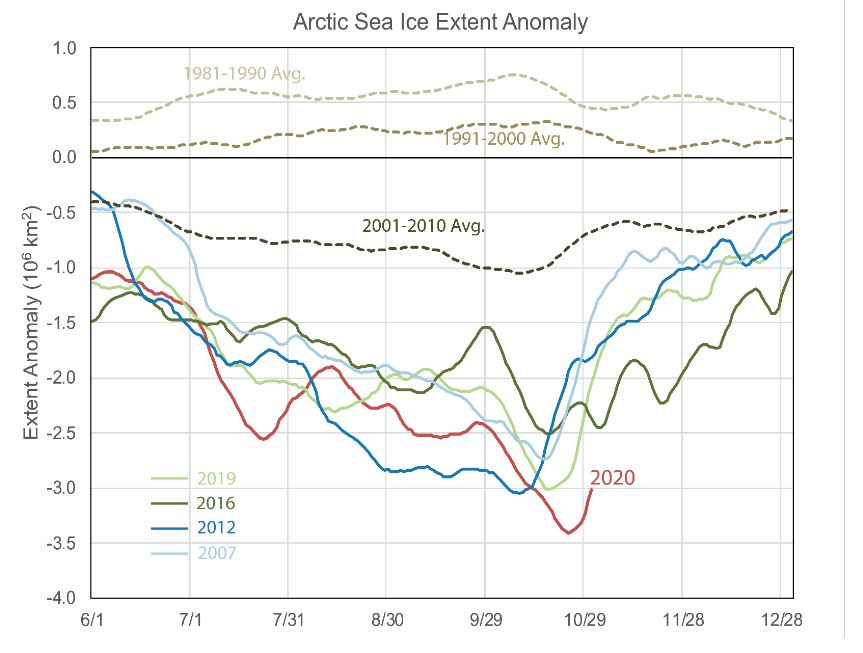
Figure 4b. A delay in Arctic sea ice growth in autumn tends to lead to large departures from average in sea ice extent after the summer minimum and particularly in the month of October. The five lowest September extent minima (2007, 2012, 2016, 2019, and 2020) all show large departures in October extent compared to the reference period. This plot shows Arctic sea ice extent anomalies for those five years from June to December compared with the 1981 to 1990 average, 1991 to 2000 average, and the 2001 to 2010 average.
Credit: National Snow and Ice Data Center
High-resolution image
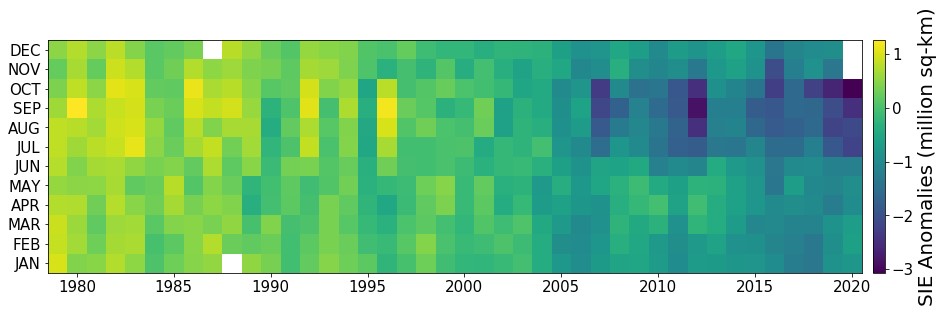
Figure 4c. This chart shows monthly sea ice extent anomaly (difference from the 1981 to 2010 average) for 1979 to October 2020. Deep blue colors depict low autumn sea ice extent over the past 15 years.
Credit: National Snow and Ice Data Center
High-resolution image
On October 24, Arctic sea ice extent had its largest departure from the 1981 to 2010 average of daily sea ice extent in the 42-year continuous satellite record, at 3.4 million square kilometers (1.31 million square miles). With longer periods of open water during spring and summer, more solar energy is absorbed within the upper few tens of meters of the ocean. This has the effect of delaying sea ice formation—before ice can form, the ocean must lose this heat to the atmosphere and then to space (Figure 4a).
The delay in ice regrowth leads to large departures from average in sea ice extent in the time after the summer minimum and particularly in the month of October. The five lowest September extent minima (2007, 2012, 2016, 2019, and 2020) all show large departures in October extent compared to the reference period (Figure 4b).
This excess heat transferred to the atmosphere can be seen in a vertical profile of temperature by latitude along longitude 140 to 170 degrees E, which cuts though the open water area along the Eurasian coast (Figure 4a). In the past two decades, high autumn temperatures over the open water here have strongly contributed to Arctic Amplification—the larger rise in air temperatures over the Arctic compared to the rest of the globe. However, the anomalous warmth is largely limited to near the surface of the ocean.
Northern Sea Route shipping rises as sea ice falls
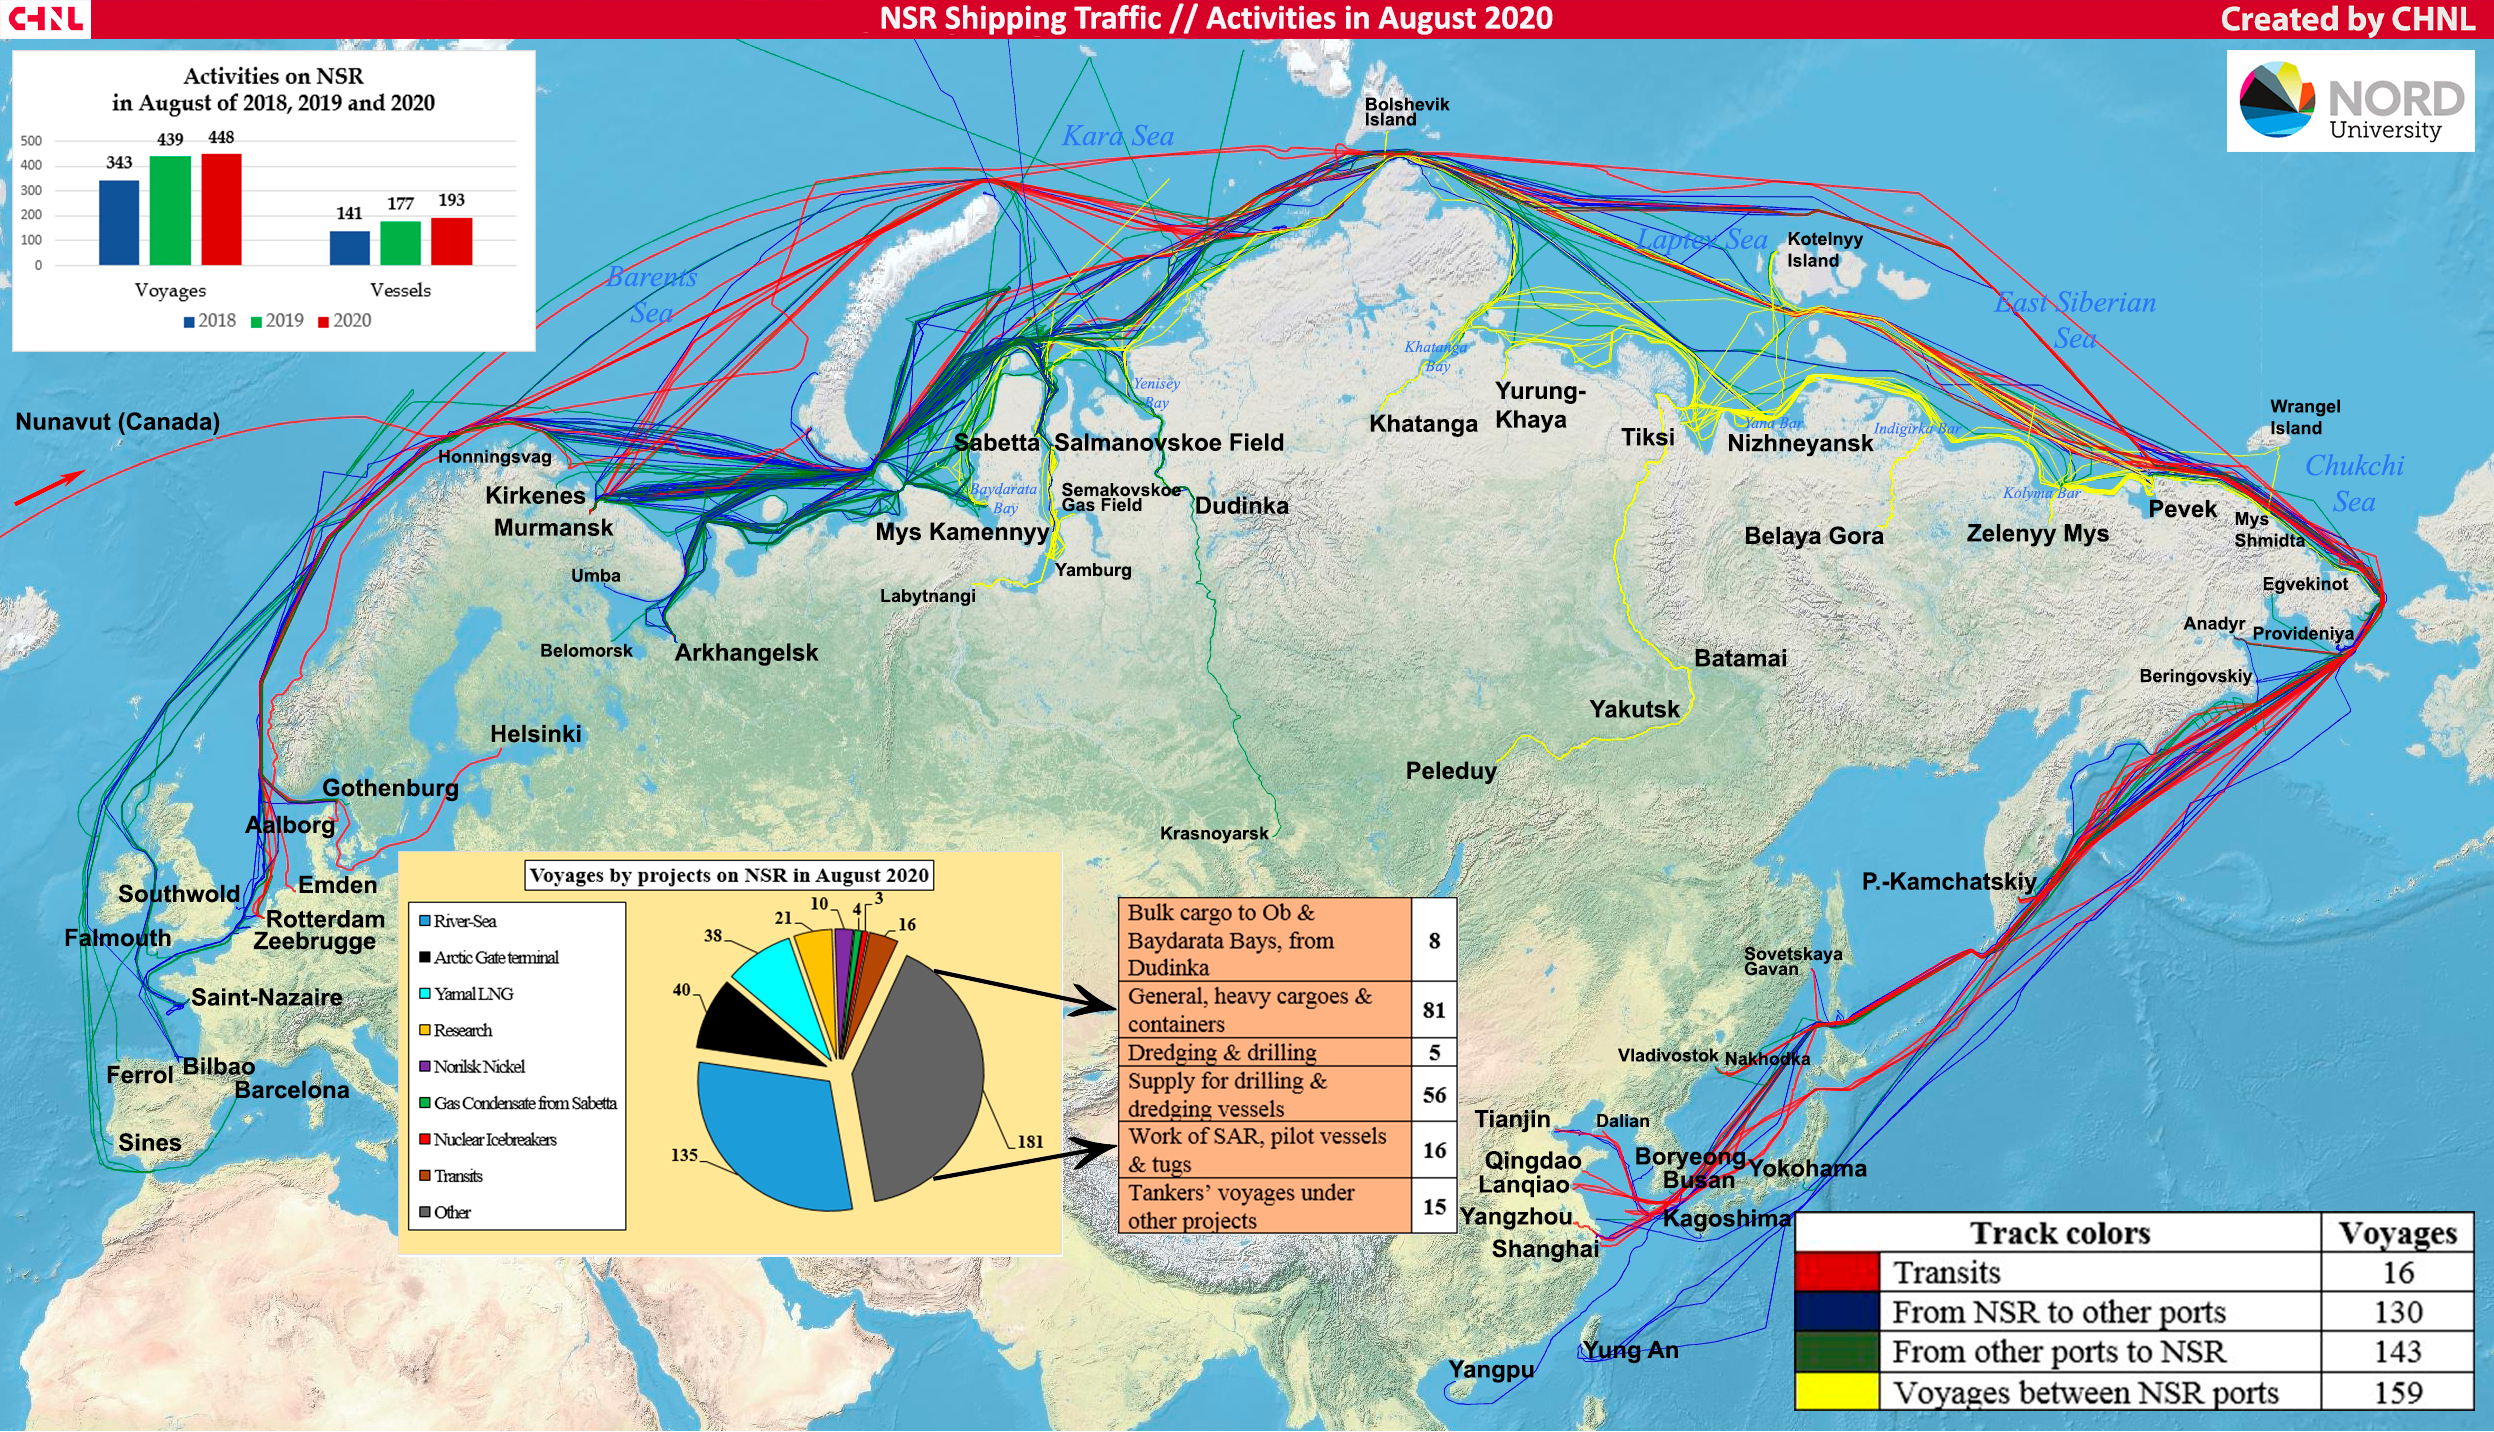
Figure 5. This chart shows Northern Sea Route (NSR) shipping traffic for August 2020 and other shipping information for that region. Track color legend is shown in the lower right. Transits through the NSR are shown in red, departing or arriving at the Arctic coastal ports in blue and green, and port-to-port within the Arctic is shown in yellow. The increase in August activity between 2018, 2019, and 2020 is shown in the bar chart at upper left.
Credit: Center for High North Logistics Information Office at Nord University
High-resolution image
Commercial shipping along the Northern Sea Route of the Russian north coast is increasing. This includes complete transits from Europe to East Asia, local shipping within the Arctic Ocean, and deliveries of liquefied natural gas from gas fields in the Yamal Peninsula to ports in both Europe and East Asia. The years 2019 and 2020 saw significantly increased shipping activity compared with 2018. 2020 had slightly more shipping than 2019 when comparing August shipping from both years. The shipping traffic map shows the importance of passages just north of the Taymyr Peninsula and near the New Siberian Islands on either side of the Laptev Sea; these are generally the last areas to clear of ice, and only in the warmest years. However, in 2020, the Northern Sea Route was essentially ice free from mid-July through about October 25. Icebreaker and ice-hardened tankers made several voyages within the route as early as June.
Looking to the south
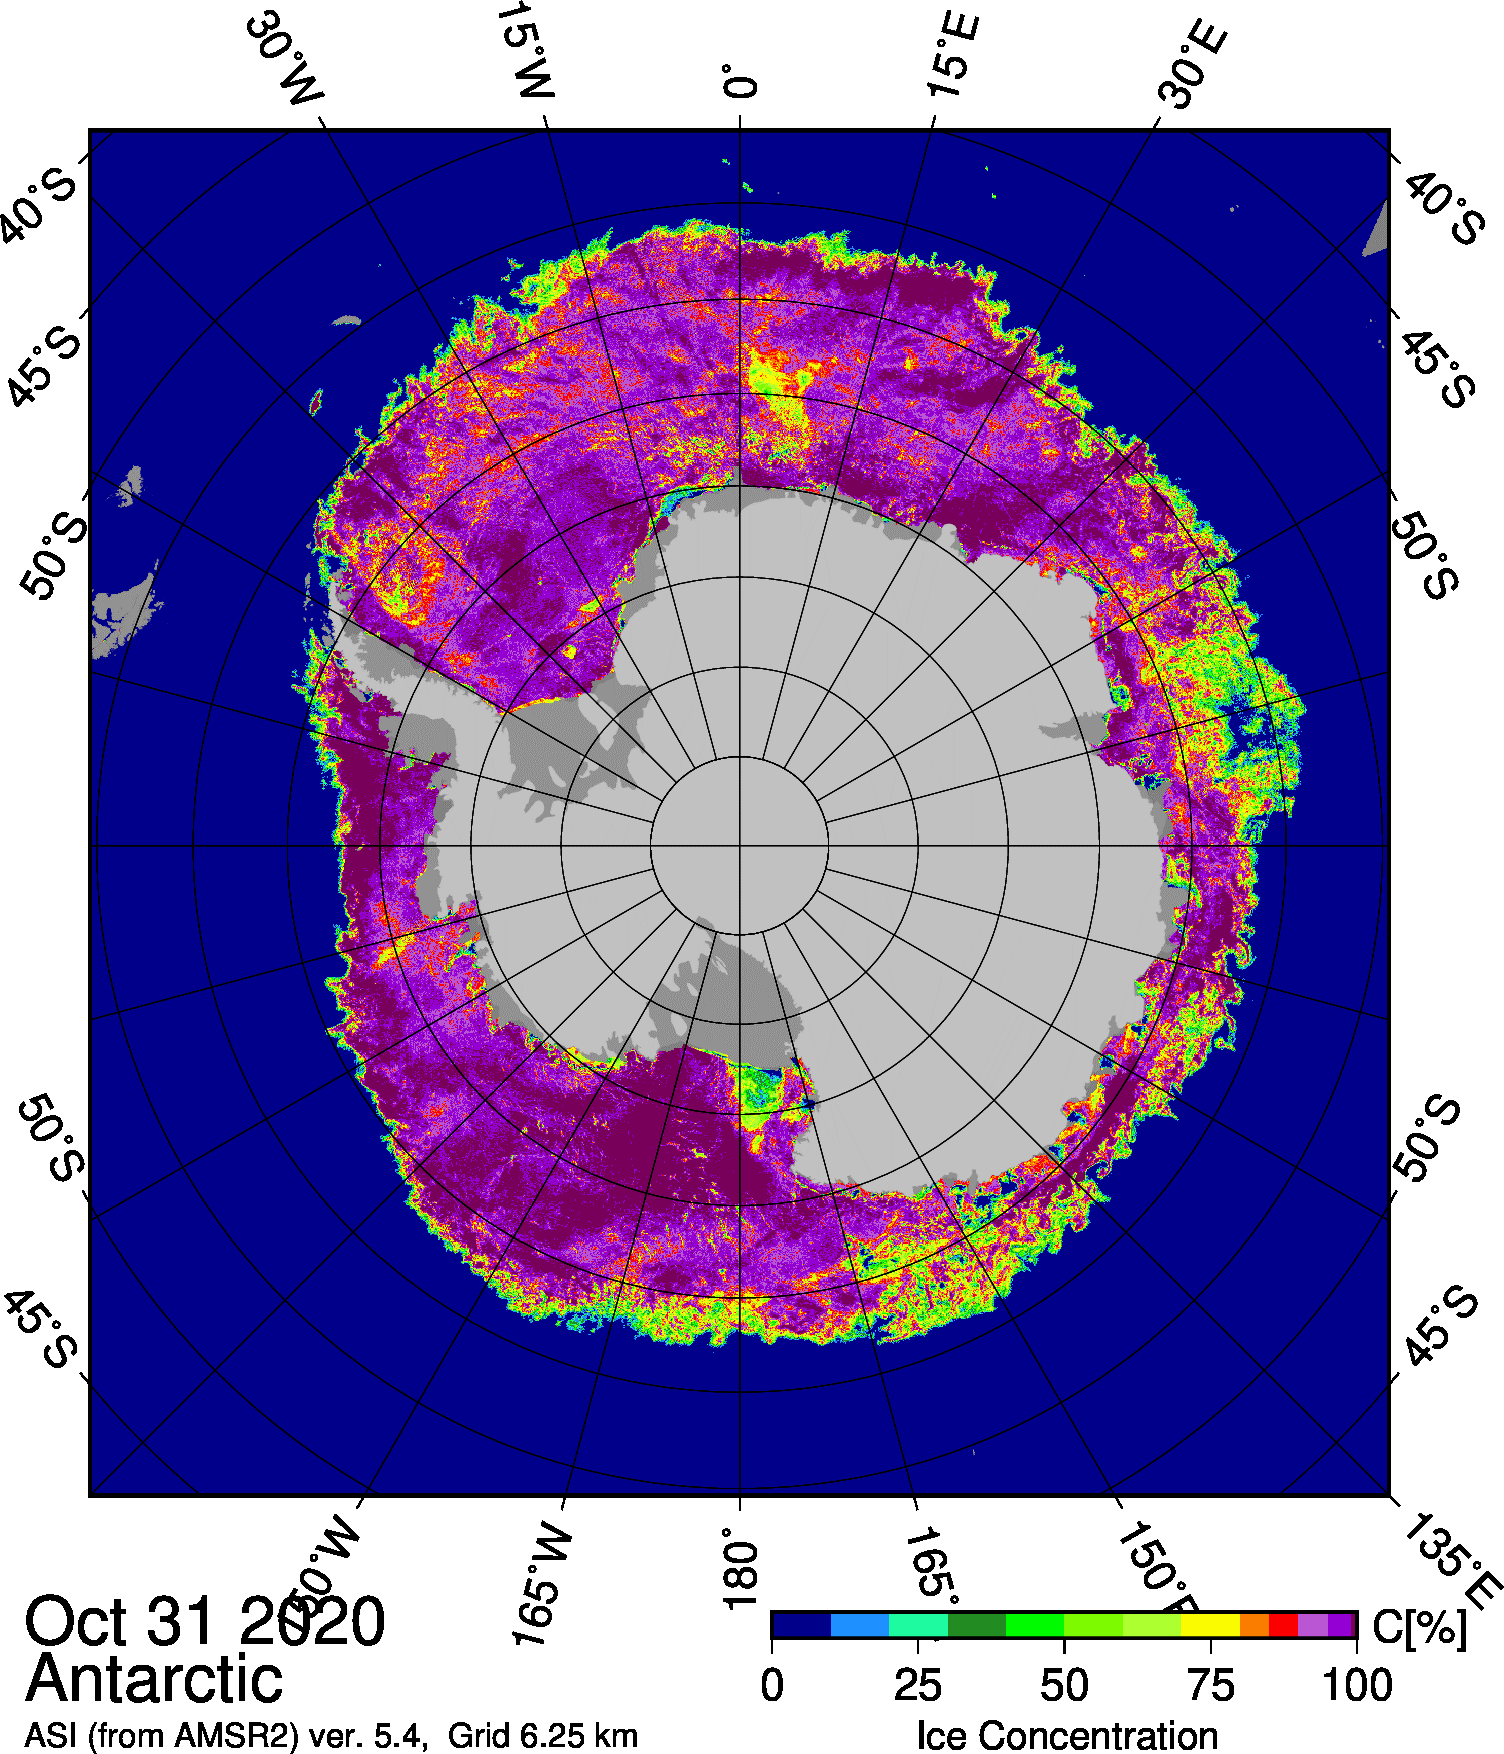
Figure 6. This figure shows the Japanese Aerospace Exploration Agency (JAXA) Advanced Microwave Scanning Radiometer 2 (AMSR2) sea ice concentration for Antarctic sea ice on October 31, 2020. Antarctic sea ice extent reached its seasonal sea ice extent maximum of 18.95 million square kilometers (7.32 million square miles) on September 28, 2020. Sea Ice Index data. About the data
Credit: University of Bremen
High-resolution image
Antarctic sea ice extent reached its seasonal maximum of 18.95 million square kilometers (7.32 million square miles) on September 28, as was tentatively reported in the October post. The maximum extent was the eleventh highest in the satellite record. Since then, Antarctic sea ice has declined by 1.30 million square kilometers (502,000 million square miles), but at a rate slightly slower than the average, resulting in a slight increase in the difference between the daily sea ice extent and the 1981 to 2010 average. Sea ice extent is above average along a wide area of the Ross Sea and Wilkes Land coast, and in the Eastern Weddell Sea. It is slightly below average in the Bellingshausen and Amundsen Seas. Notably, in the last few days of the month, sea ice concentration dropped in the area of the Maud Rise and in an area near the front of the Amery Ice Shelf.

