Average sea ice extent for July 2017 ended up fifth lowest in the satellite record. This reflects weather conditions that were not favorable for ice loss. It will be important to monitor August 2017, as weather conditions and storm events during this month have been closely related to the seasonal minimum sea ice extent in the recent years.
Overview of conditions
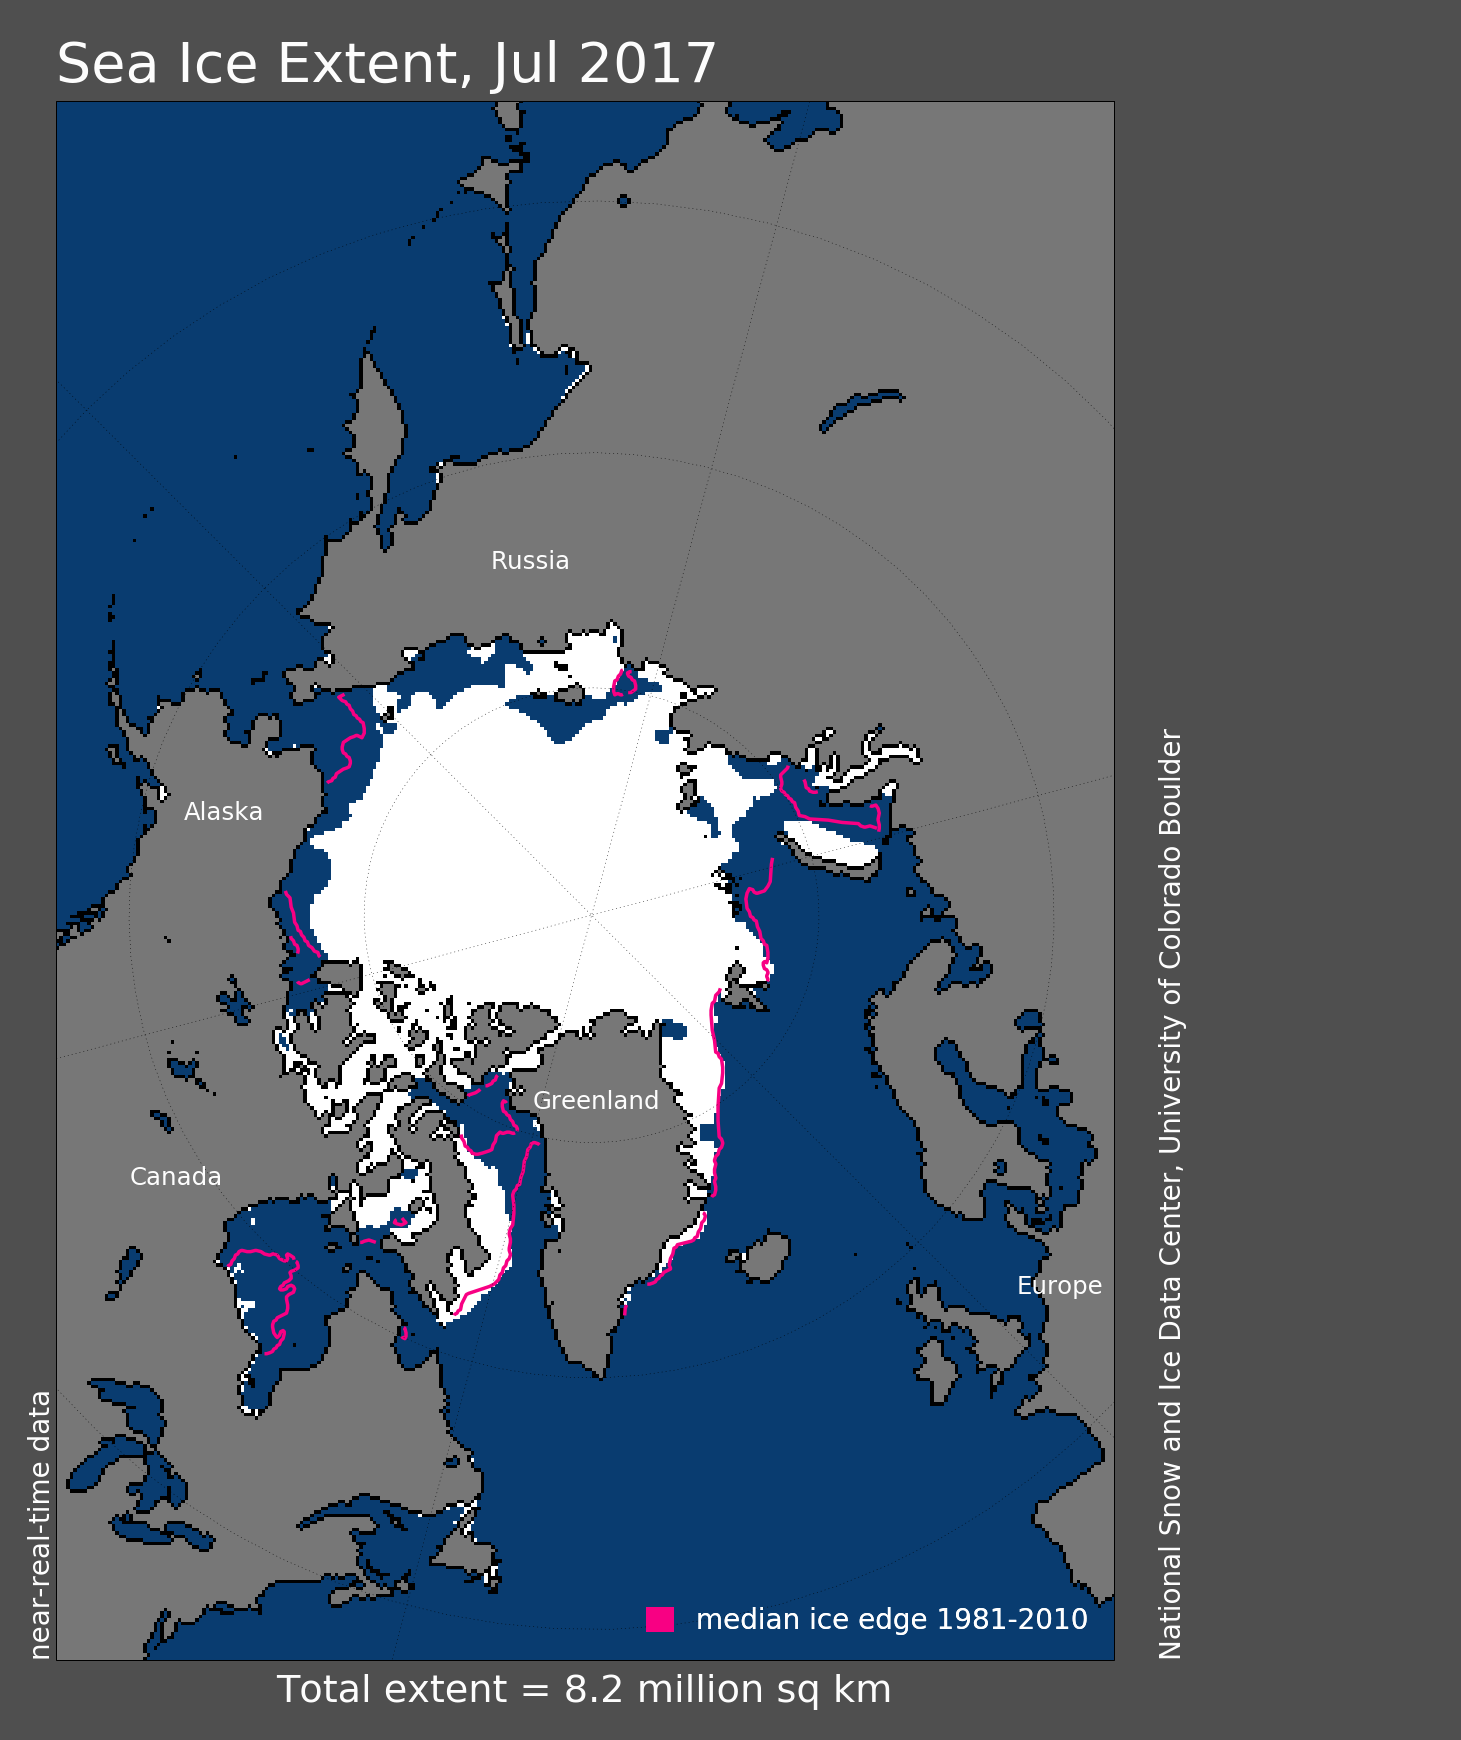
Figure 1. Arctic sea ice extent for July 2017 was 8.21 million square kilometers (3.17 million square miles). The magenta line shows the 1981 to 2010 average extent for that month. Sea Ice Index data. About the data
Credit: National Snow and Ice Data Center
High-resolution image
Arctic sea ice extent for July 2017 averaged 8.21 million square kilometers (3.17 million square miles), the fifth lowest July in the 1979 to 2017 satellite record. The average July extent was 1.58 million square kilometers (610,000 square miles) below the 1981 to 2010 long-term average, and 270,000 square kilometers (104,000 square miles) above the previous record low July set in 2011. July 2017 tracked 250,000 square kilometers (97,000 square miles) above the July 2012 extent and 20,000 square kilometers (7,700 square miles) above the July 2007 extent.
Ice extent was lower than average over most of the Arctic, particularly on the Pacific side where the ice retreated throughout July in the Beaufort, Chukchi, and East Siberian Seas. In the eastern Beaufort Sea on the other hand, extent slightly expanded during July. This may relate to the cyclonic (counterclockwise) pattern of winds favoring the drift of sea ice into the region.
Conditions in context
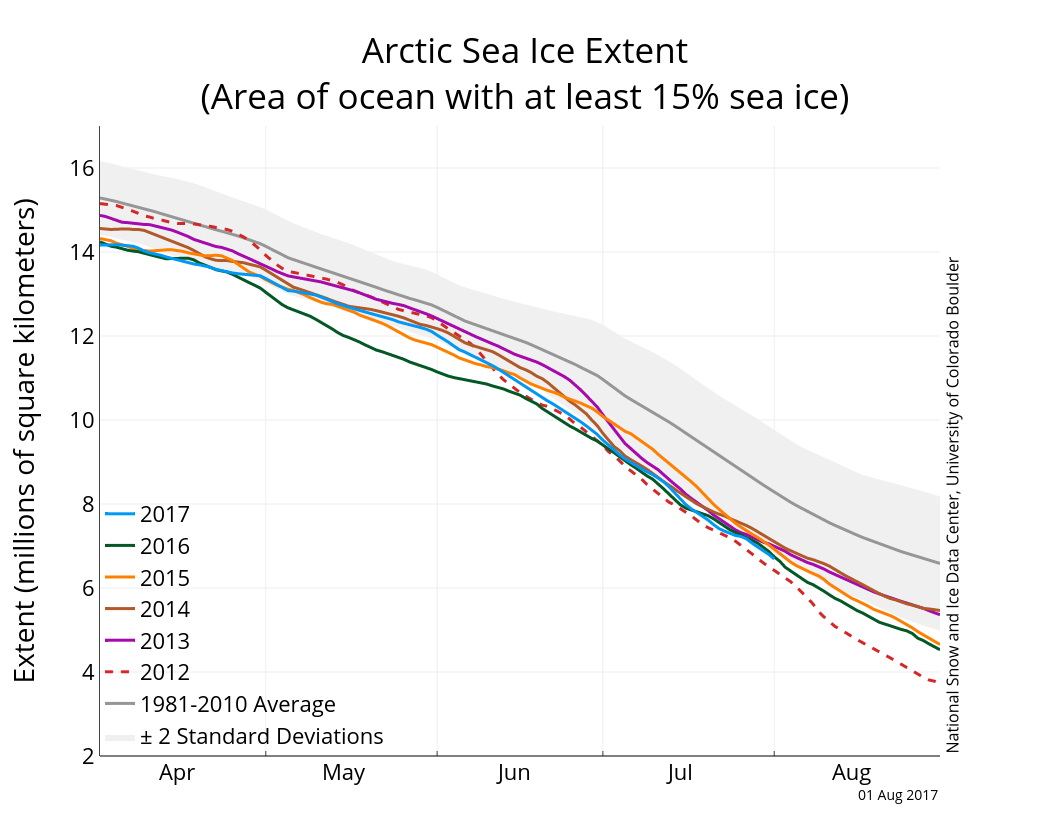
Figure 2a. The graph above shows Arctic sea ice extent as of August 1, 2017, along with daily ice extent data for five previous years. 2017 is shown in blue, 2016 in green, 2015 in orange, 2014 in brown, 2013 in purple, and 2012 in dotted red. The 1981 to 2010 median is in dark gray. The gray areas around the median line show the interquartile and interdecile ranges of the data. Sea Ice Index data.
Credit: National Snow and Ice Data Center
High-resolution image
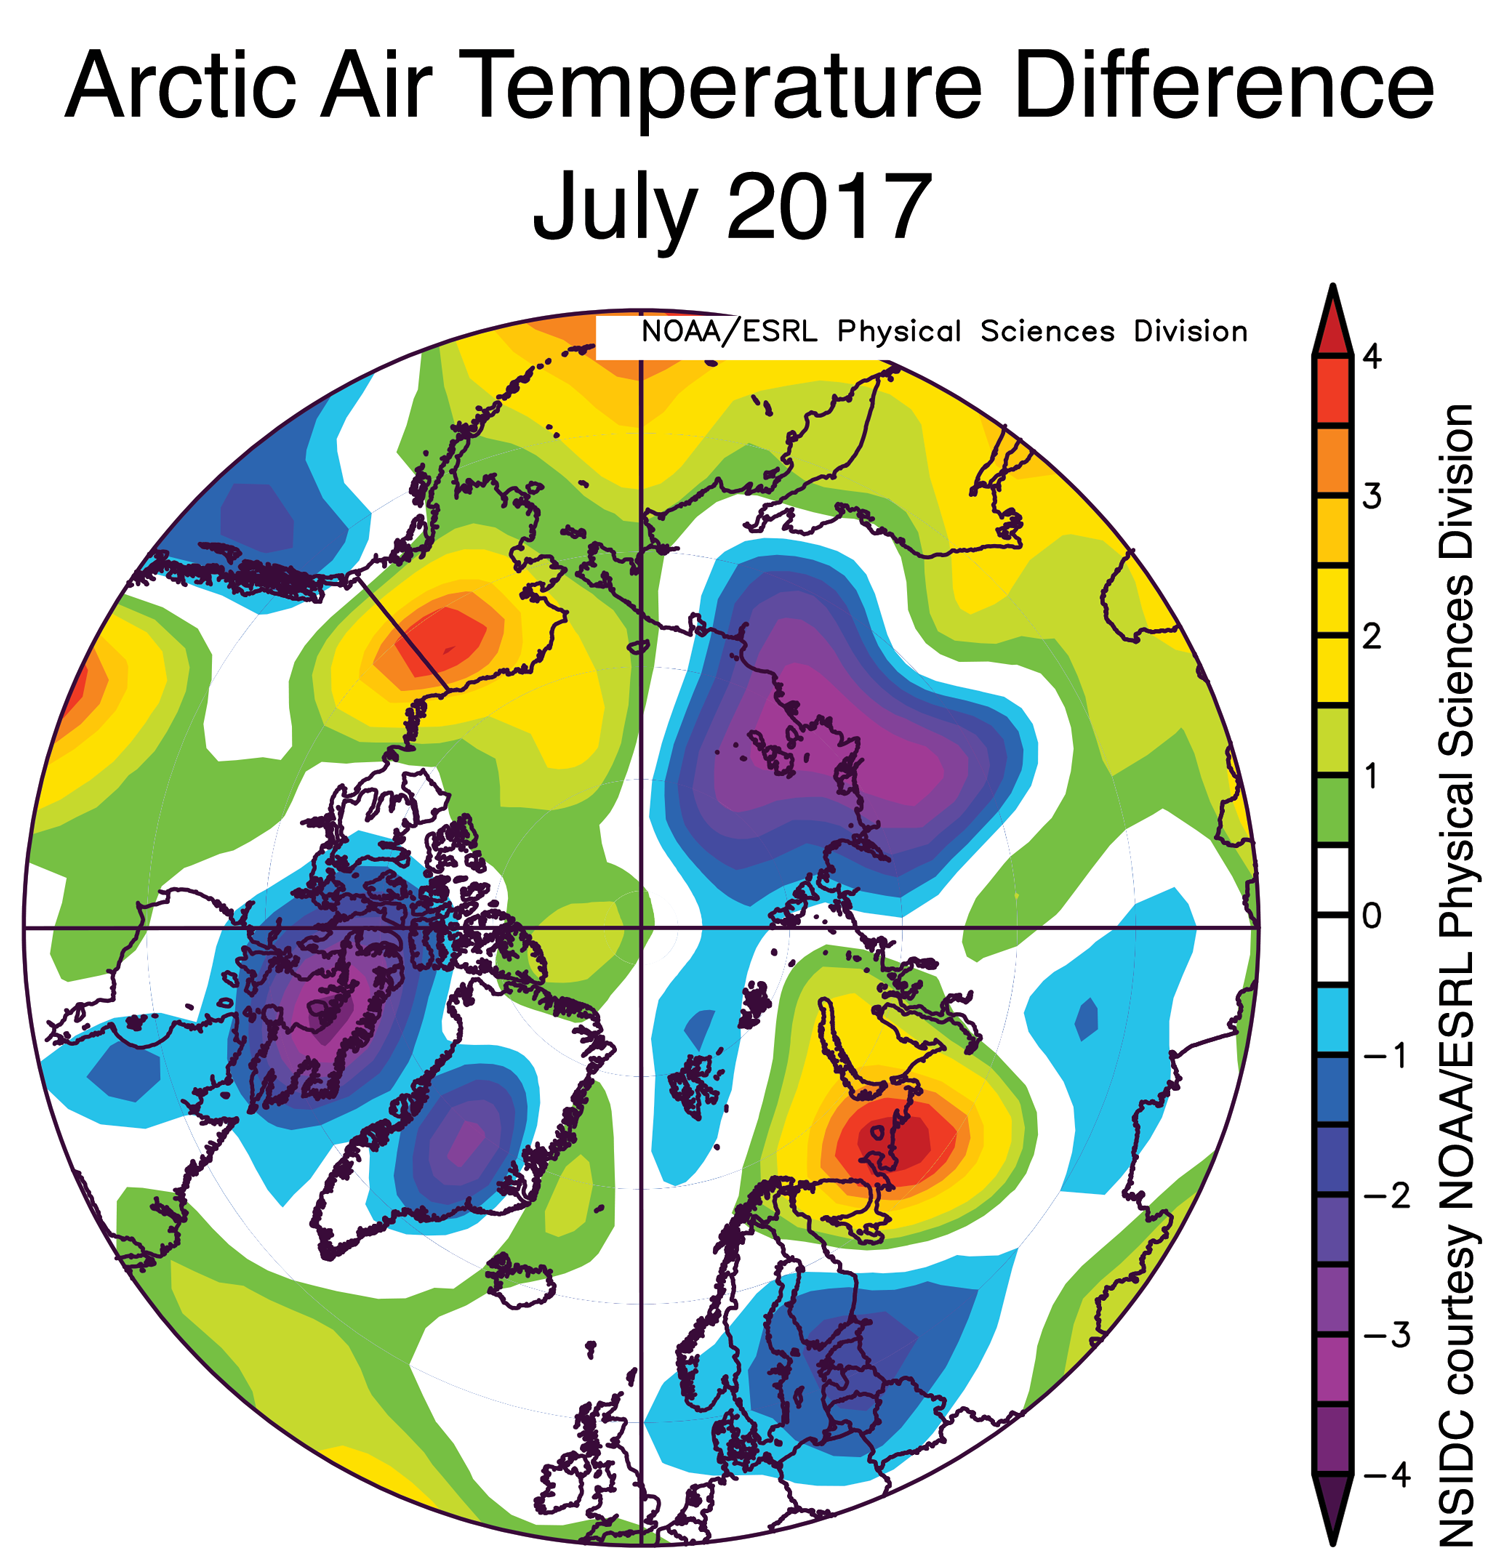
Figure 2b. The plot shows Arctic air temperature differences relative to the 1981 to 2010 long-term average at the 925 hPa level (about 2,500 feet above sea level) in degrees Celsius. Yellows and reds indicate higher than average temperatures; blues and purples indicate lower than average temperatures.
Credit: NSIDC courtesy NOAA Earth System Research Laboratory Physical Sciences Division
High-resolution image
The air temperature pattern over the Arctic was rather complex in July. Temperatures were above average over Alaska, extending into the Beaufort Sea (1 to 2 degrees Celsius or 2 to 4 degrees Fahrenheit) and the Kara and Barents Seas (2 to 4 degrees Celsius or 4 to 7 degrees Fahrenheit). By contrast, temperatures were 2 to 4 degrees Celsius (4 to 7 degrees Fahrenheit) lower than average over Greenland, East Central Siberia, and the Laptev Sea. The air pressure pattern at sea level was dominated by a broad area of low pressure covering most of the Arctic Ocean, with the lowest pressures centered just south of the Pole and west of the date line. Another locus of low pressure was centered over the southern Canadian Arctic Archipelago.
A cyclonic circulation over the central Arctic Ocean is generally viewed as unfavorable for rapid summer ice loss. Ice loss rates tend to be higher when the central Arctic Ocean is dominated by high pressure during summer.
July 2017 compared to previous years

Figure 3. Monthly July ice extent for 1979 to 2017 shows a decline of 7.4 percent per decade.
Credit: National Snow and Ice Data Center
High-resolution image
The linear rate of decline for July 2017 was 72,500 square kilometers (28,000 square miles) per year, or 7.4 percent per decade.
Onset of surface melt
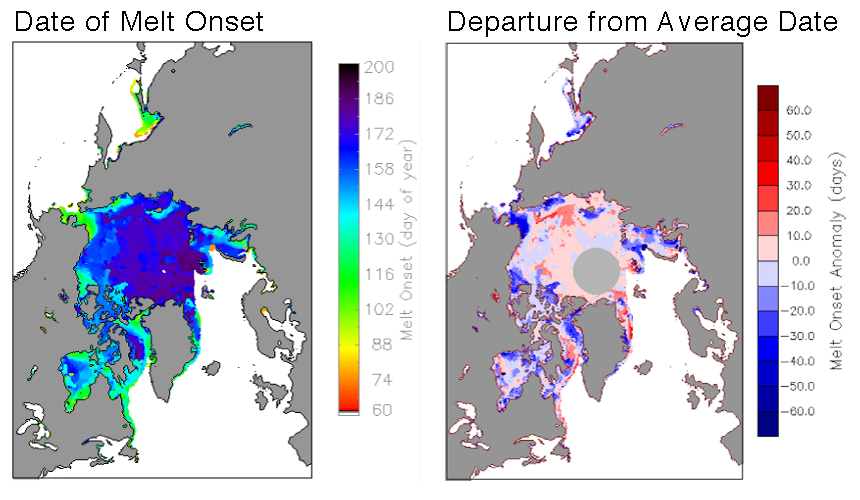
Figure 4. The plot on the left shows the average melt onset dates in day of the year. Warm colors indicate early melt onset and cooler colors indicate a later melt onset. The plot on the right shows departures from the average melt onset dates in number of days. Warmer colors indicate later than average melt onset and cooler colors indicate earlier than average melt onset.
Credit: National Snow and Ice Data Center
High-resolution image
One important influence on the pace of summer sea ice retreat is the timing of the onset of surface melt. Surface melt drops the albedo, allowing more solar radiation to be absorbed at the surface. The onset of surface melt in 2017 was quite early in the Chukchi and Eastern Beaufort Seas—as much as 35 days earlier than the 1981 to 2010 average. Early melt was also seen in the Kara Sea, Baffin Bay, and Canadian Arctic Archipelago (10 to 20 days earlier than average). However, over a large portion of the Arctic Ocean’s central ice pack, melt onset was a few days later than average. Melt onset was up to ten days later than average in the polar areas at the northern extents of the Beaufort and East Siberian Seas. The spatial pattern in the timing of melt onset reflects the combination of the warm winter and early spring conditions along the edge of the pack on the Pacific side, very warm winter conditions in the Barents and Kara Sea areas, and relatively cool late spring to early summer conditions over the central Arctic Ocean.
Sea ice predictions for the 2017 minimum
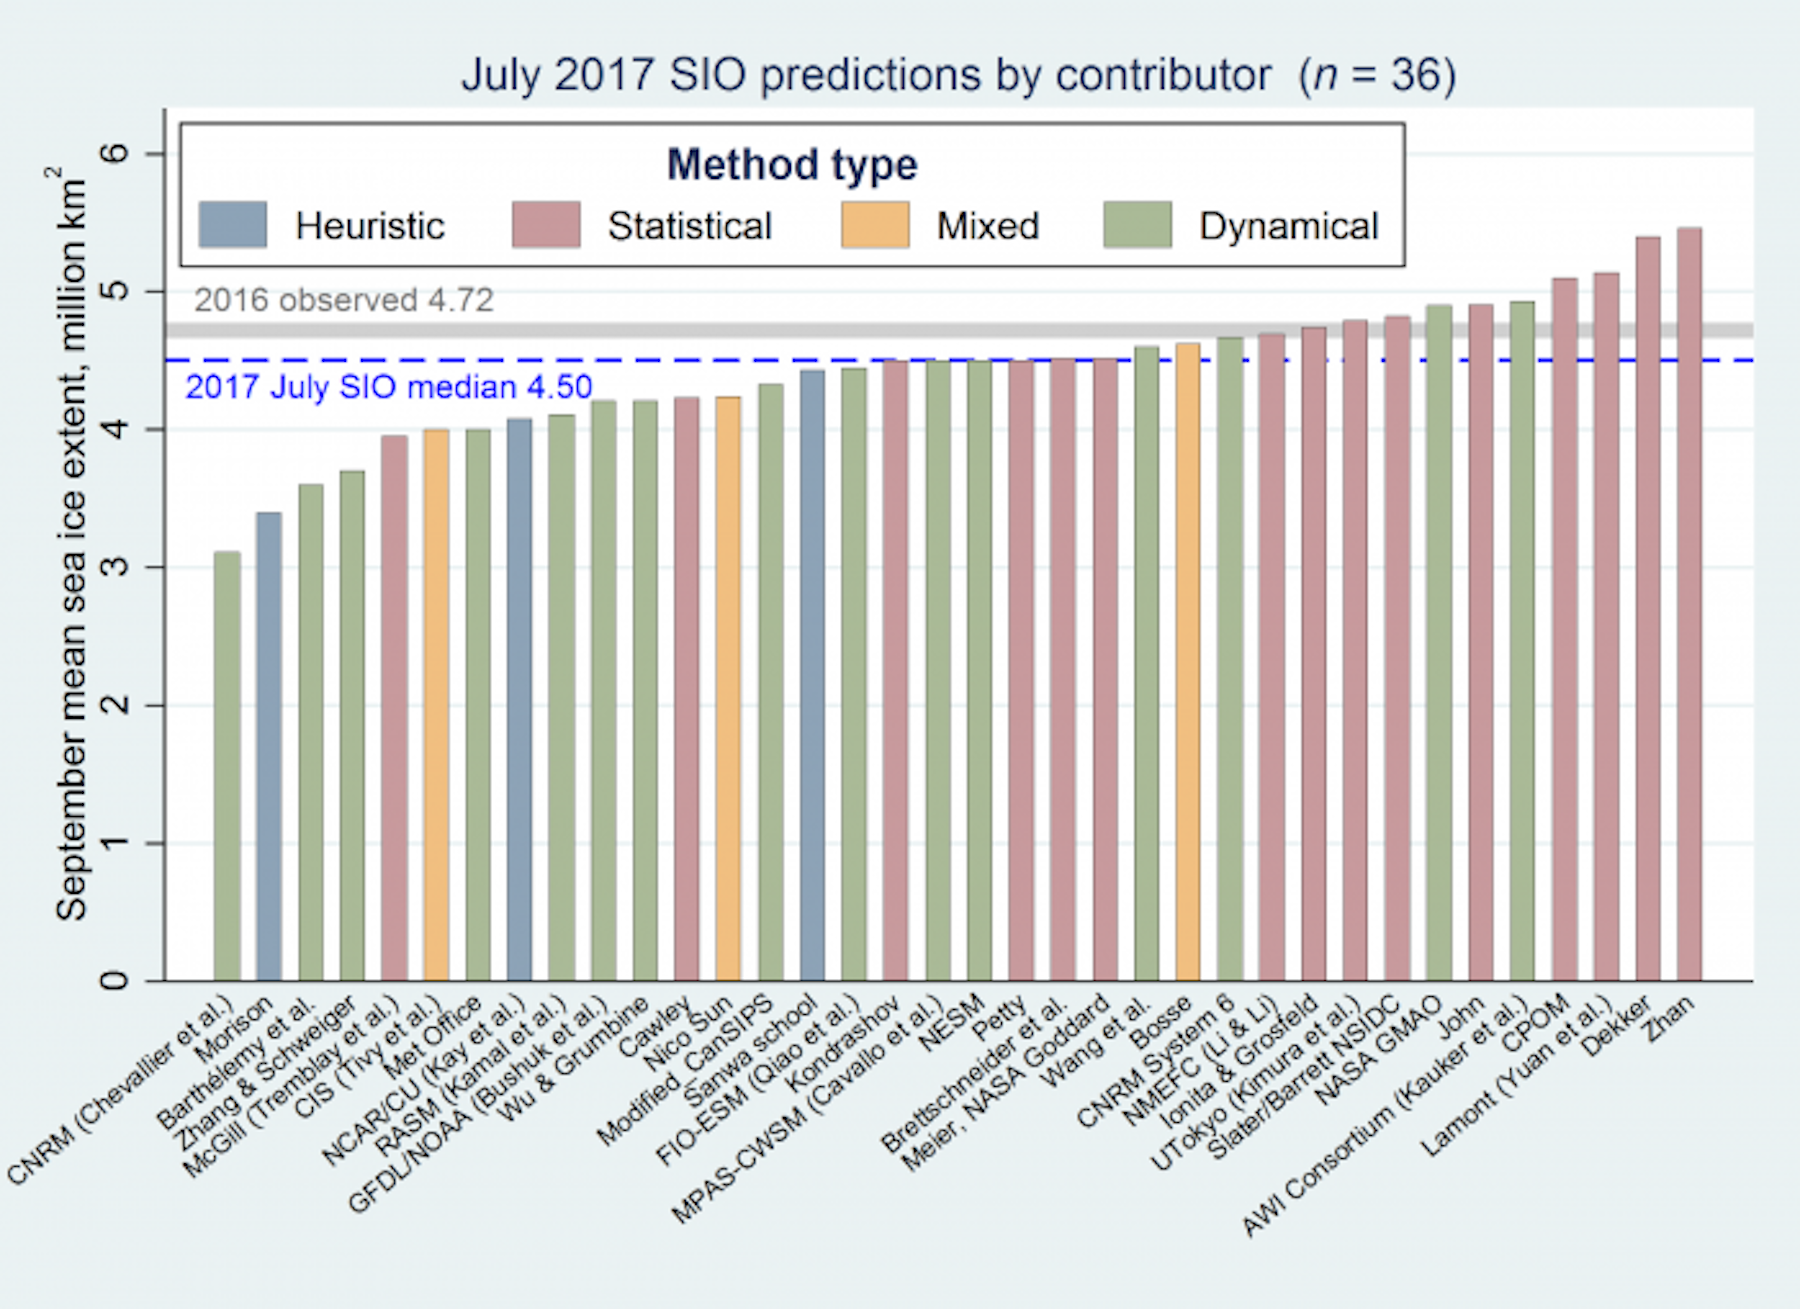
Figure 5. This chart summarizes the 2017 summer September minimum forecasts from 36 different models and approaches to predicting the evolution of the Arctic pack.
Credit: SIPN/ARCUS
High-resolution image
A report released by the Sea Ice Prediction Network (SIPN), an activity of the Arctic Research Council of the United States (ARCUS), compiled 36 forecasts of September average sea ice extent that were submitted during July. Additionally, SIPN produces estimates for sea ice extent in the Alaska region and, new this year, for the Antarctic sea ice maximum (not shown). The September Arctic extent forecasts range from a new record low of 3.1 million square kilometers (1.2 million square miles) to an eleventh lowest extent of 5.5 million square kilometers (2.1 million square miles). The median of the estimates is slightly below the September 2016 value, currently the fifth lowest. A variety of methods are used to make these forecasts, ranging from coupled ice-ocean-atmospheric models to statistical approaches and heuristic guesses. NSIDC scientists Julienne Stroeve, Walt Meier, Andrew Barrett, Mark Serreze, and the late Drew Slater have regularly contributed to several separate estimations for the SIPN.
Sea ice retreat may be changing the AMOC
In the far northern Atlantic, warm water flowing northward from the tropics is cooled by the atmosphere, becomes denser, and eventually sinks to great depths. The descending water is key in driving a sub-surface and surface ocean circulation system called the Atlantic Meridional Overturning Circulation (AMOC), which is part of the global ocean conveyor belt of heat and salinity. Where the Atlantic water sinks has a very important effect on the climate of Northern Europe; the heat that the ocean loses to the atmosphere is what keeps Northern Europe quite warm relative to its latitude. For example, Amsterdam is at the same latitude as Winnipeg, Canada, but experiences much warmer winters.
Based on a recent modeling study, Florian Sévellec and colleagues propose that the ongoing loss of Arctic sea ice may disrupt the AMOC. The sea ice loss leads to a freshening of the northern North Atlantic and stronger heat absorption at the surface. This means that waters in the northern North Atlantic are less dense than they used to be, which has the effect of providing a cap, or lid, that may inhibit the northward flow of warm waters at the surface and the eventual sinking of these waters. The authors suggest that the Arctic sea ice decline may help to explain observations suggesting that the AMOC may be slowing down, and why there is a regional minimum in warming (sometimes called the Warming Hole) over the subpolar North Atlantic.
Further reading
Sea Ice Prediction Network. “2017: July Report.” Arctic Research Council of the United States. https://www.arcus.org/sipn/sea-ice-outlook/2017/july.
Sévellec, F., A. V. Fedorov, and W. Liu. 2017. Arctic sea-ice decline weakens the Atlantic Meridional Overturning Circulation. Nature Climate Change, doi:10.1038/nclimate3353.

