After setting satellite-era record lows during winter, Arctic sea ice extent declined at a steady but somewhat sluggish pace during May. However, ice has retreated at a record rate in the Chukchi Sea, and open water extended to Barrow, Alaska. In the Southern Hemisphere, ice extent continues its seasonal expansion, but extent remains well below the long-term average for this time of year.
Overview of conditions
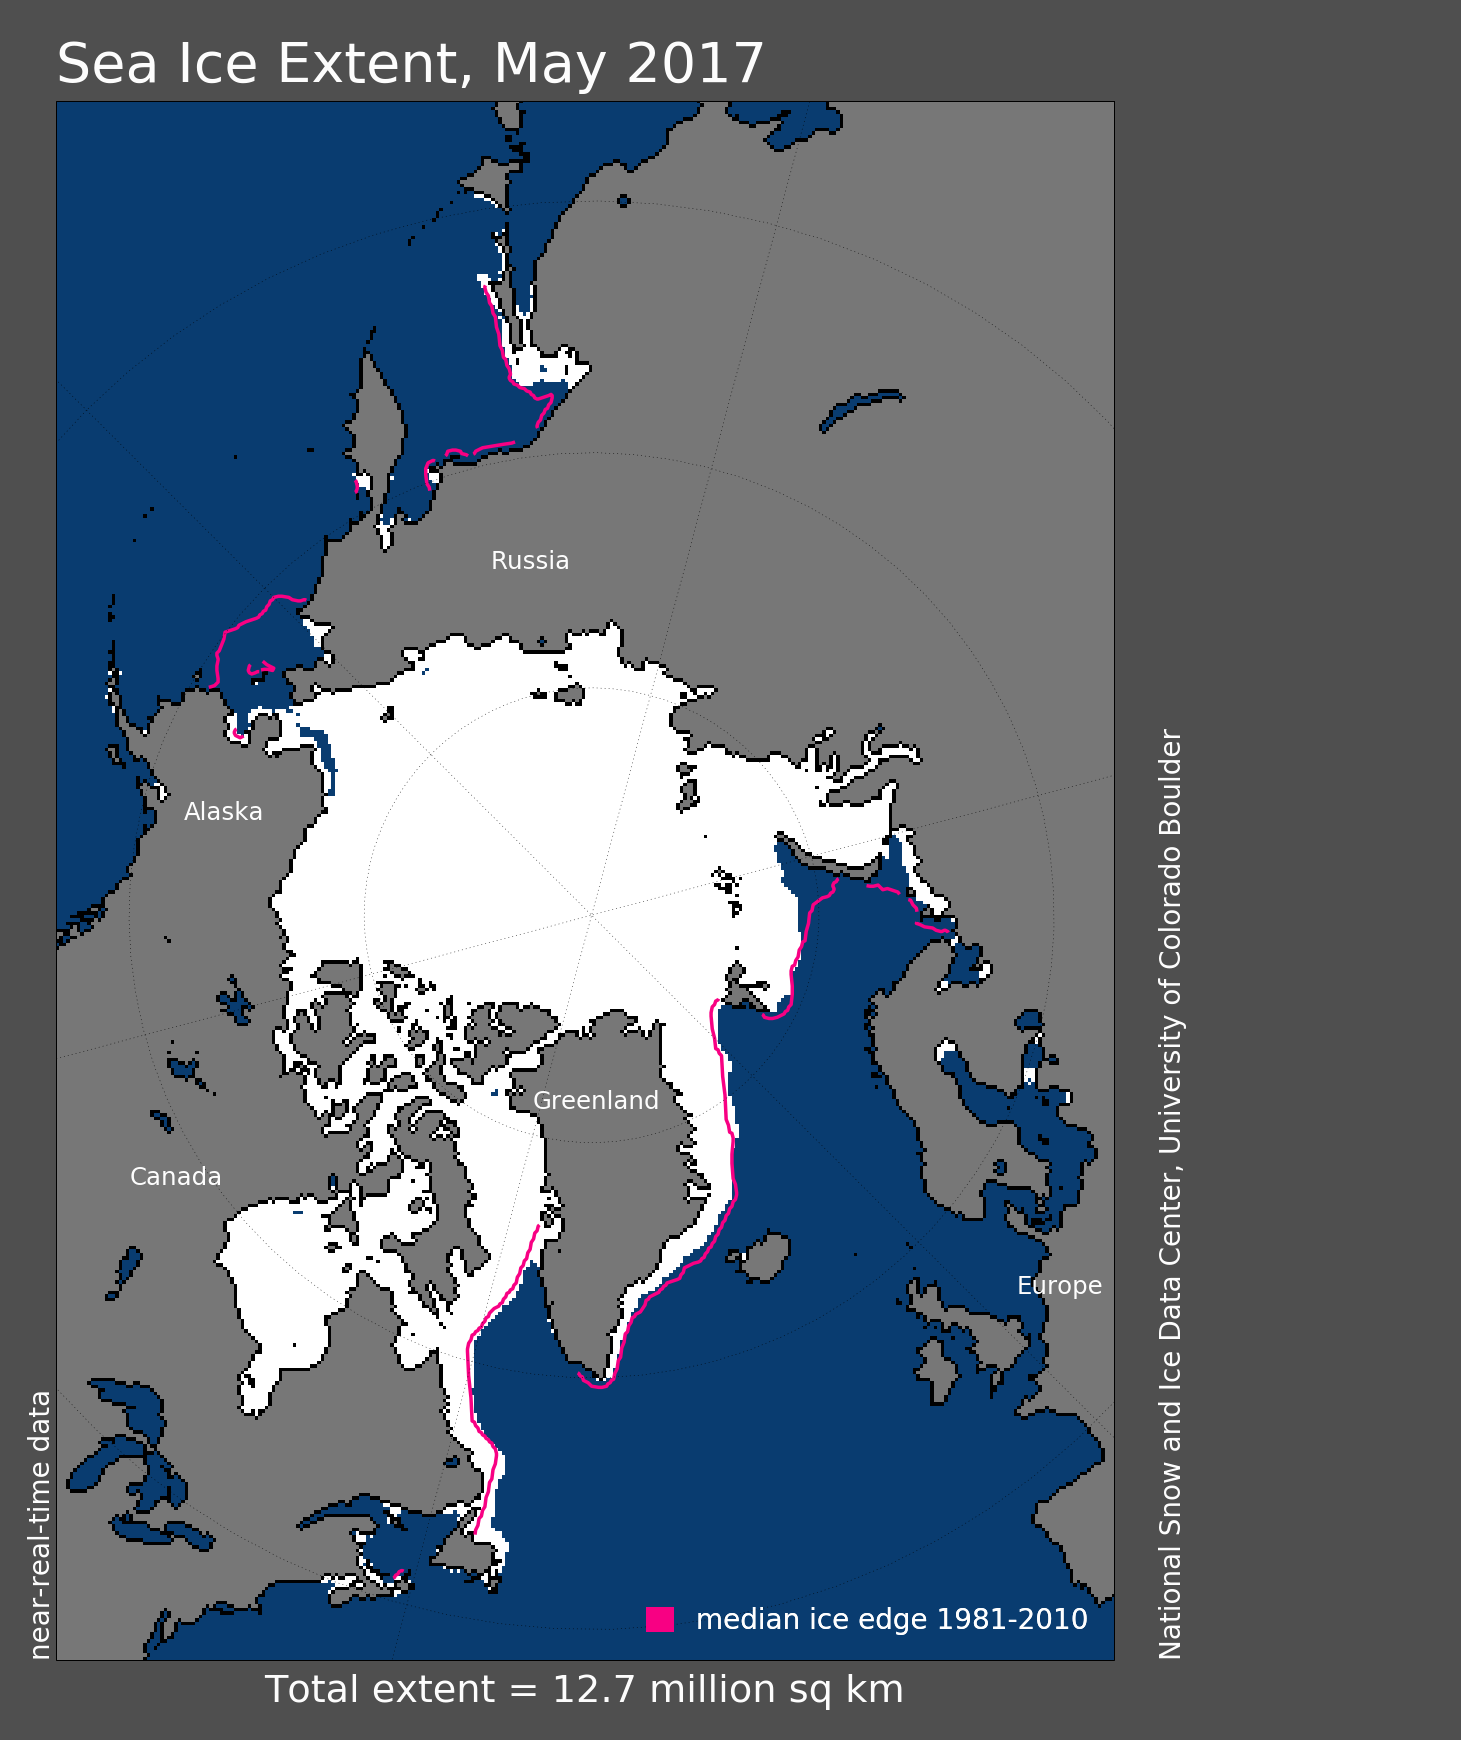
Figure 1. Arctic sea ice extent for May 2017 was 12.74 million square kilometers (4.92 million square miles). The magenta line shows the 1981 to 2010 average extent for that month. Sea Ice Index data. About the data
Credit: National Snow and Ice Data Center
High-resolution image
Arctic sea ice extent for May 2017 averaged 12.74 million square kilometers (4.92 million square miles), the fourth lowest in the 1979 to 2017 satellite record. This contrasts strongly with the past several months, when extent tracked at satellite-era record lows. May 2017 extent was 710,000 square kilometers (274,000 square miles) below the 1981 to 2010 long-term average, and 660,000 square kilometers (255,000 square miles) above the previous record low set in 2016. Sea ice extent remained below average in the Pacific sector of the Arctic and in the Barents Sea, but was slightly above average in Baffin Bay and Davis Strait towards the Labrador Sea. Ice extent was at average levels in the Greenland Sea. In the Chukchi Sea, extent was at record low levels for May.
Conditions in context
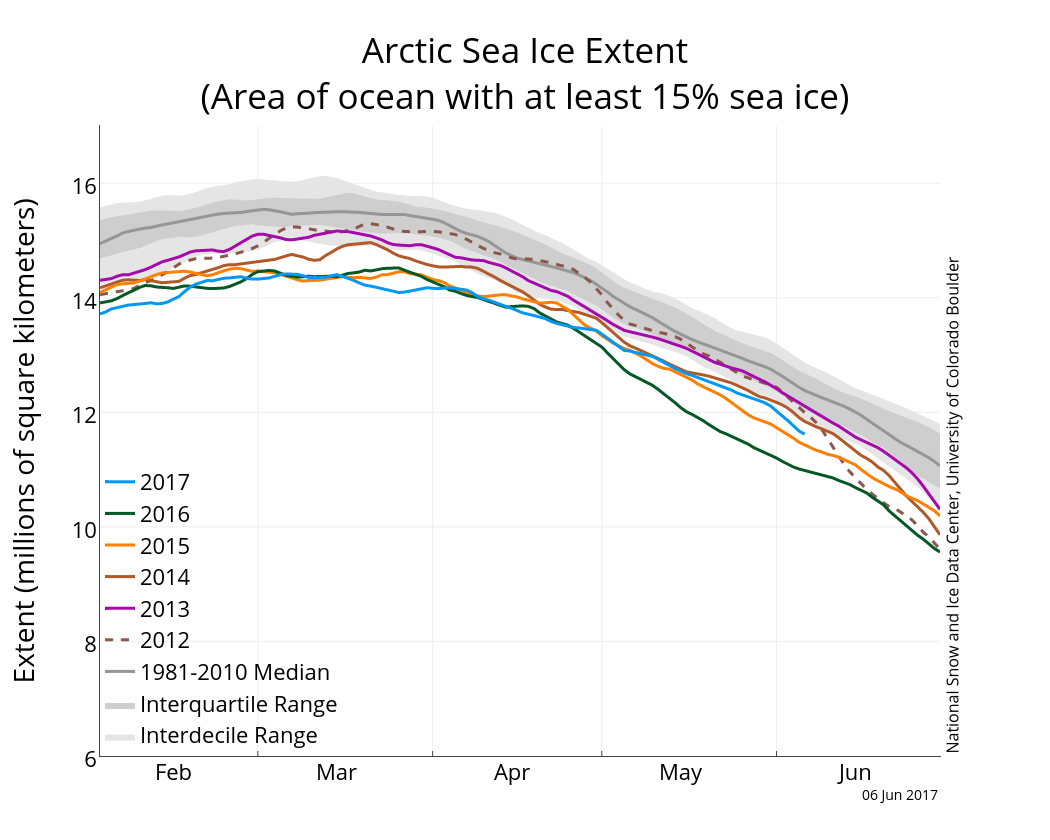
Figure 2a. The graph above shows Arctic sea ice extent as of June 6, 2017, along with daily ice extent data for five previous years. 2017 is shown in blue, 2016 in green, 2015 in orange, 2014 in brown, 2013 in purple, and 2012, the record low year, as a dashed line. The 1981 to 2010 median is in dark gray. The gray areas around the median line show the interquartile and interdecile ranges of the data. Sea Ice Index data.
Credit: National Snow and Ice Data Center
High-resolution image
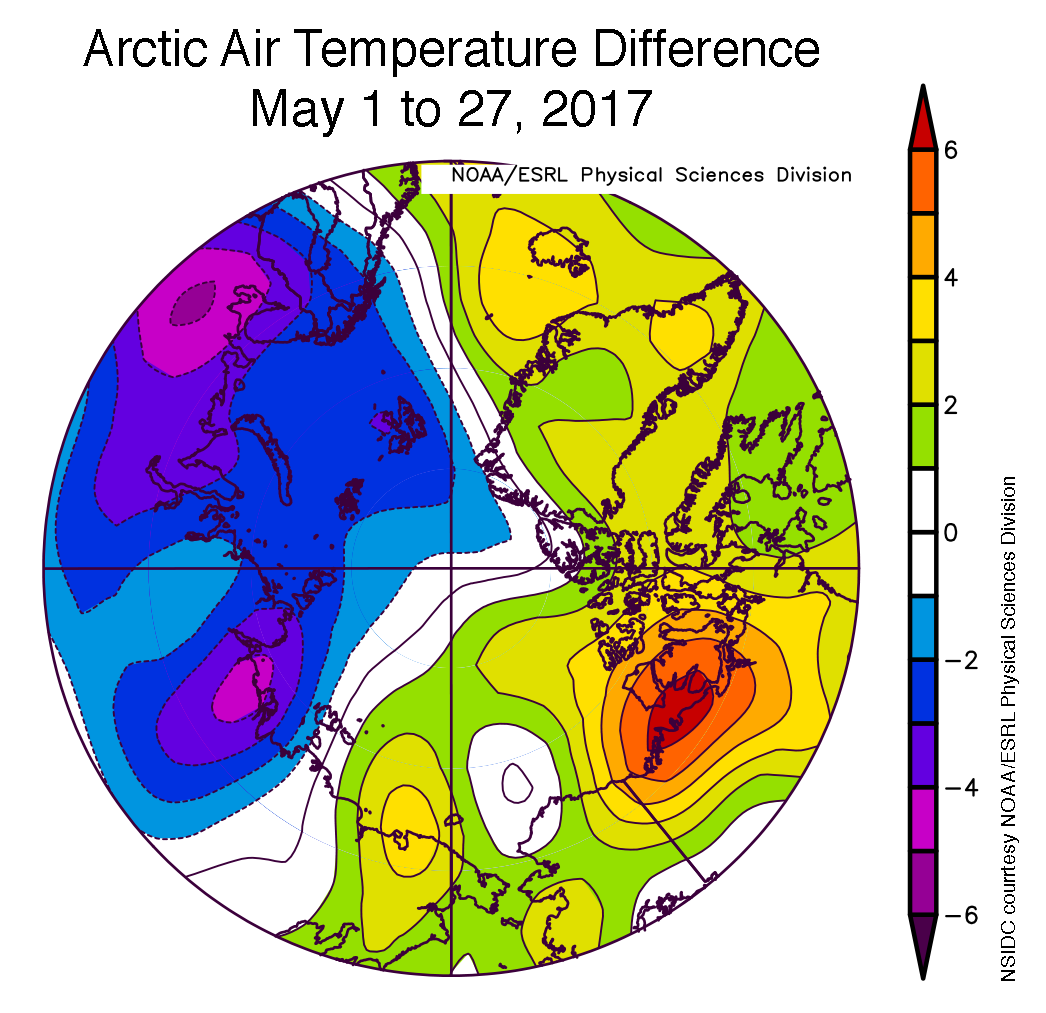
Figure 2b. The plot shows differences from average for Arctic air temperatures from May 1 to 27, 2017 at the 925 hPa level (about 2,500 feet above sea level) in degrees Celsius. Yellows and reds indicate higher than average temperatures; blues and purples indicate lower than average temperatures.
Credit: NSIDC courtesy NOAA ESRL Physical Sciences Division
High-resolution image
For the Arctic as a whole, the rate of decline in Arctic sea ice extent through May was relatively slow. The May 2017 rate of decline was 42,800 square kilometers (16,500 square miles) per day, compared to the 1981 to 2010 average of 46,990 square kilometers (18,143 square miles) per day.
Sea ice was especially slow to retreat in the Atlantic sector of the Arctic, with little change in the ice edge in Baffin Bay and Davis Strait. The ice edge expanded in the Barents and Greenland Seas until the end of May, when the ice finally started to retreat. Most of the ice retreat in May occurred within the Pacific sector, particularly within the Sea of Okhotsk, and the Bering and Chukchi Seas.
Overall, air temperatures at the 925 hPa level were 2 to 4 degrees Celsius (4 to 7 degrees Fahrenheit) below average over Eurasia and extending over the Barents, Kara and Laptev Seas, and 1 to 4 degrees Celsius (2 to 7 degrees Fahrenheit) above average over the East Siberian, Chukchi, and Beaufort Seas (Figure 2b).
May 2017 compared to previous years
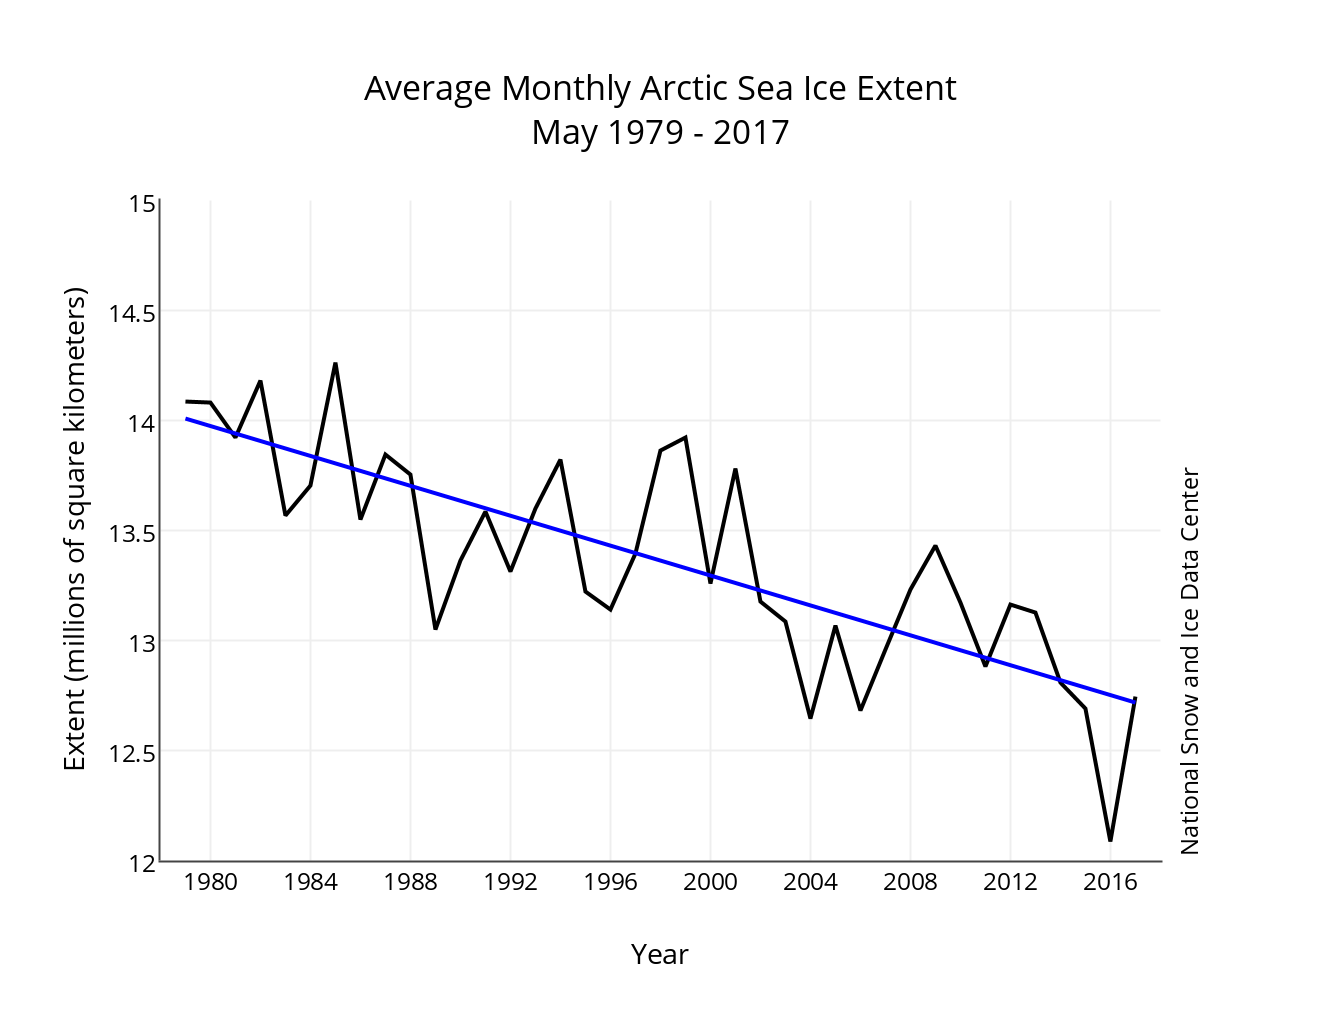
Figure 3. Monthly May ice extent for 1979 to 2017 shows a decline of 2.5 percent per decade.
Credit: National Snow and Ice Data Center
High-resolution image
The linear rate of decline for May is 33,900 square kilometers (13,100 square miles) per year, or 2.5 percent per decade.
Low ice in the Chukchi Sea
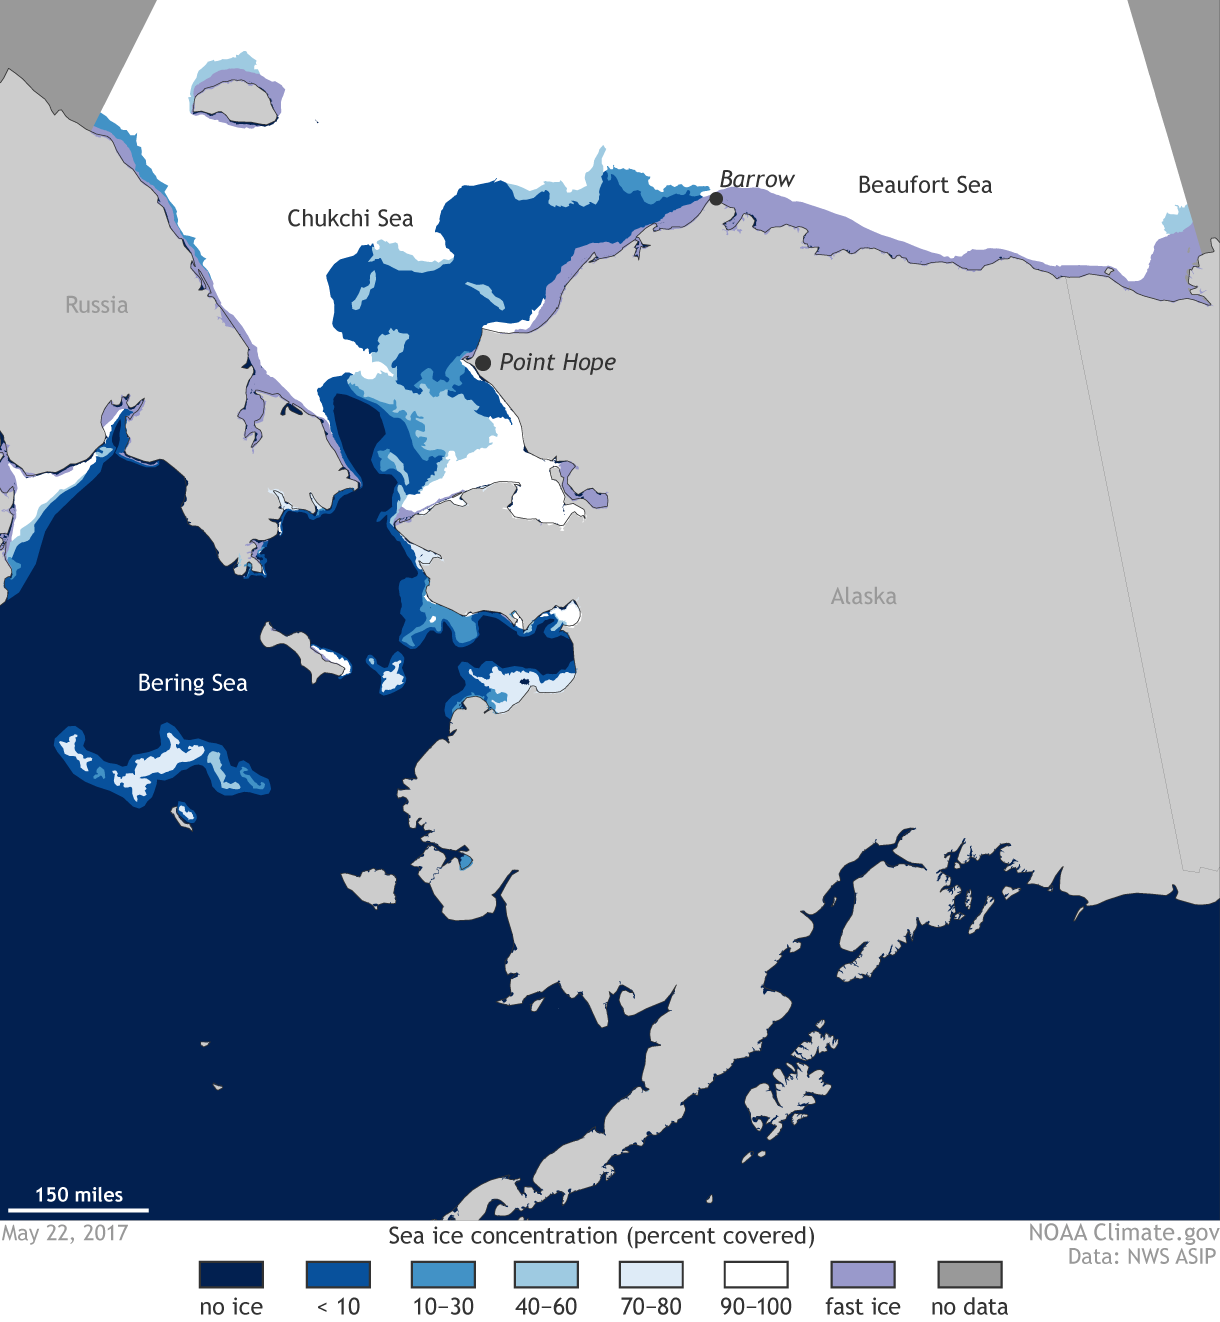
Fig. 4a. This map shows sea ice concentration in percent coverage for the Alaska area on May 22, 2017.
Credit: NOAA National Weather Service Alaska Sea Ice Program
High-resolution image

Figure 4b. The plot shows daily May sea ice extent, in square kilometers, in the Chukchi Sea region for 2012 to 2017.
Credit: J. Stroeve/ NSIDC
High-resolution image

Figure 4c. The graph shows cumulative temperature departures from average for each year, in degrees Fahrenheit, for Barrow, Alaska from 1921 to May 2017.
Credit: Blake Moore, Alaska Climate Research Center
High-resolution image
Notably, sea ice within the Chukchi Sea retreated earlier than seen at any other time in the satellite data record. By the third week in May, open water extended all the way to Barrow, Alaska (Figure 4a). Figure 4b shows daily ice extent for May from 2012 onward in the Chuckchi Sea. The rapid retreat in 2017 stands out. A recent report by the National Oceanographic Atmospheric Administration (NOAA) indicates that the amount of open water north of 68o N at this time of year is unprecedented.
Part of the explanation for earlier open water formation in the Chukchi Sea is the unusually high air temperatures in that region during the previous winter. It is instructive to look at the cumulative temperature departure from average for Barrow, Alaska (Figure 4c). From 1921 until about 1989, conditions at Barrow actually got progressively cooler. However, since that time, temperatures have markedly increased.
Consistent with warm conditions, extensive open water in the Chukchi Sea region persisted into December; the delayed ice growth potentially led to thinner ice than usual in spring. In addition, strong winds from the north occurred for a few days at the end of March and early April, pushing ice southward in the Bering Sea, breaking up the ice in the Chukchi Sea, and even flushing some ice out through the Bering Strait. At the same time further east near Barrow, winds helped to push ice away from the coast. Based on recent work by NSIDC and the University of Washington, the pattern of spring sea ice retreat also suggests a role of strong oceanic heat inflow to the Chukchi Sea via Bering Strait.
Impacts of low Chukchi Sea on Alaskan communities
The ARCUS Sea Ice for Walrus Outlook (SIWO) provides weekly reports from April to June on sea ice conditions in the northern Bering Sea and southern Chukchi Sea regions of Alaska to support subsistence hunters and coastal communities. While the reports are not intended for operational planning or navigation, they provide detailed ice and weather observations for the region, some made by local community members, others from operational forecast centers. The most recent update on June 2nd discusses the continued rapid deterioration of sea ice between Wales and Shishmaref, Alaska. Nearly ice-free conditions around Nome, Alaska reflect warmer waters from the Bering Sea moving into the region. Some sea ice remains attached to the shore along the northeast coast of St. Lawrence Island, but the Bering Sea is essentially ice free. Prime walrus hunting for these communities is typically in May. However, when the ice retreats early, the walrus go with it, reducing the number of walrus the local communities can hunt.
Sea ice data and analysis tools
NSIDC has released a new set of tools for sea ice analysis and visualization. In addition to Charctic, our interactive sea ice extent graph, the new Sea Ice Data and Analysis Tools page provides access to Arctic and Antarctic sea ice data organized in seven different data workbooks, updated daily or monthly. Animations of September Arctic and Antarctic month average sea ice and concentrations may also be accessed from this page.
Further Reading
Serreze, M.C., Crawford, A., Stroeve, J. C., Barrett, A.P. and Woodgate, R.A. 2016. Variability, trends and predictability of seasonal sea ice retreat and advance in the Chukchi Sea. Journal of Geophysical Research, 121, doi:10.1002/2016JC011977.

