Ice extent in the Arctic was below average during November. There was substantially less ice than average in the northern Barents Sea, likely due to an influx of warm ocean waters and the persistence of a strong positive Arctic Oscillation (AO). In contrast, sea ice extent in Antarctica remained unusually high.
Overview of conditions

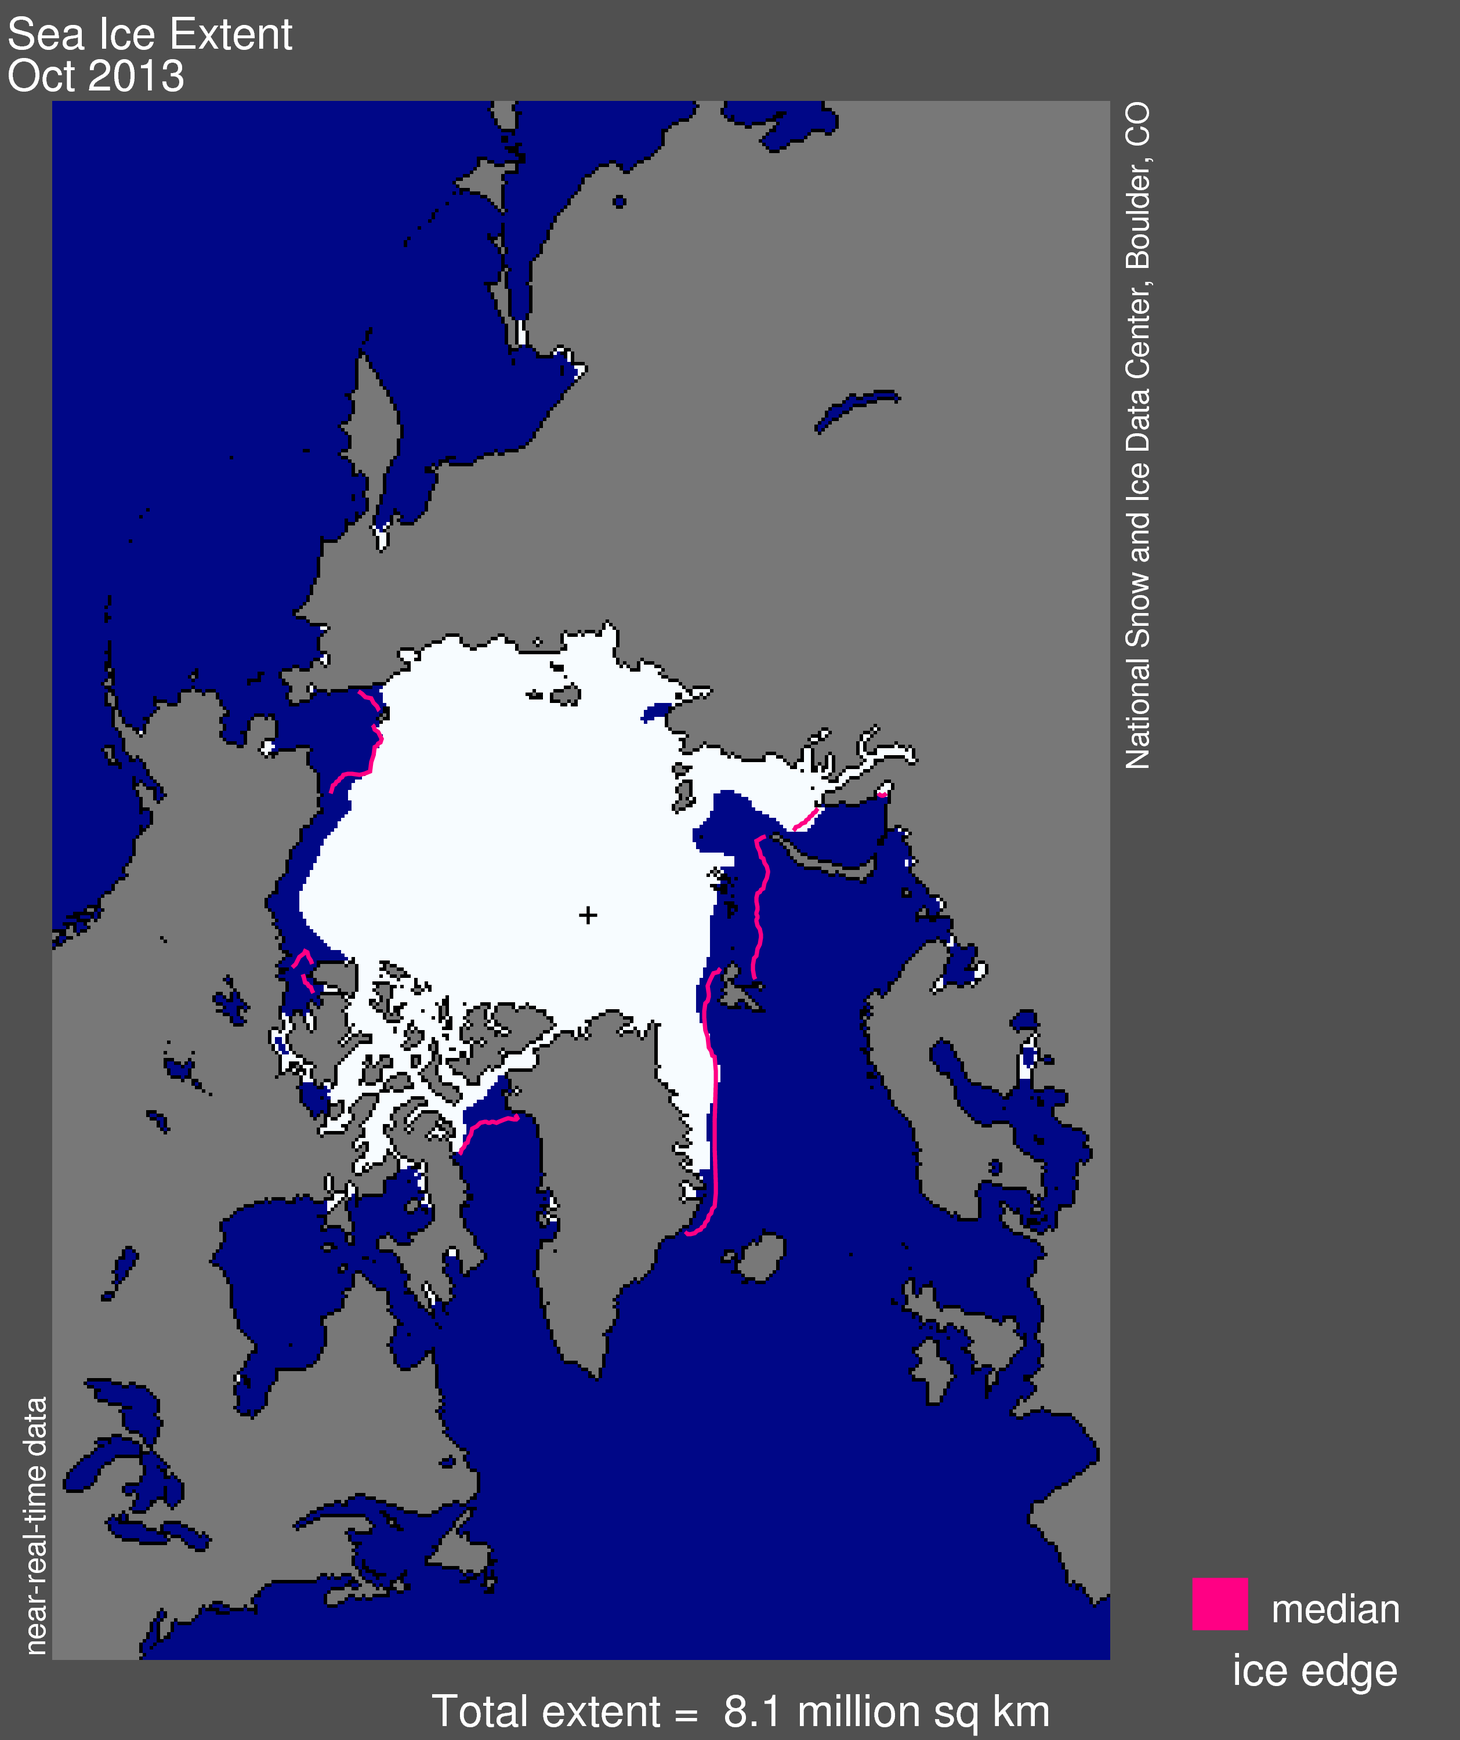
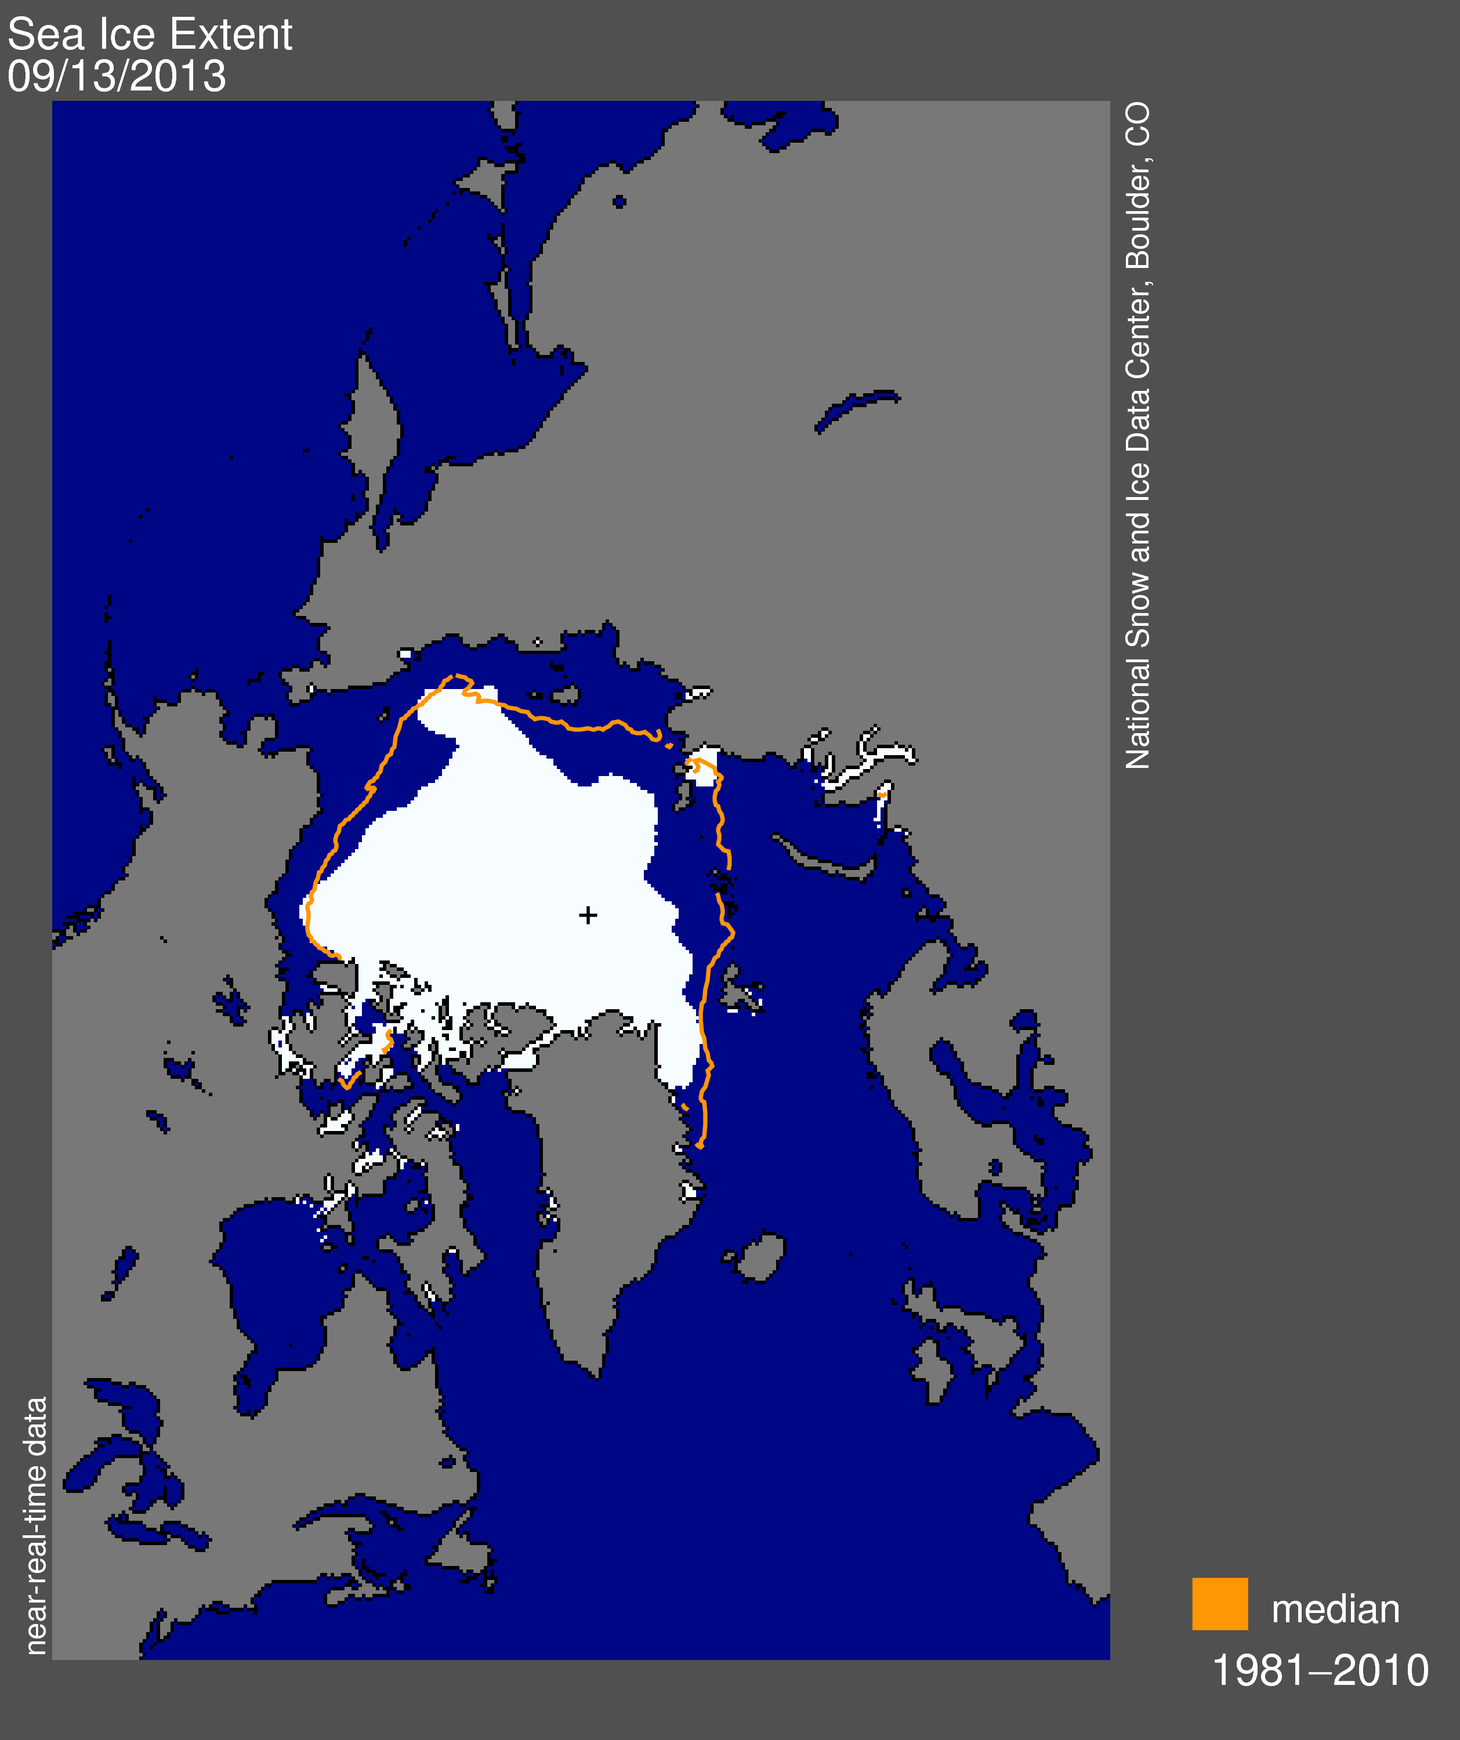
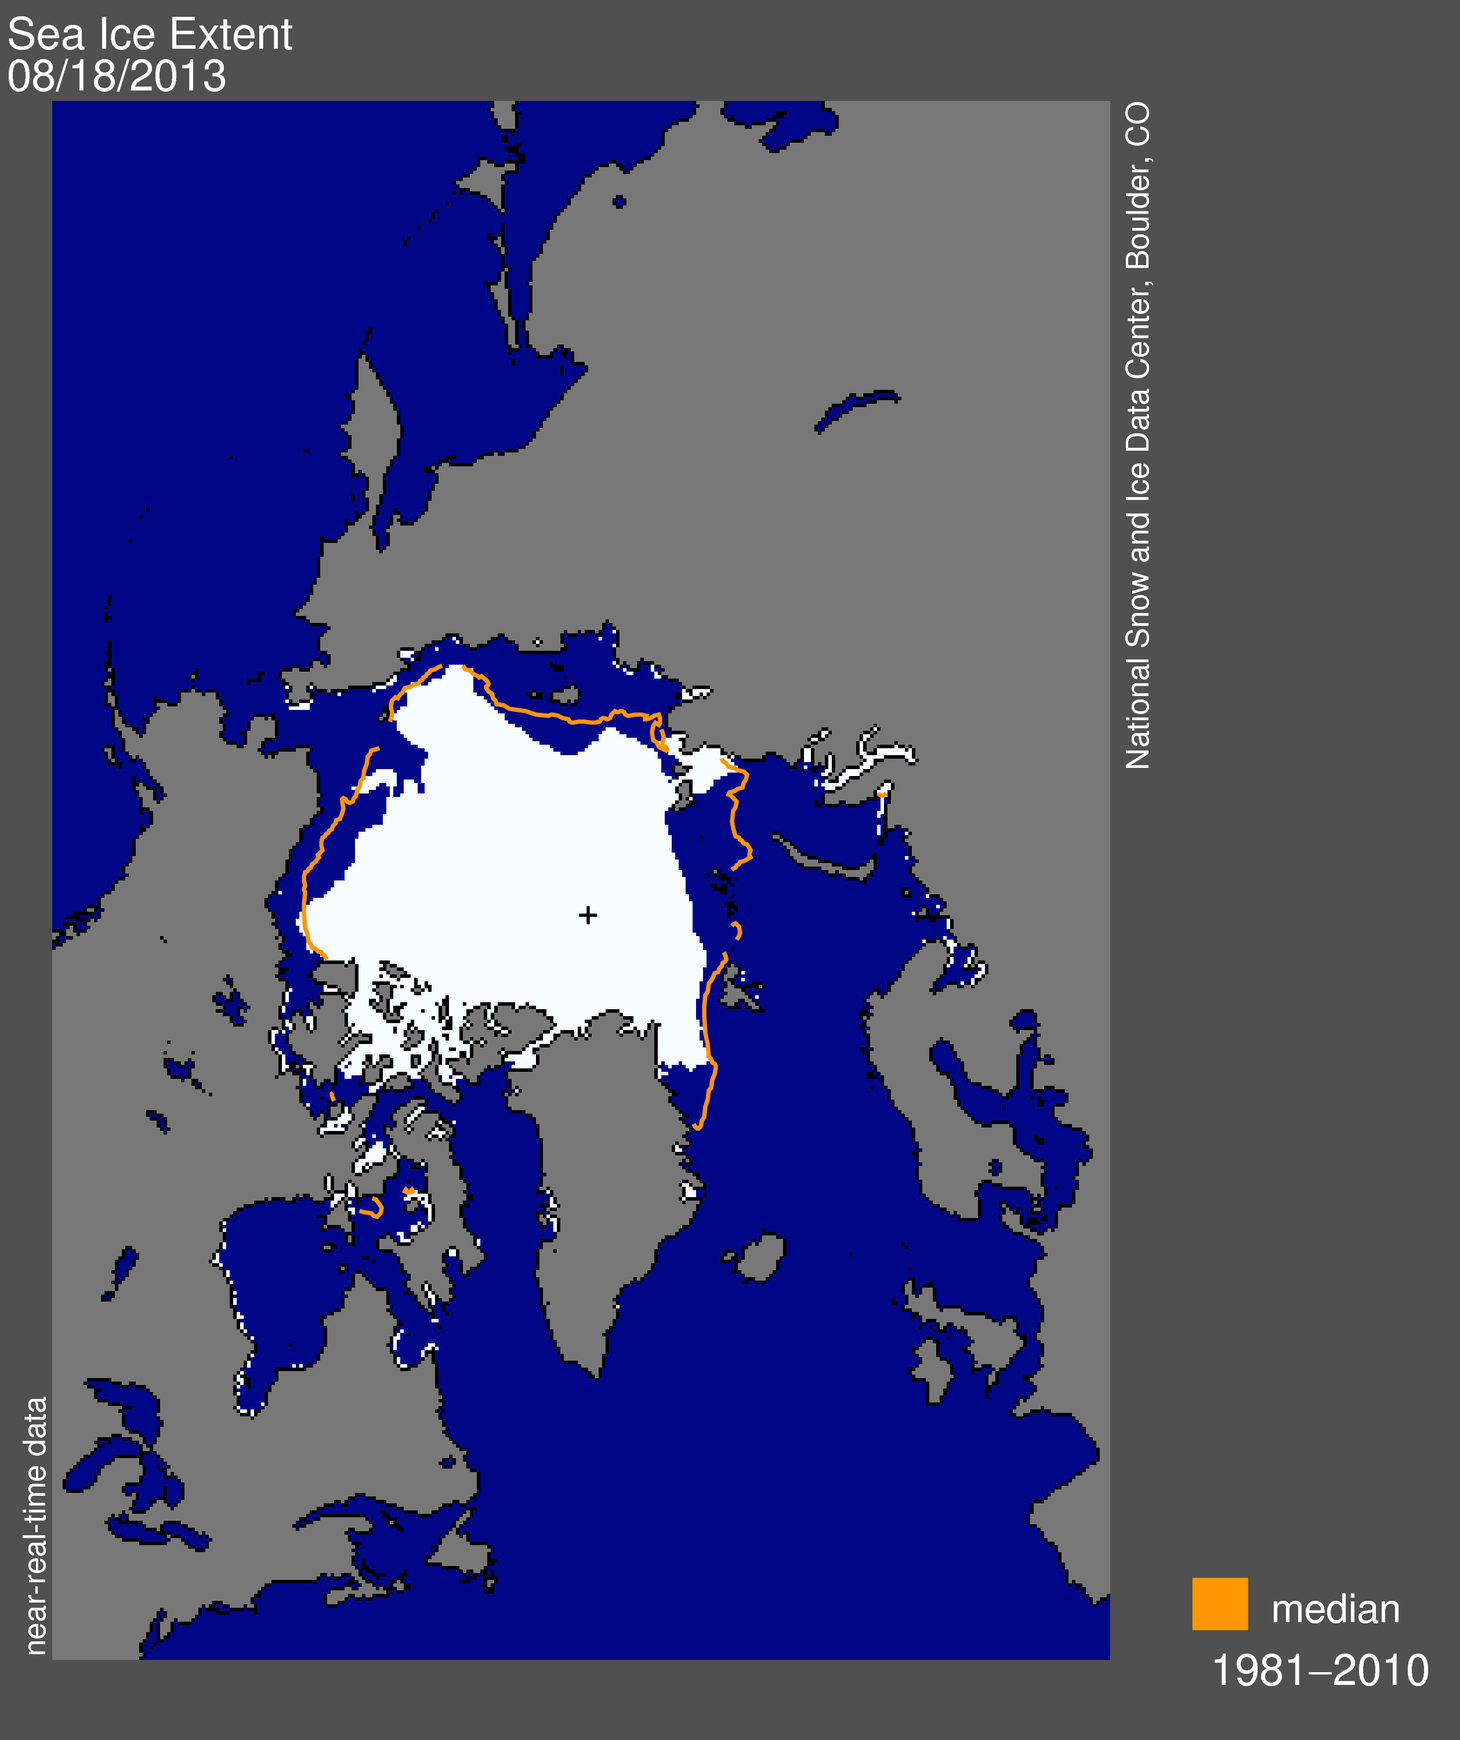
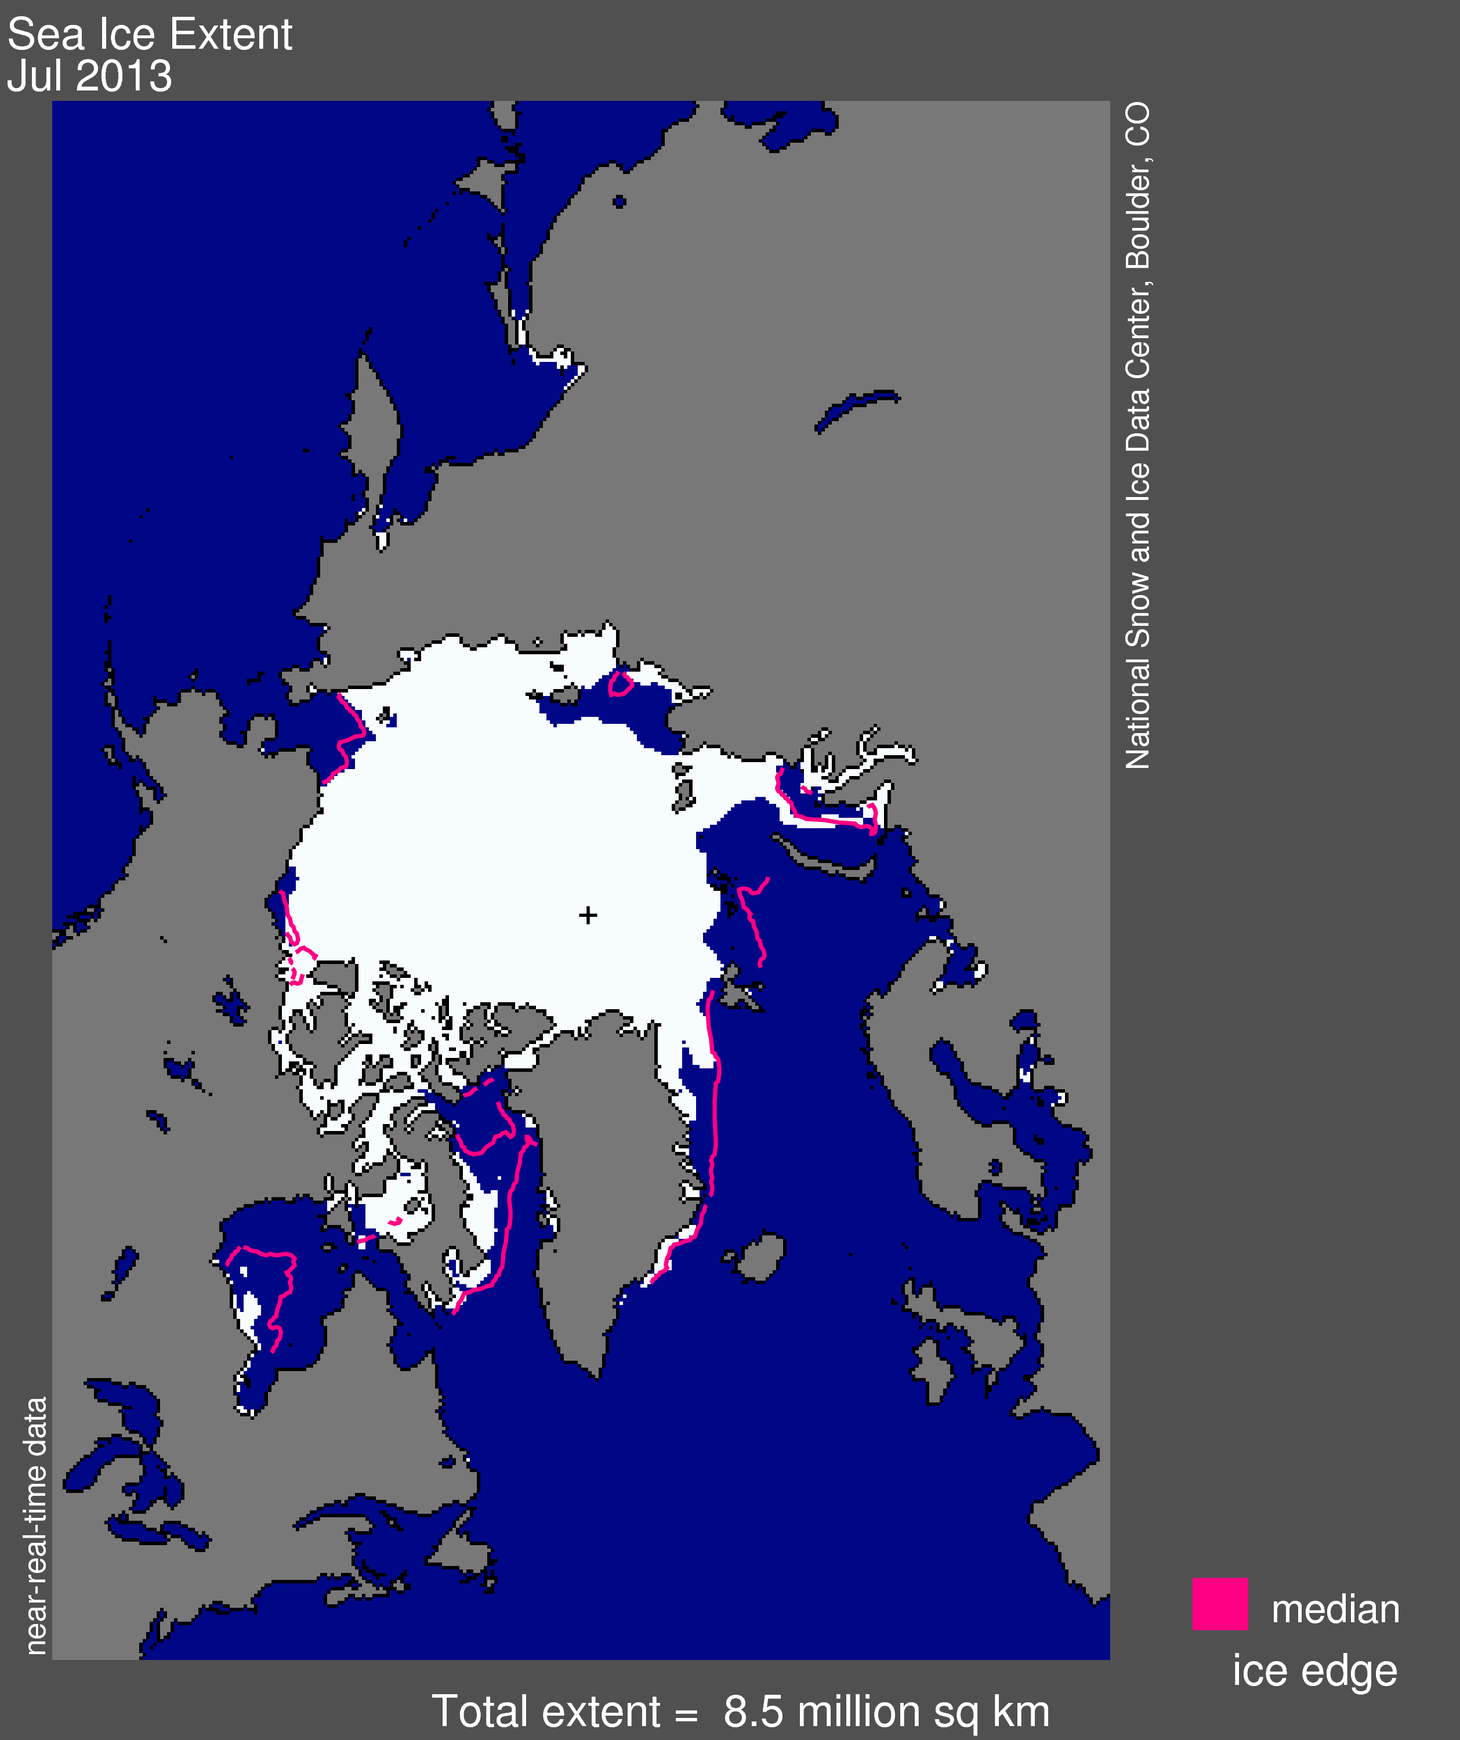
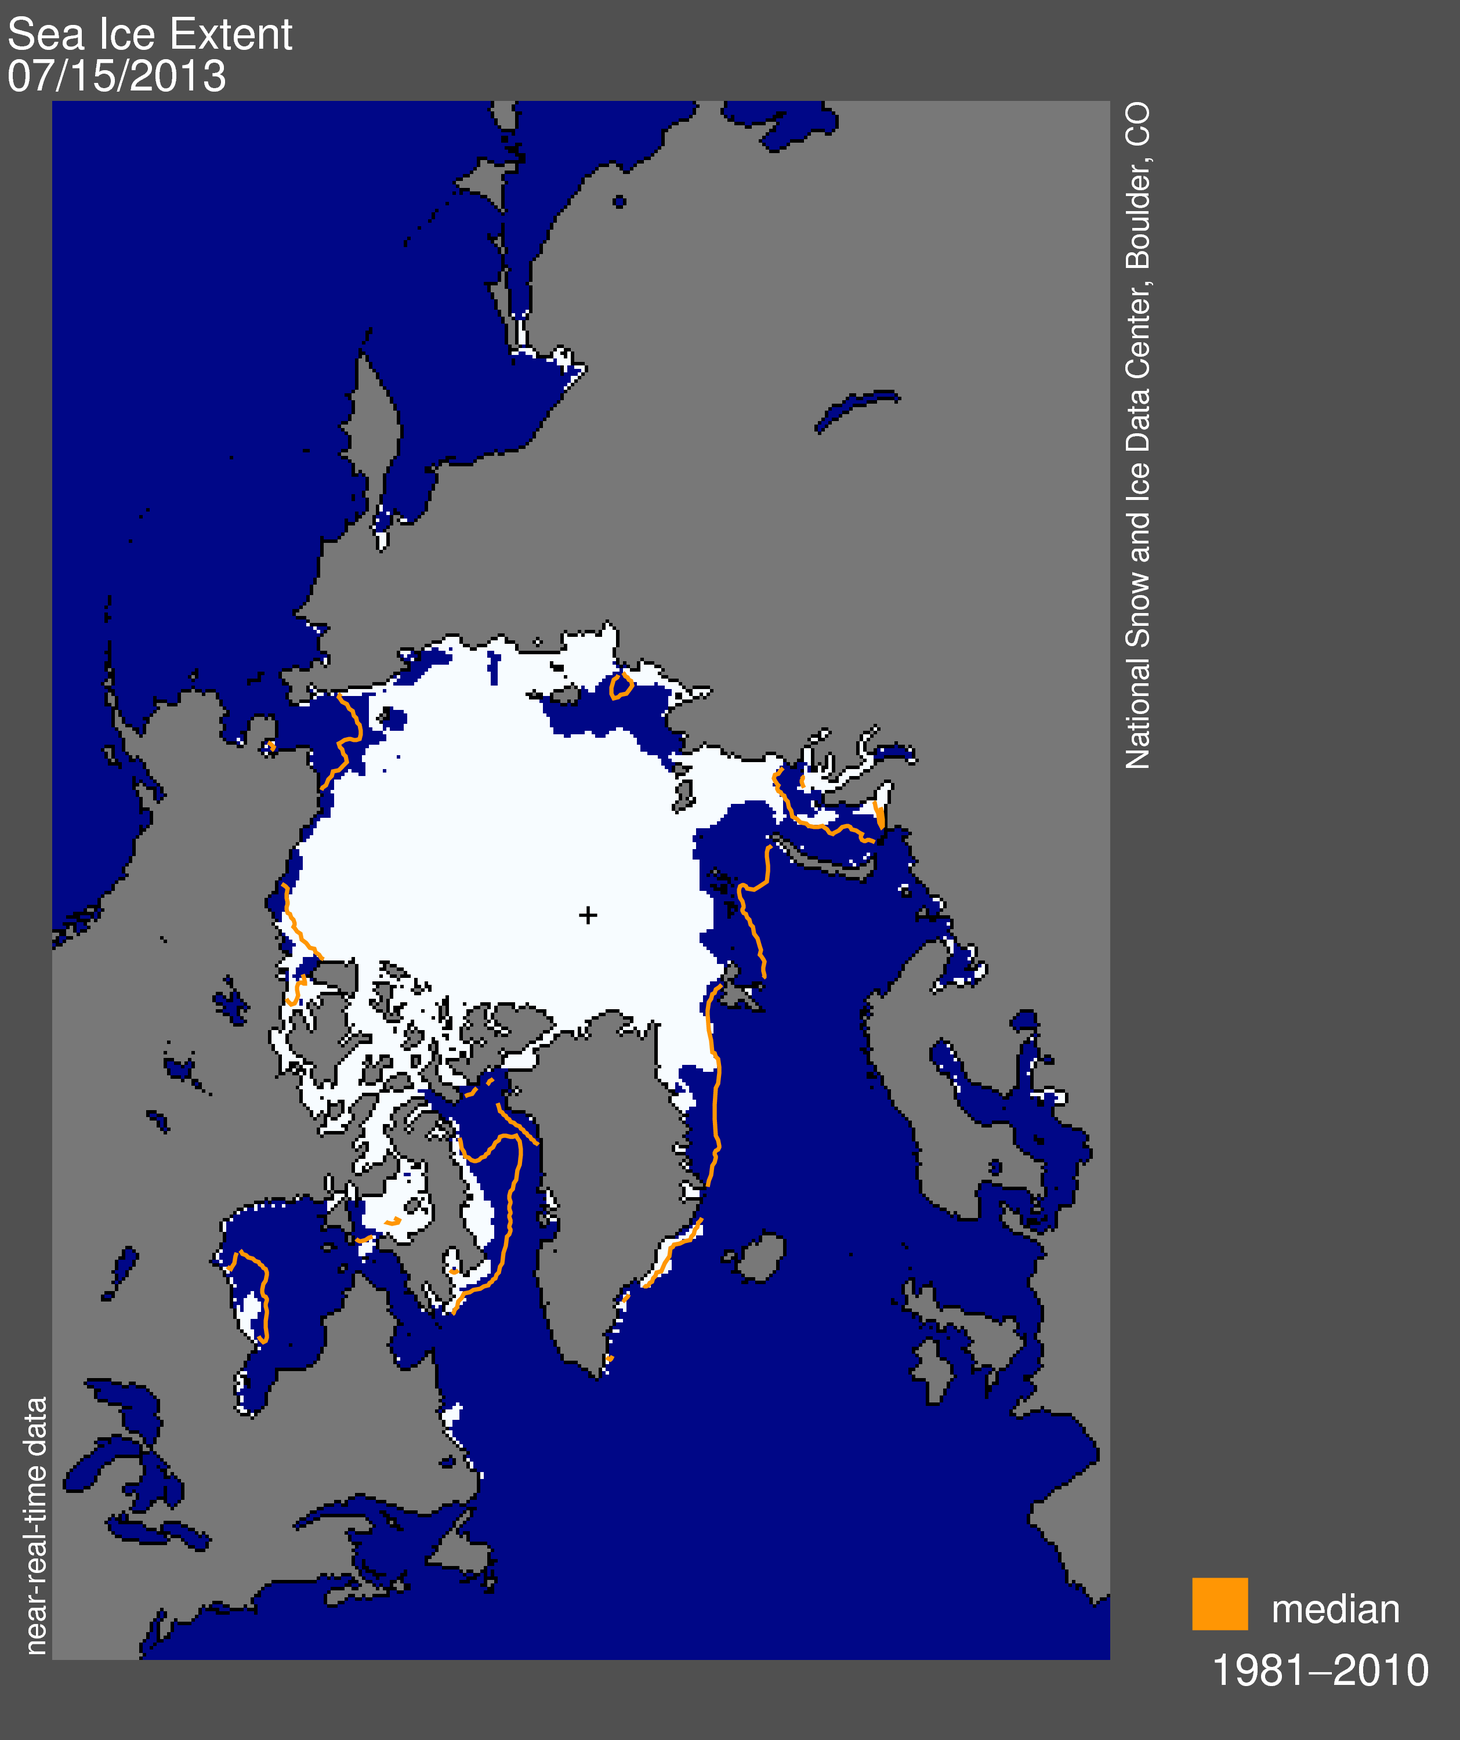
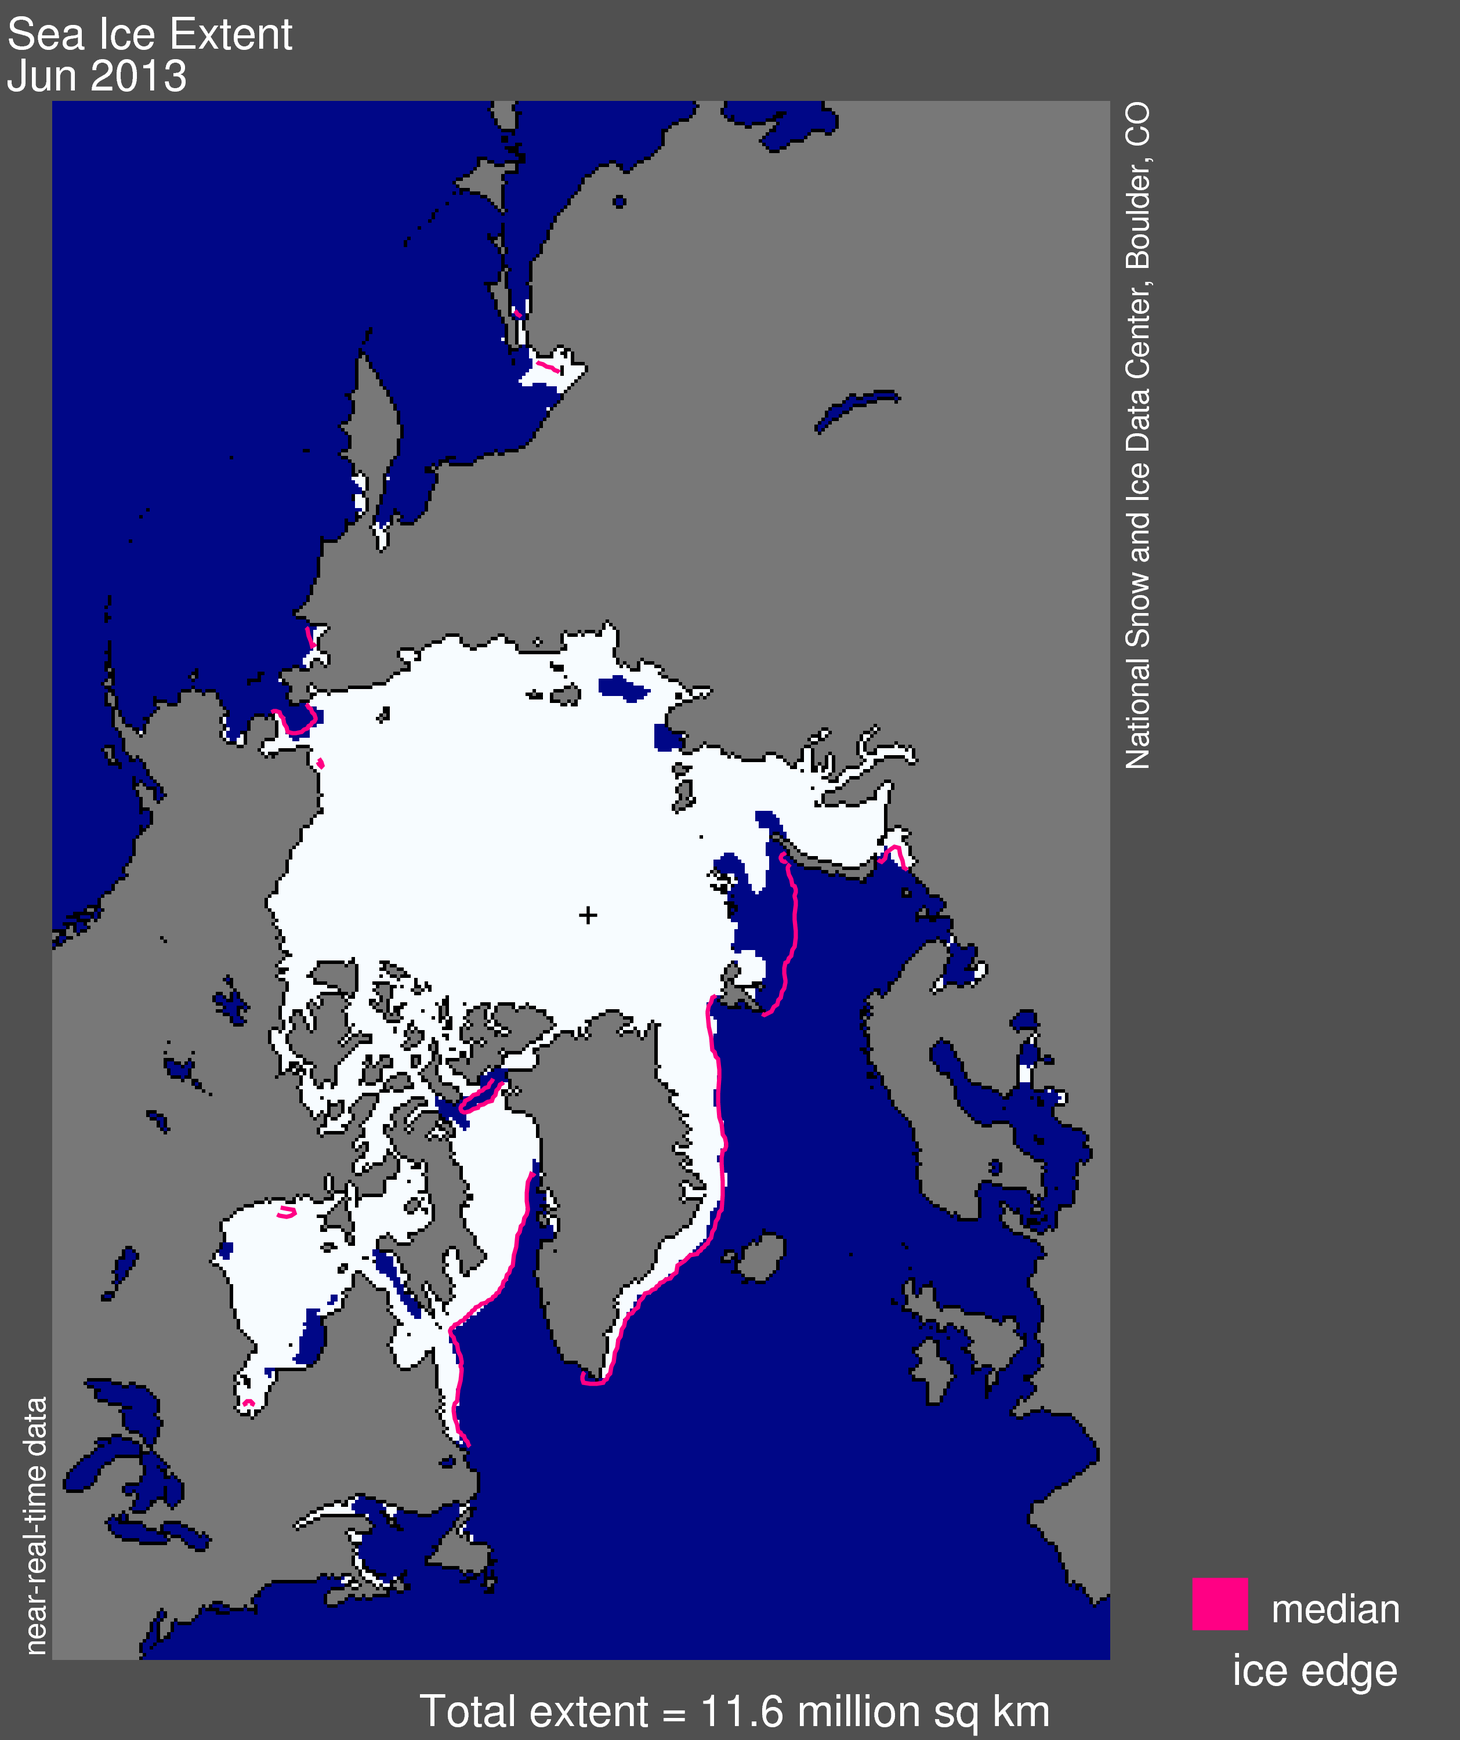
Figure 1. Arctic sea ice extent for November 2013 was 10.24 million square kilometers (3.95 million square miles). The magenta line shows the 1981 to 2010 median extent for that month. The black cross indicates the geographic North Pole. Sea Ice Index data. About the data
Credit: National Snow and Ice Data Center
High-resolution image
Arctic sea ice continued to expand during November, gaining 2.24 million square kilometers (865,000 square miles) of ice since the beginning of the month. Sea ice extent for November averaged 10.24 million square kilometers (3.95 million square miles). This is 750,000 square kilometers (290,000 square miles) below the 1981 to 2010 average extent and is the 6th lowest November extent in the 35-year satellite data record. As was the case for October 2013, sea ice extent for November 2013 remained within two standard deviations of the long-term 1981 to 2010 average.
Conditions in context
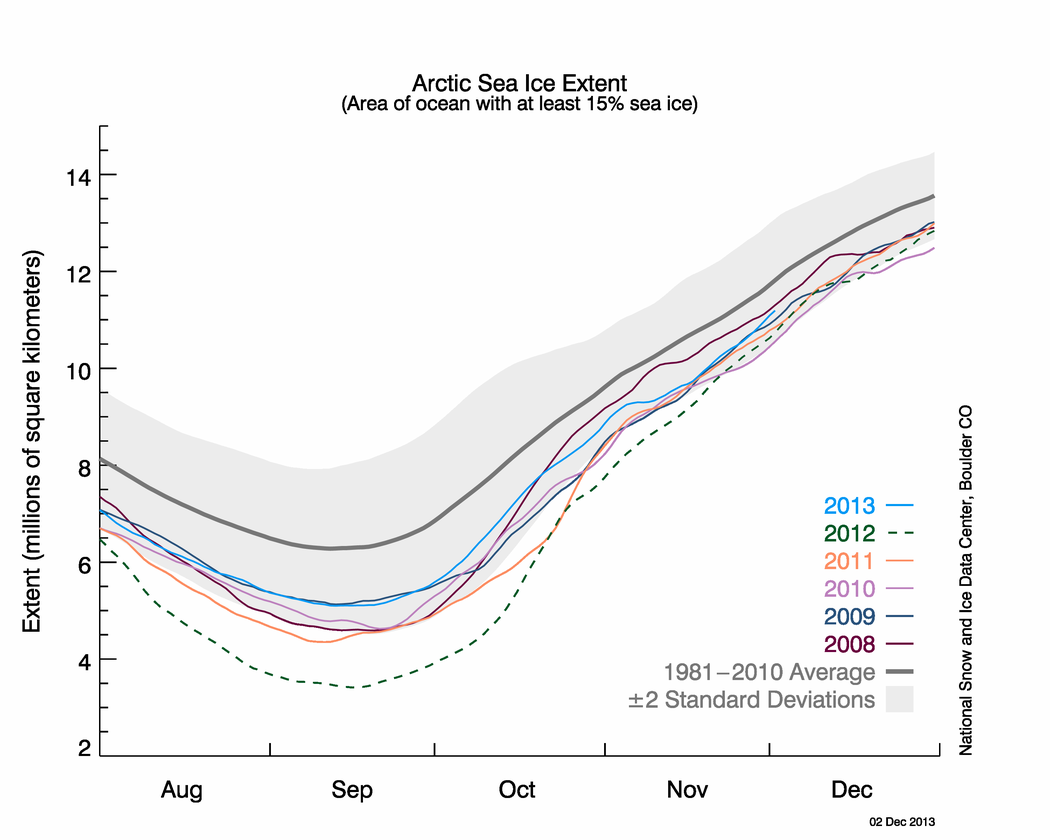
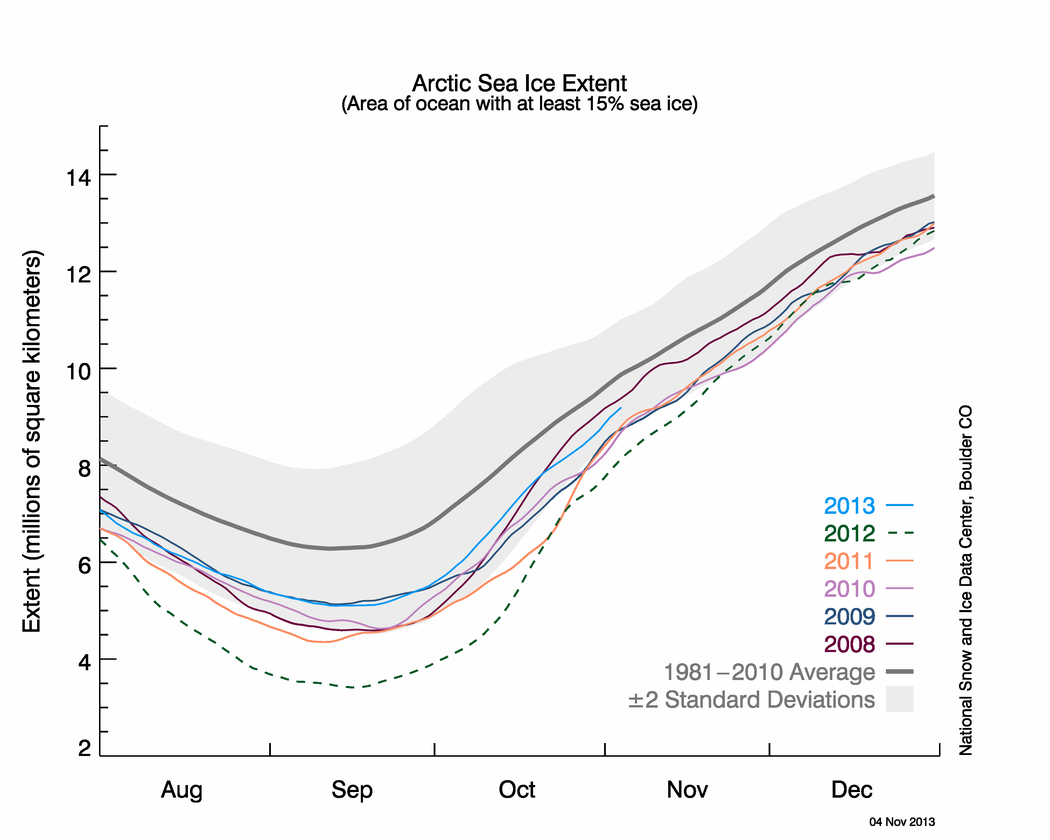
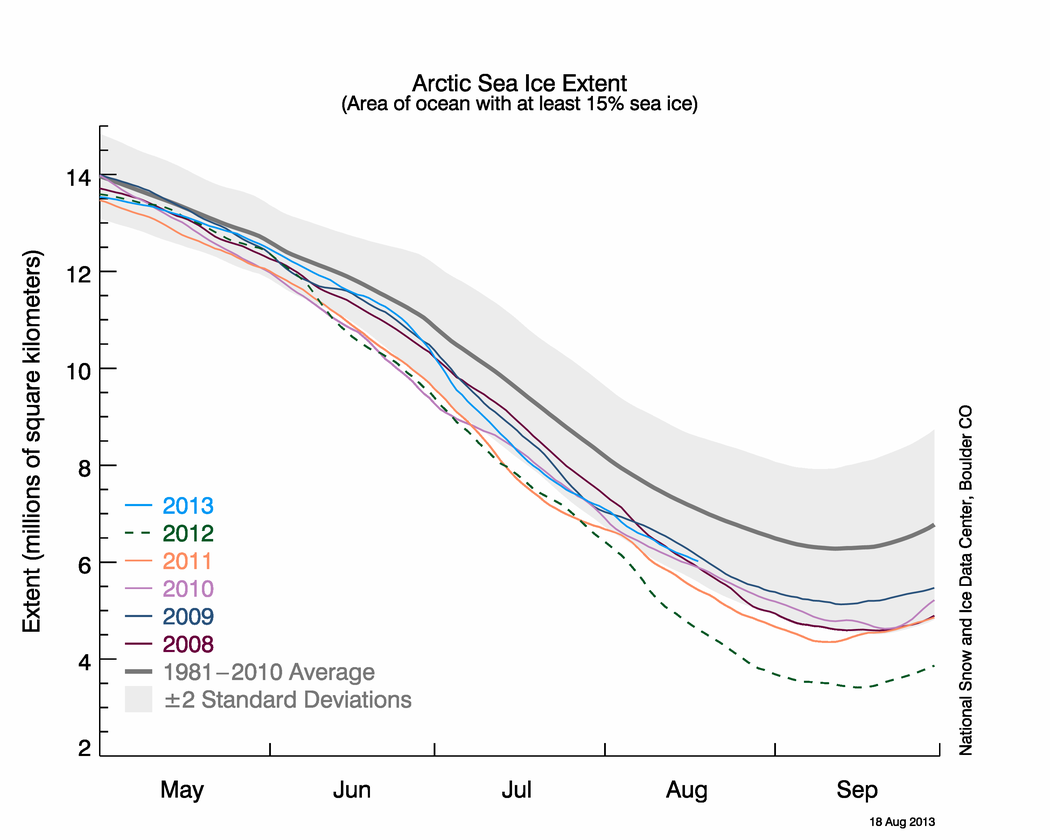
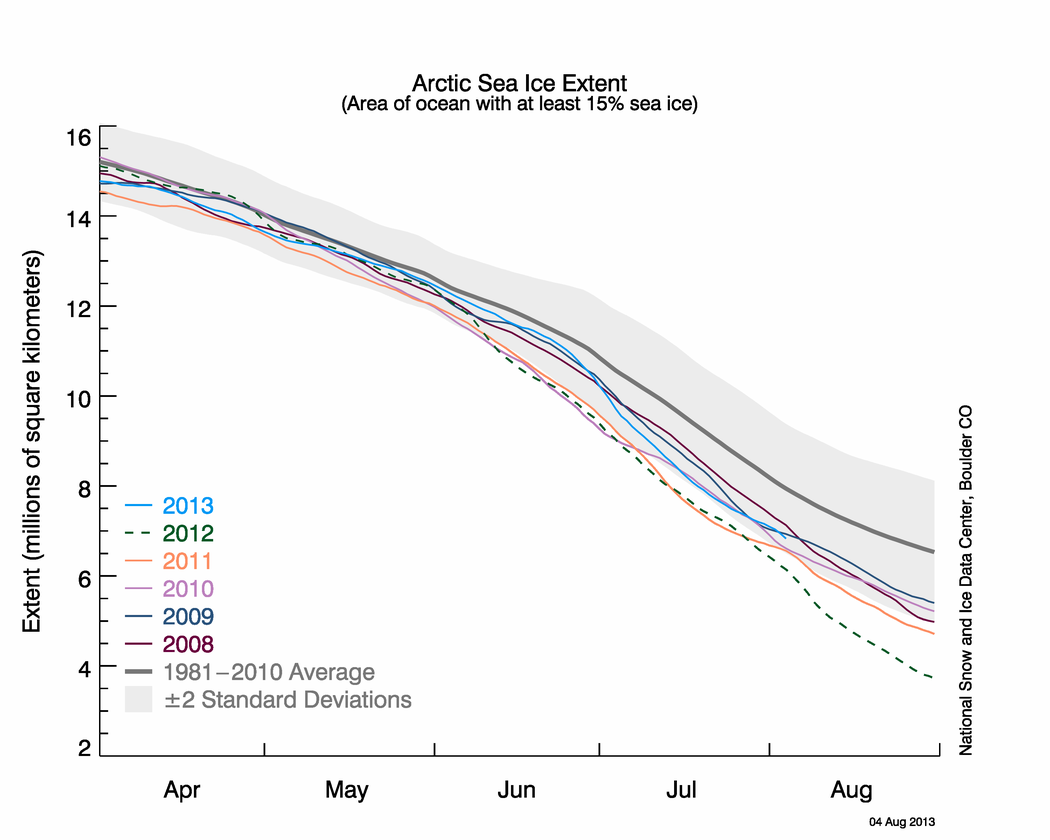
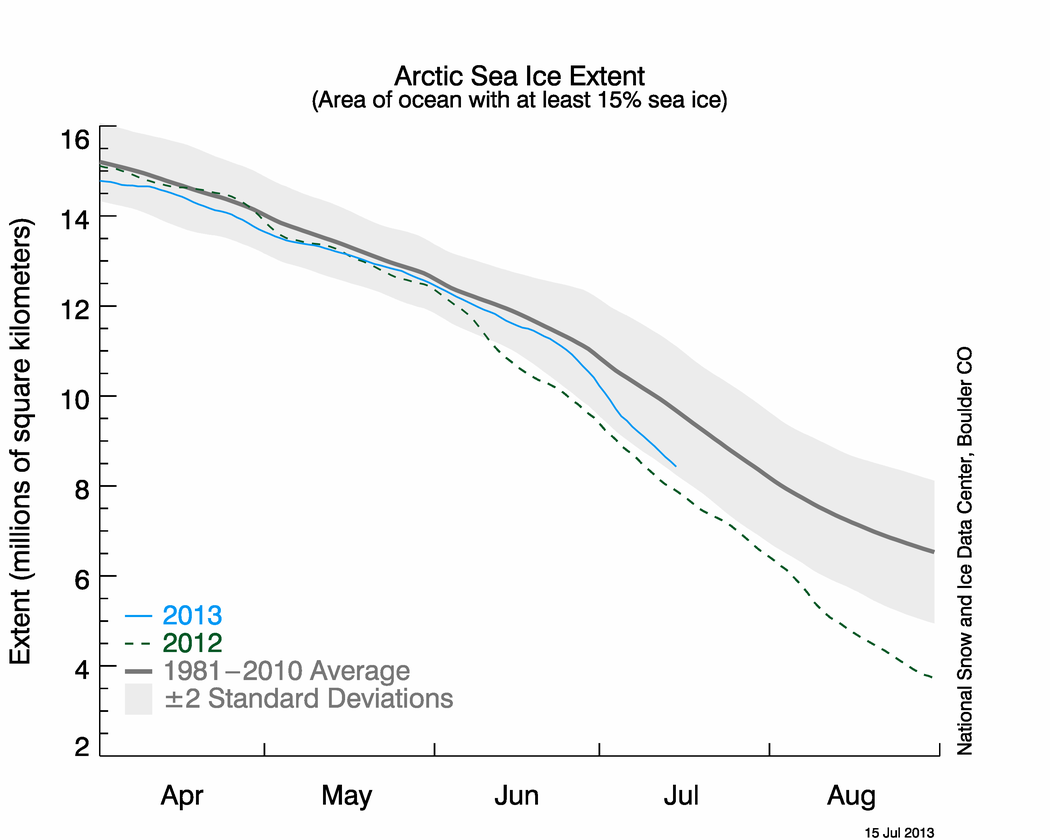
Figure 2. The graph above shows Arctic sea ice extent as of December 2, 2013, along with daily ice extent data for the previous five years. 2013 is shown in blue, 2012 in green, 2011 in orange, 2010 in pink, 2009 in navy, and 2008 in purple. The 1981 to 2010 average is in dark gray. Sea Ice Index data.
Credit: National Snow and Ice Data Center
High-resolution image
For the month as a whole, ice grew at near average rates throughout November at 74,800 square kilometers (28,900 square miles) per day compared to the 1981 to 2010 average of 70,500 square kilometers (27,200 square miles) per day. This was despite a period of slow ice growth during the first part of the month. At the end of the month, extent was 580,000 square kilometers (224,000 square miles) lower than average and 420,000 square kilometers (162,000 square miles) above the same time last year.
The below average ice extent in the Arctic was largely due to a lack of ice in the Barents Sea, which has shown a pattern of low autumn and winter ice extent over the recent years. This November, the overall extent in the Barents Sea was the second lowest in the satellite record, with the lowest occurring in 2012.
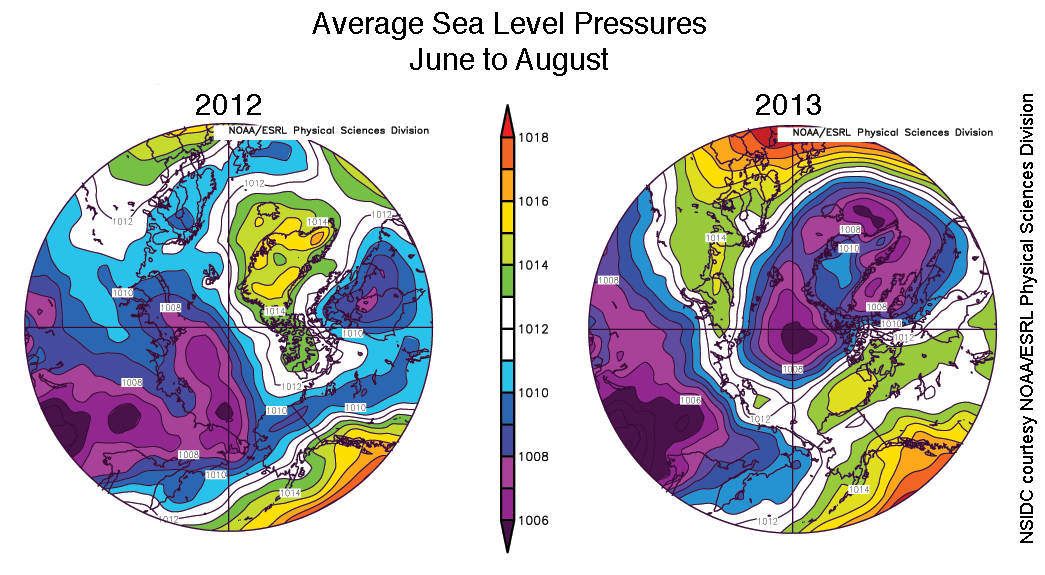
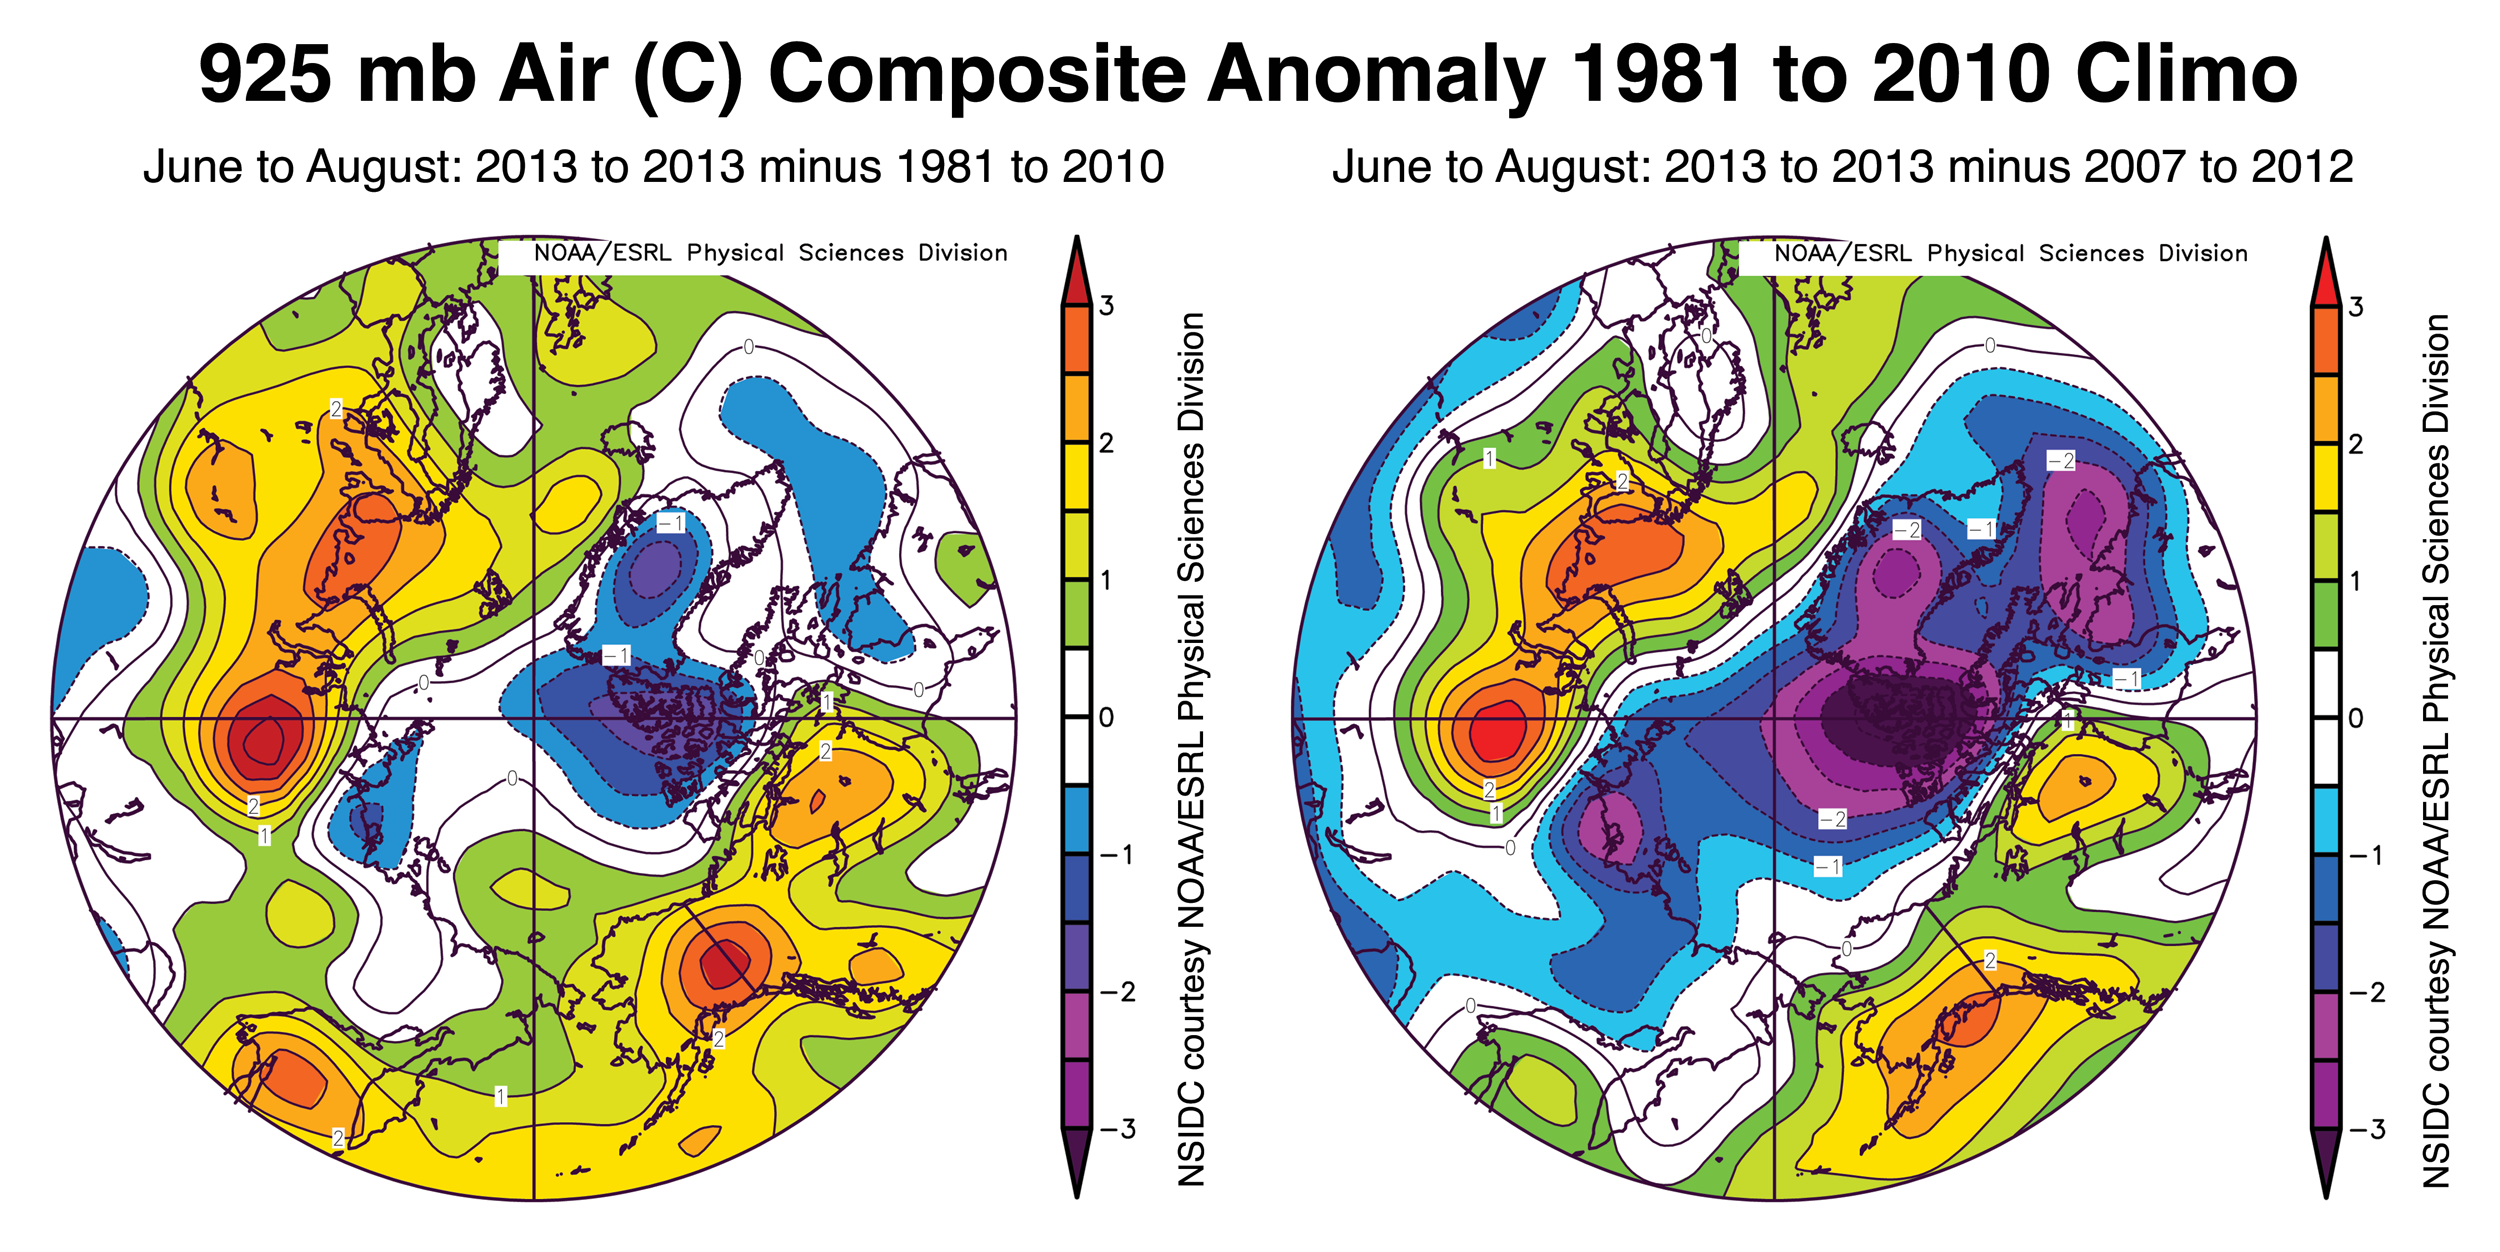
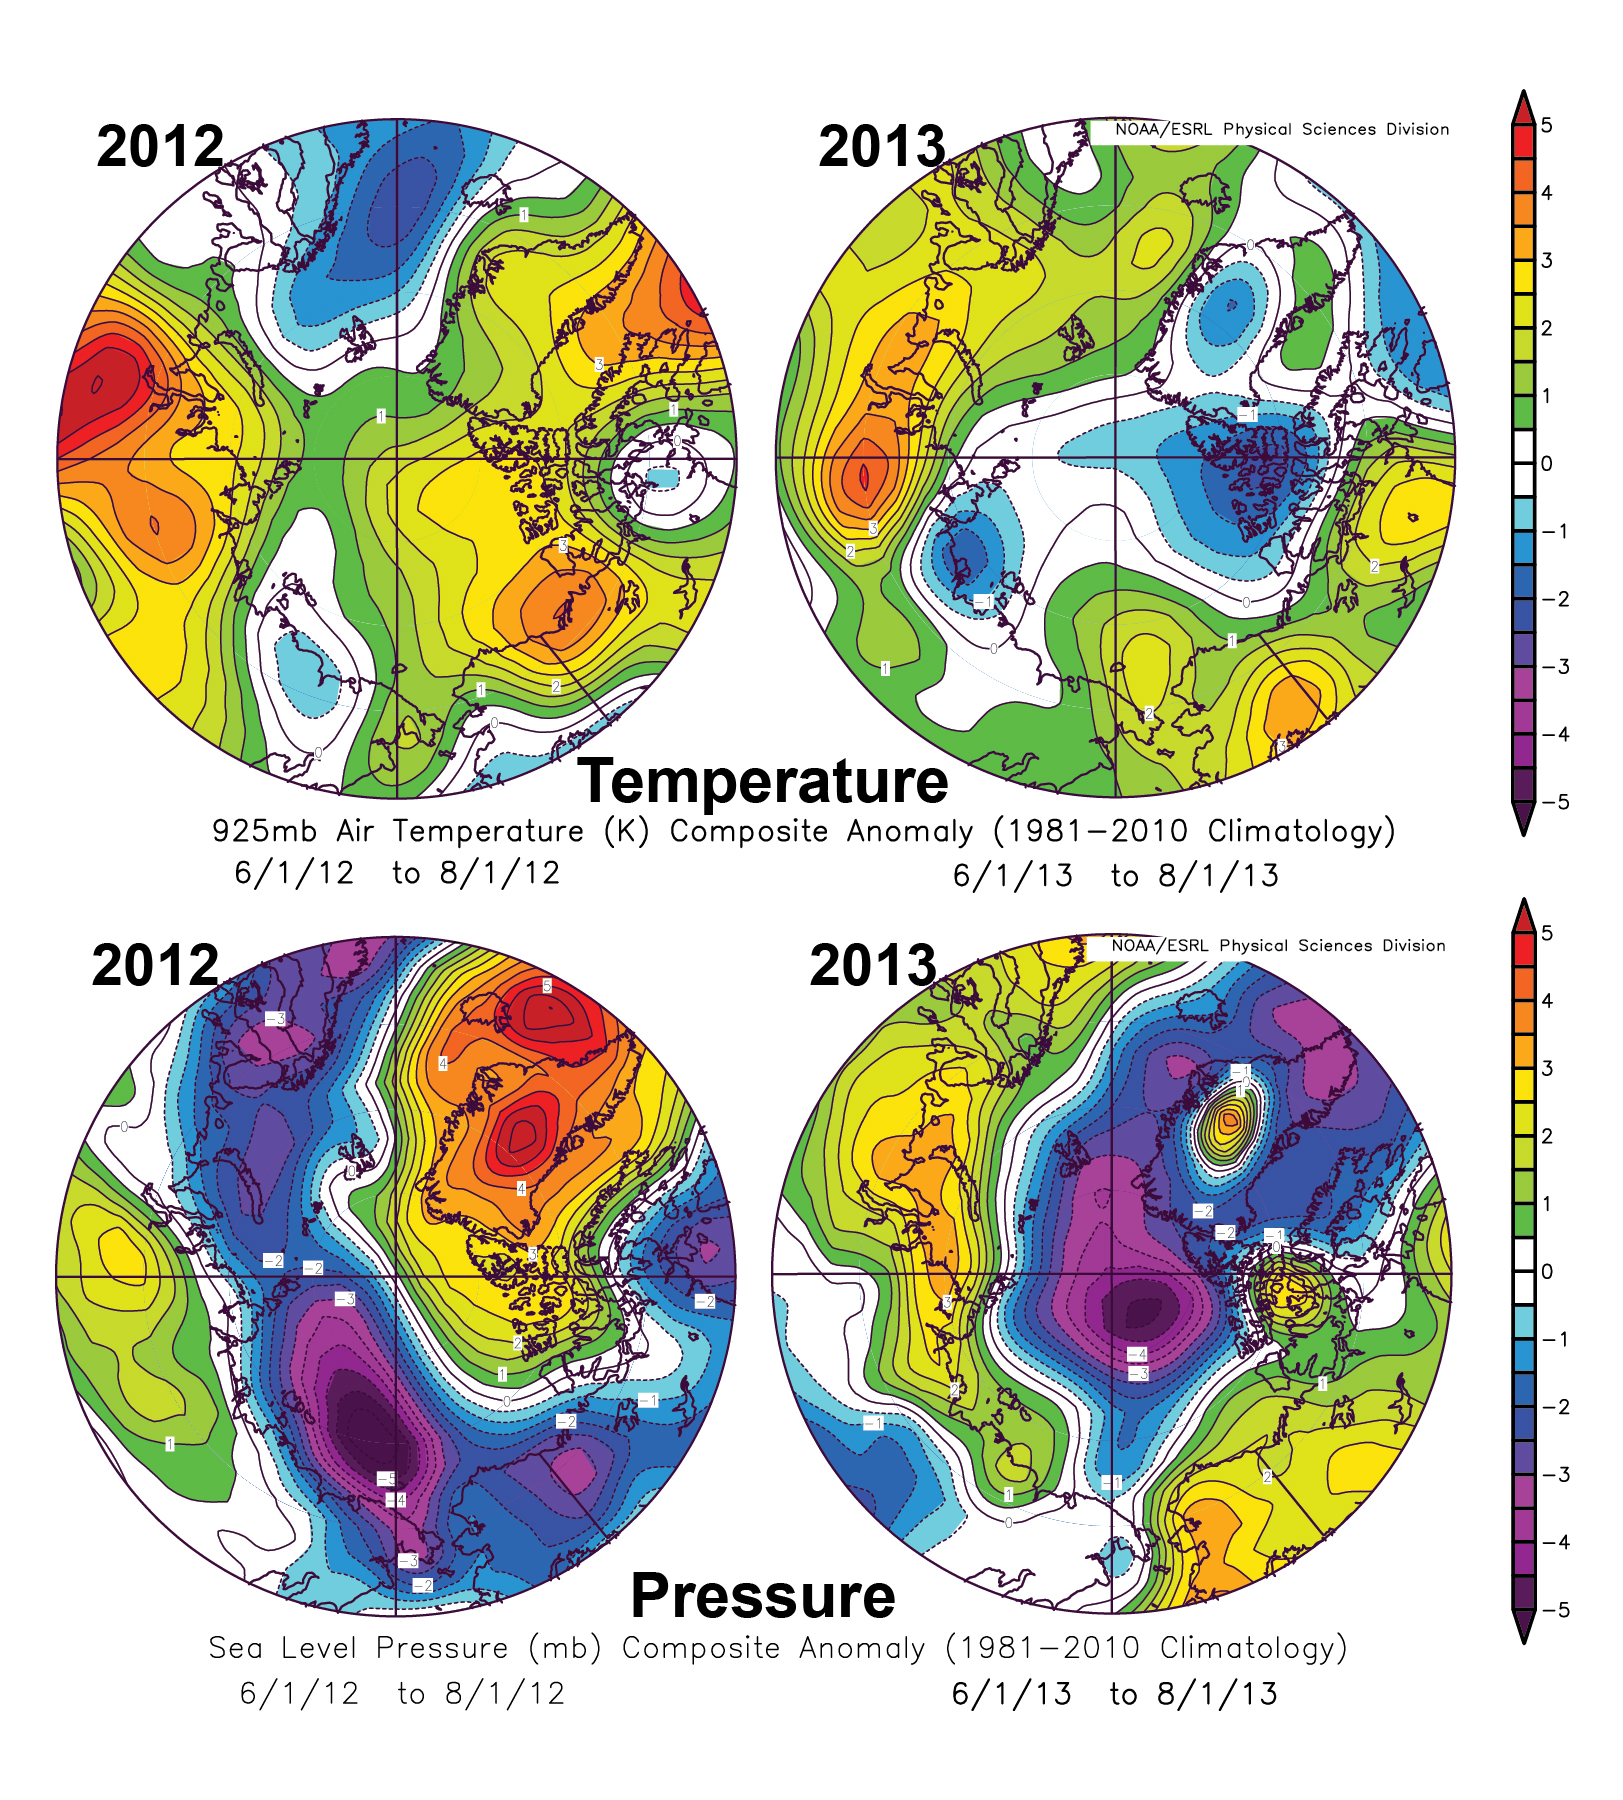
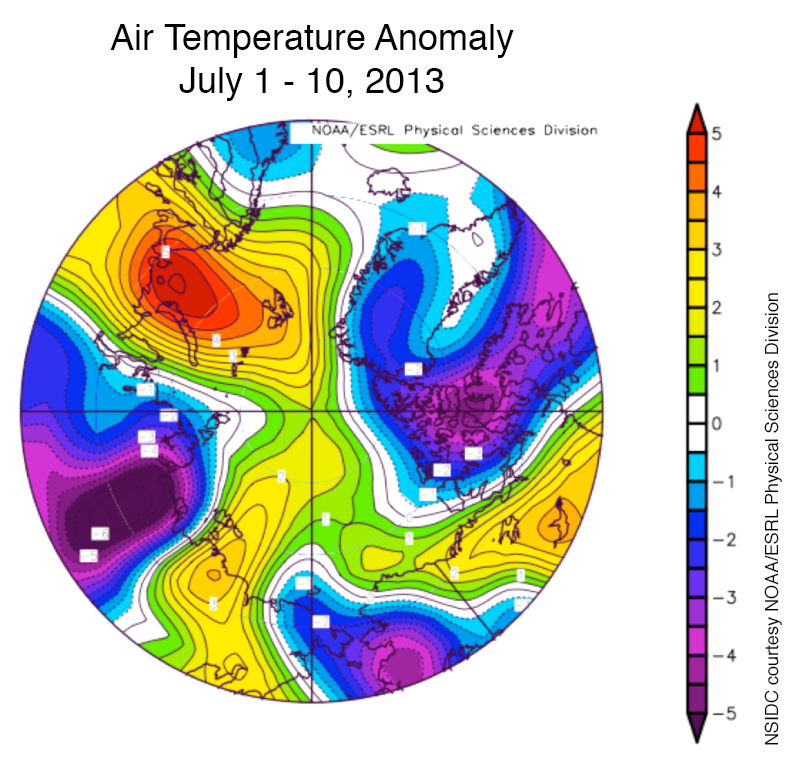
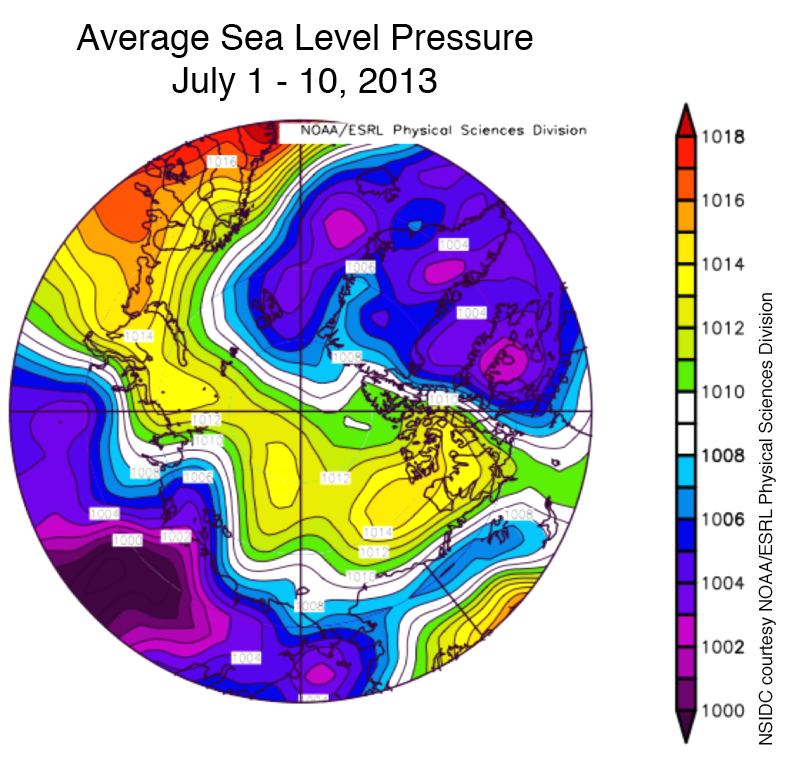
The low ice in the Barents Sea is due to several possible factors. First, it could reflect the influx of warm ocean currents that inhibited ice growth. The atmosphere also played some role. Sea level pressure over the Arctic Ocean was lower than normal by as much as 9 to 12 hPa. This is consistent with the persistent strongly positive phase of the AO seen through the month; a positive AO generally leads to higher than average air temperatures over Eurasia and adjacent sea ice areas. November air temperatures in the Barents Sea were on the order of 2 to 4 degrees Celsius (4 to 7 degrees Fahrenheit) above average. The higher than average temperatures may also simply reflect the lack of sea ice in the Barents Sea. This is because under open water conditions, the ocean readily releases heat to the overlying atmosphere.
November 2013 compared to previous years.
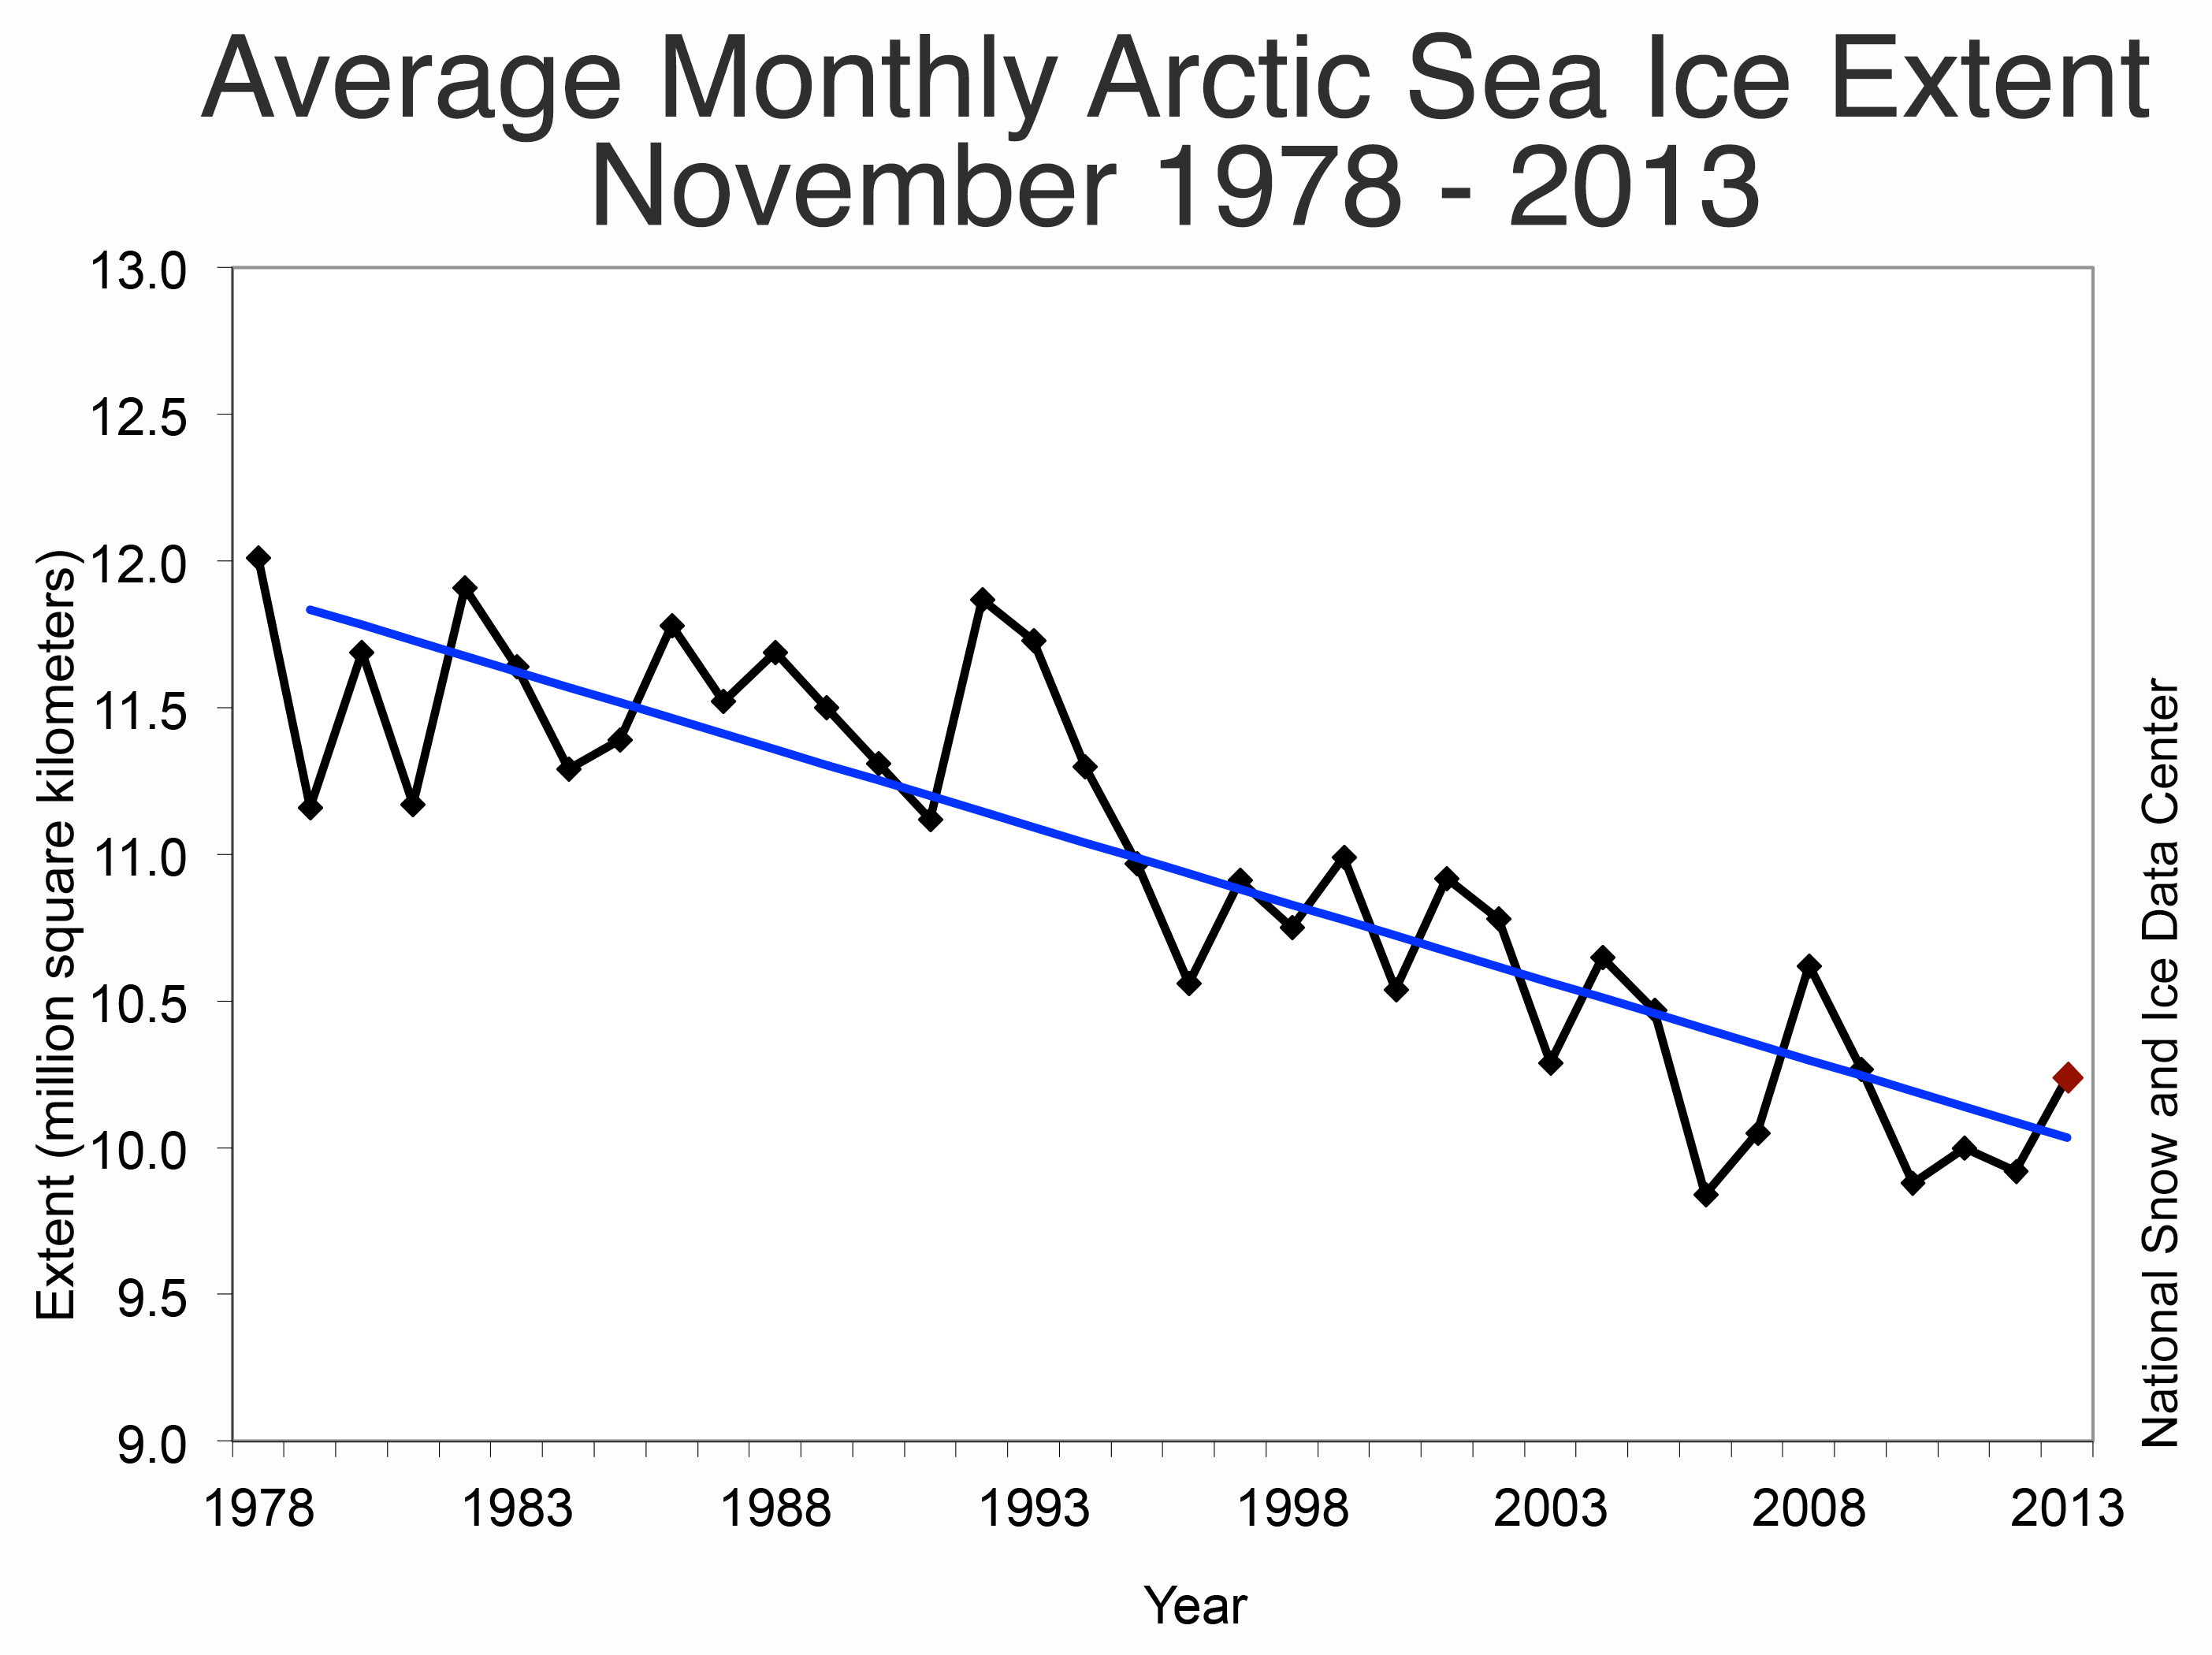
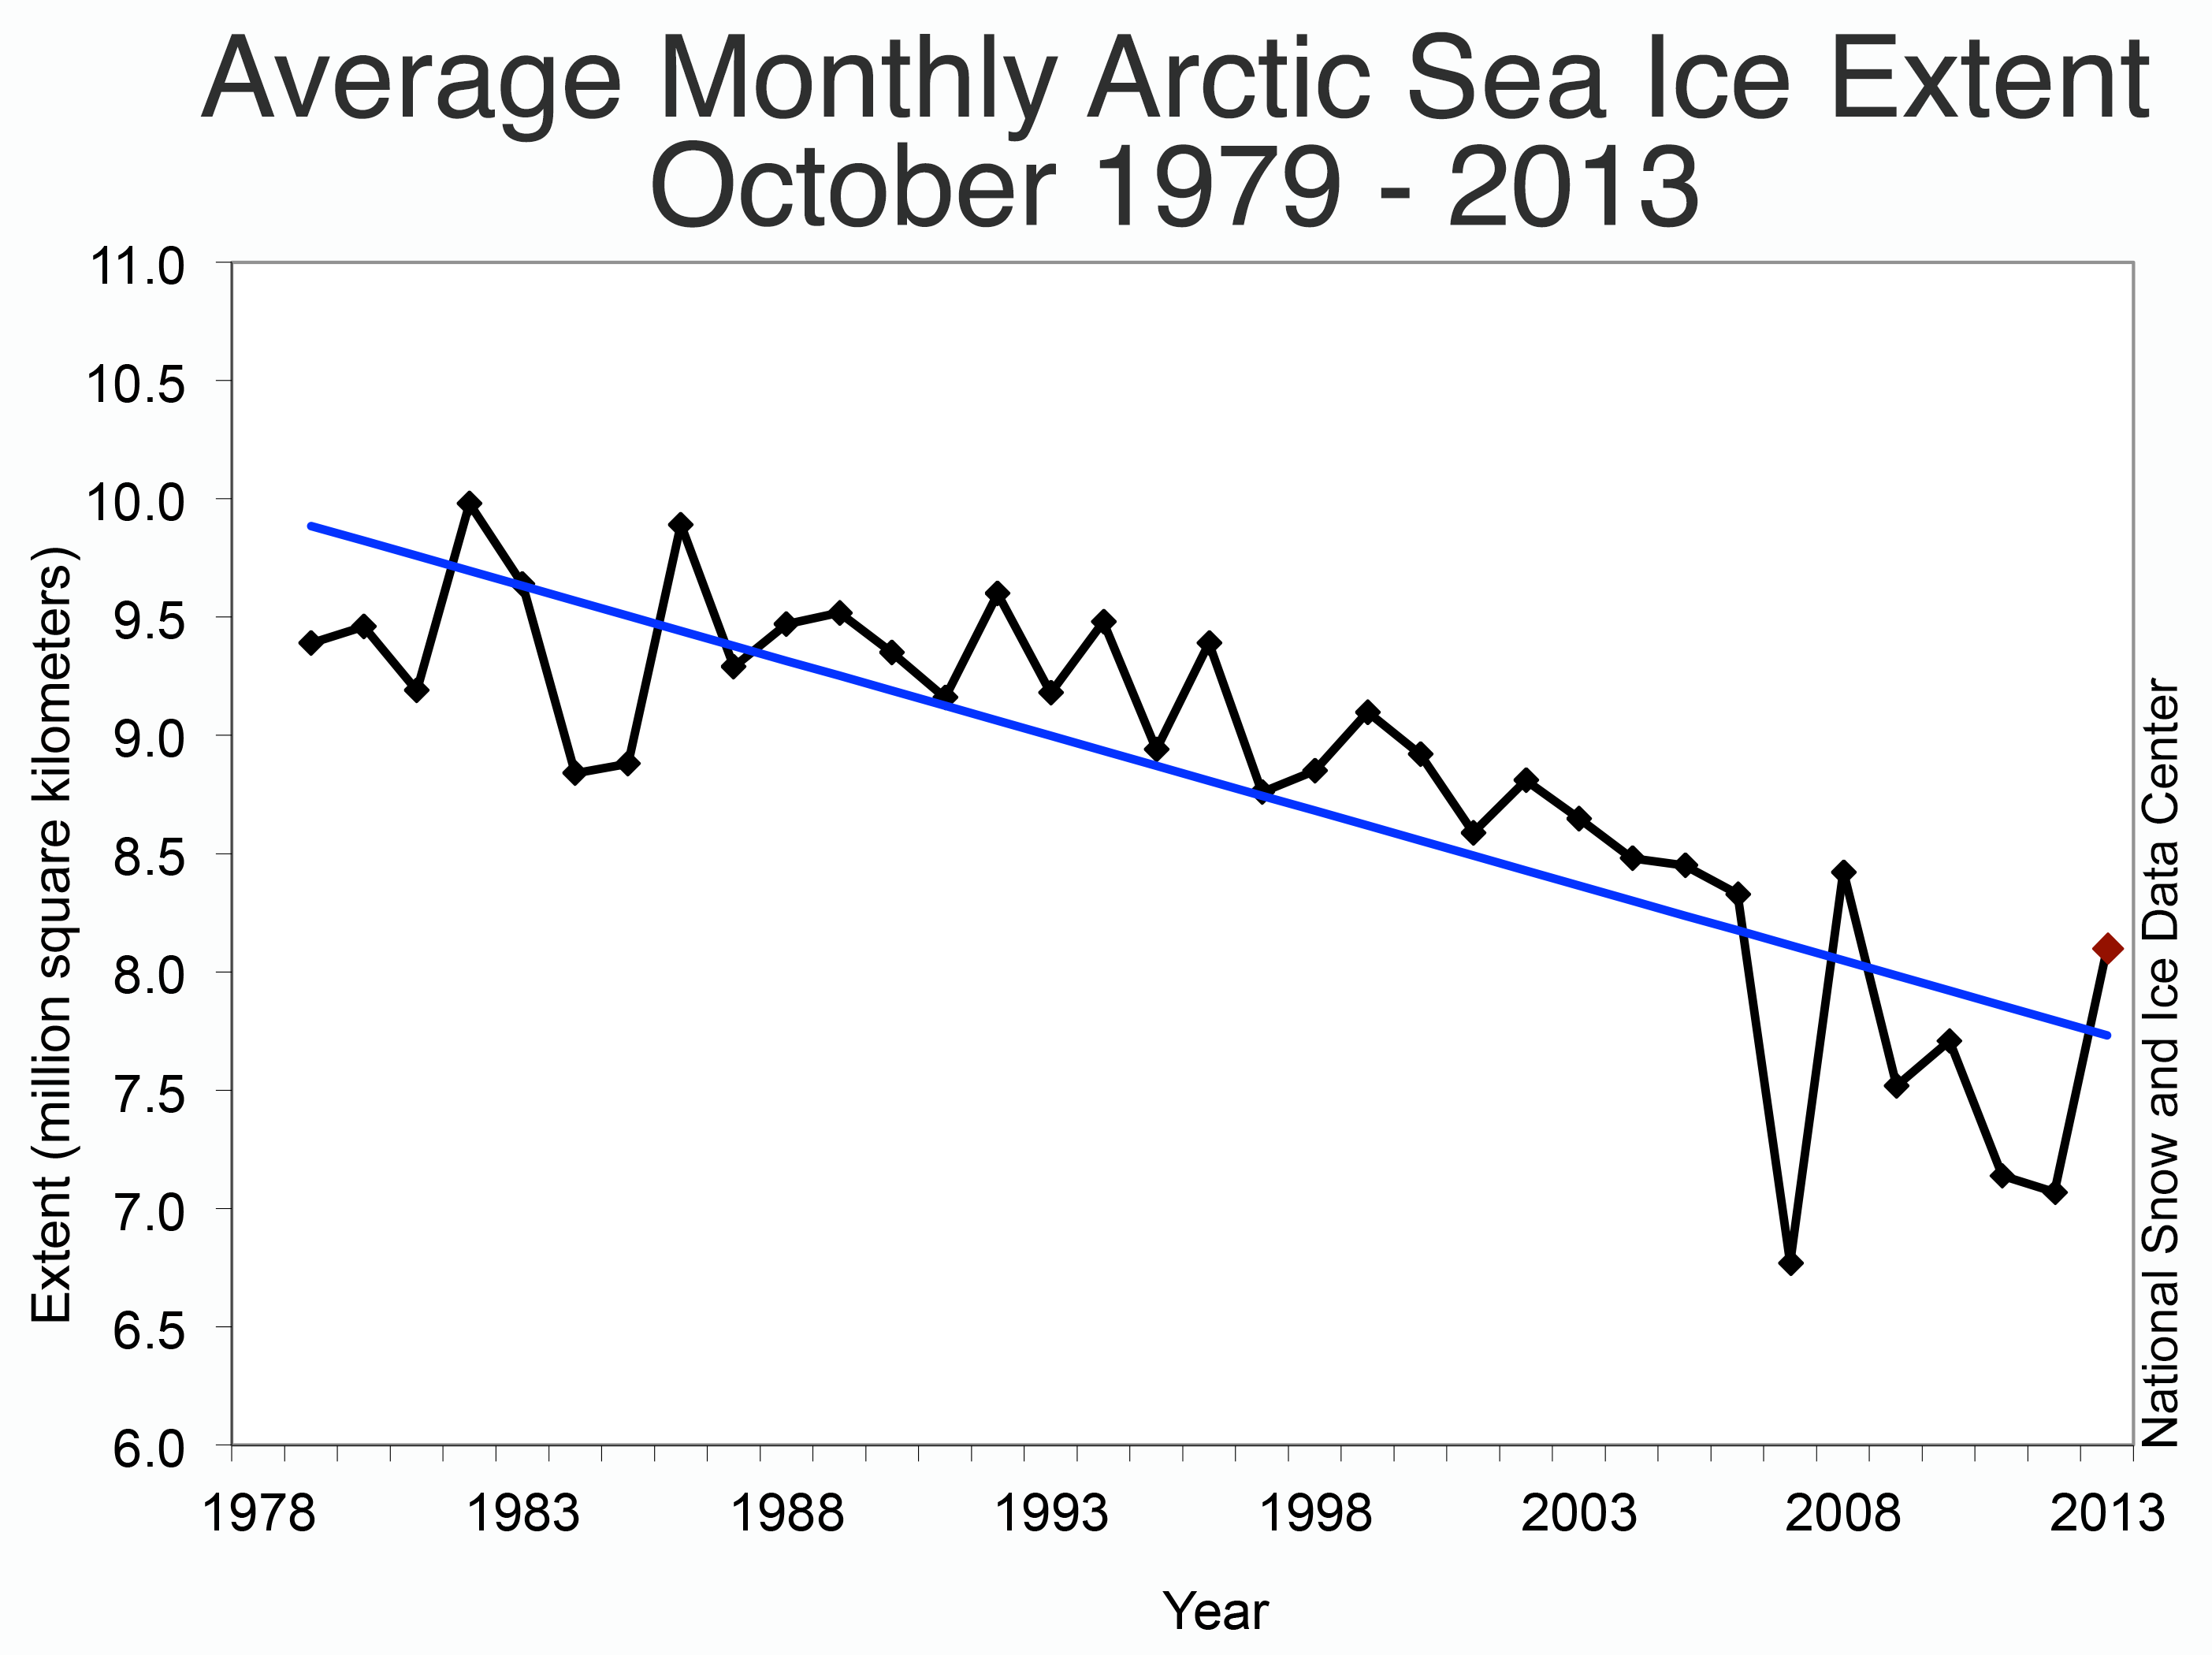
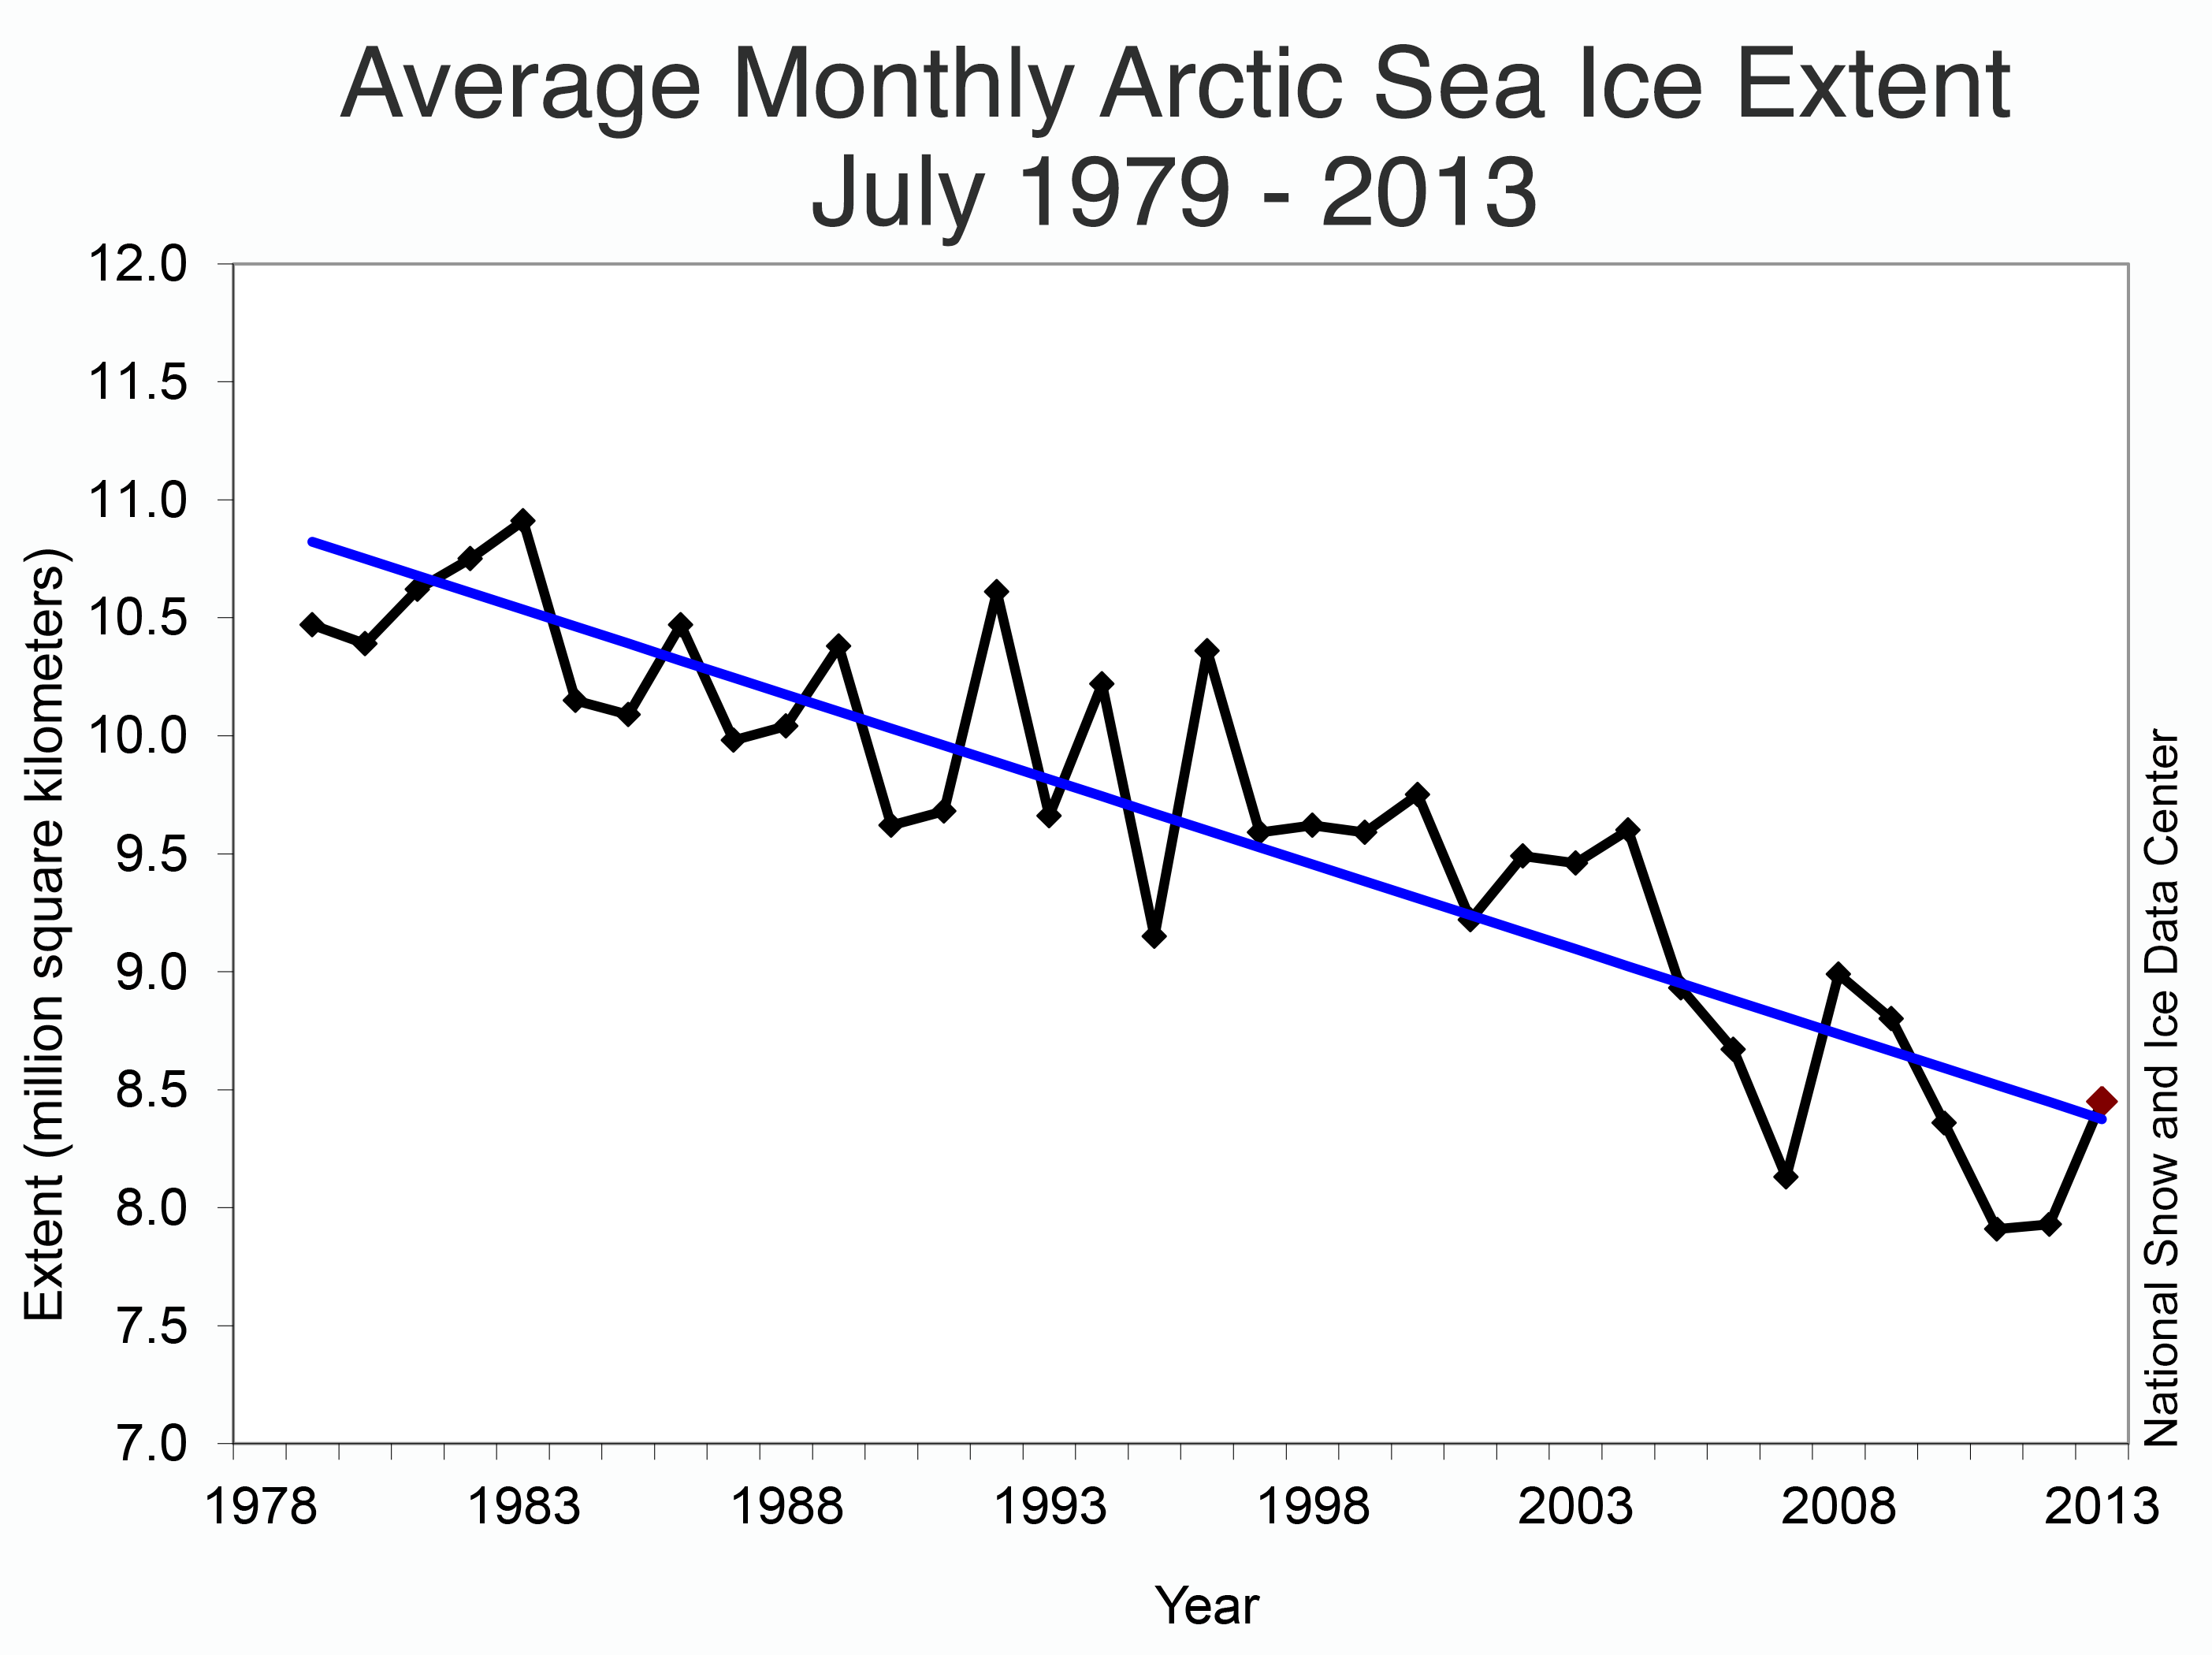
Figure 3. Monthly November ice extent for 1978 to 2013 shows a decline of –4.9% per decade relative to the 1981 to 2010 average.
Credit: National Snow and Ice Data Center
High-resolution image
Including 2013, the linear trend in November ice extent is –4.9% per decade relative to the 1981 to 2010 mean, or –53,500 square kilometers per year (–20,700 square miles per year).
Extensive ice in Antarctica
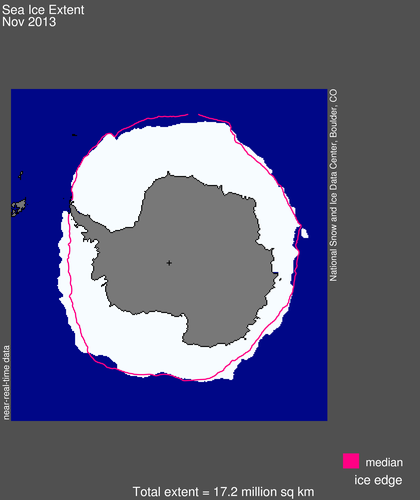
Figure 4a. Antarctic sea ice extent for November 2013 was 17.2 million square kilometers (6.63 million square miles). The magenta line shows the 1981 to 2010 median extent for that month. The black cross indicates the geographic South Pole. Sea Ice Index data. About the data
Credit: National Snow and Ice Data Center
High-resolution image
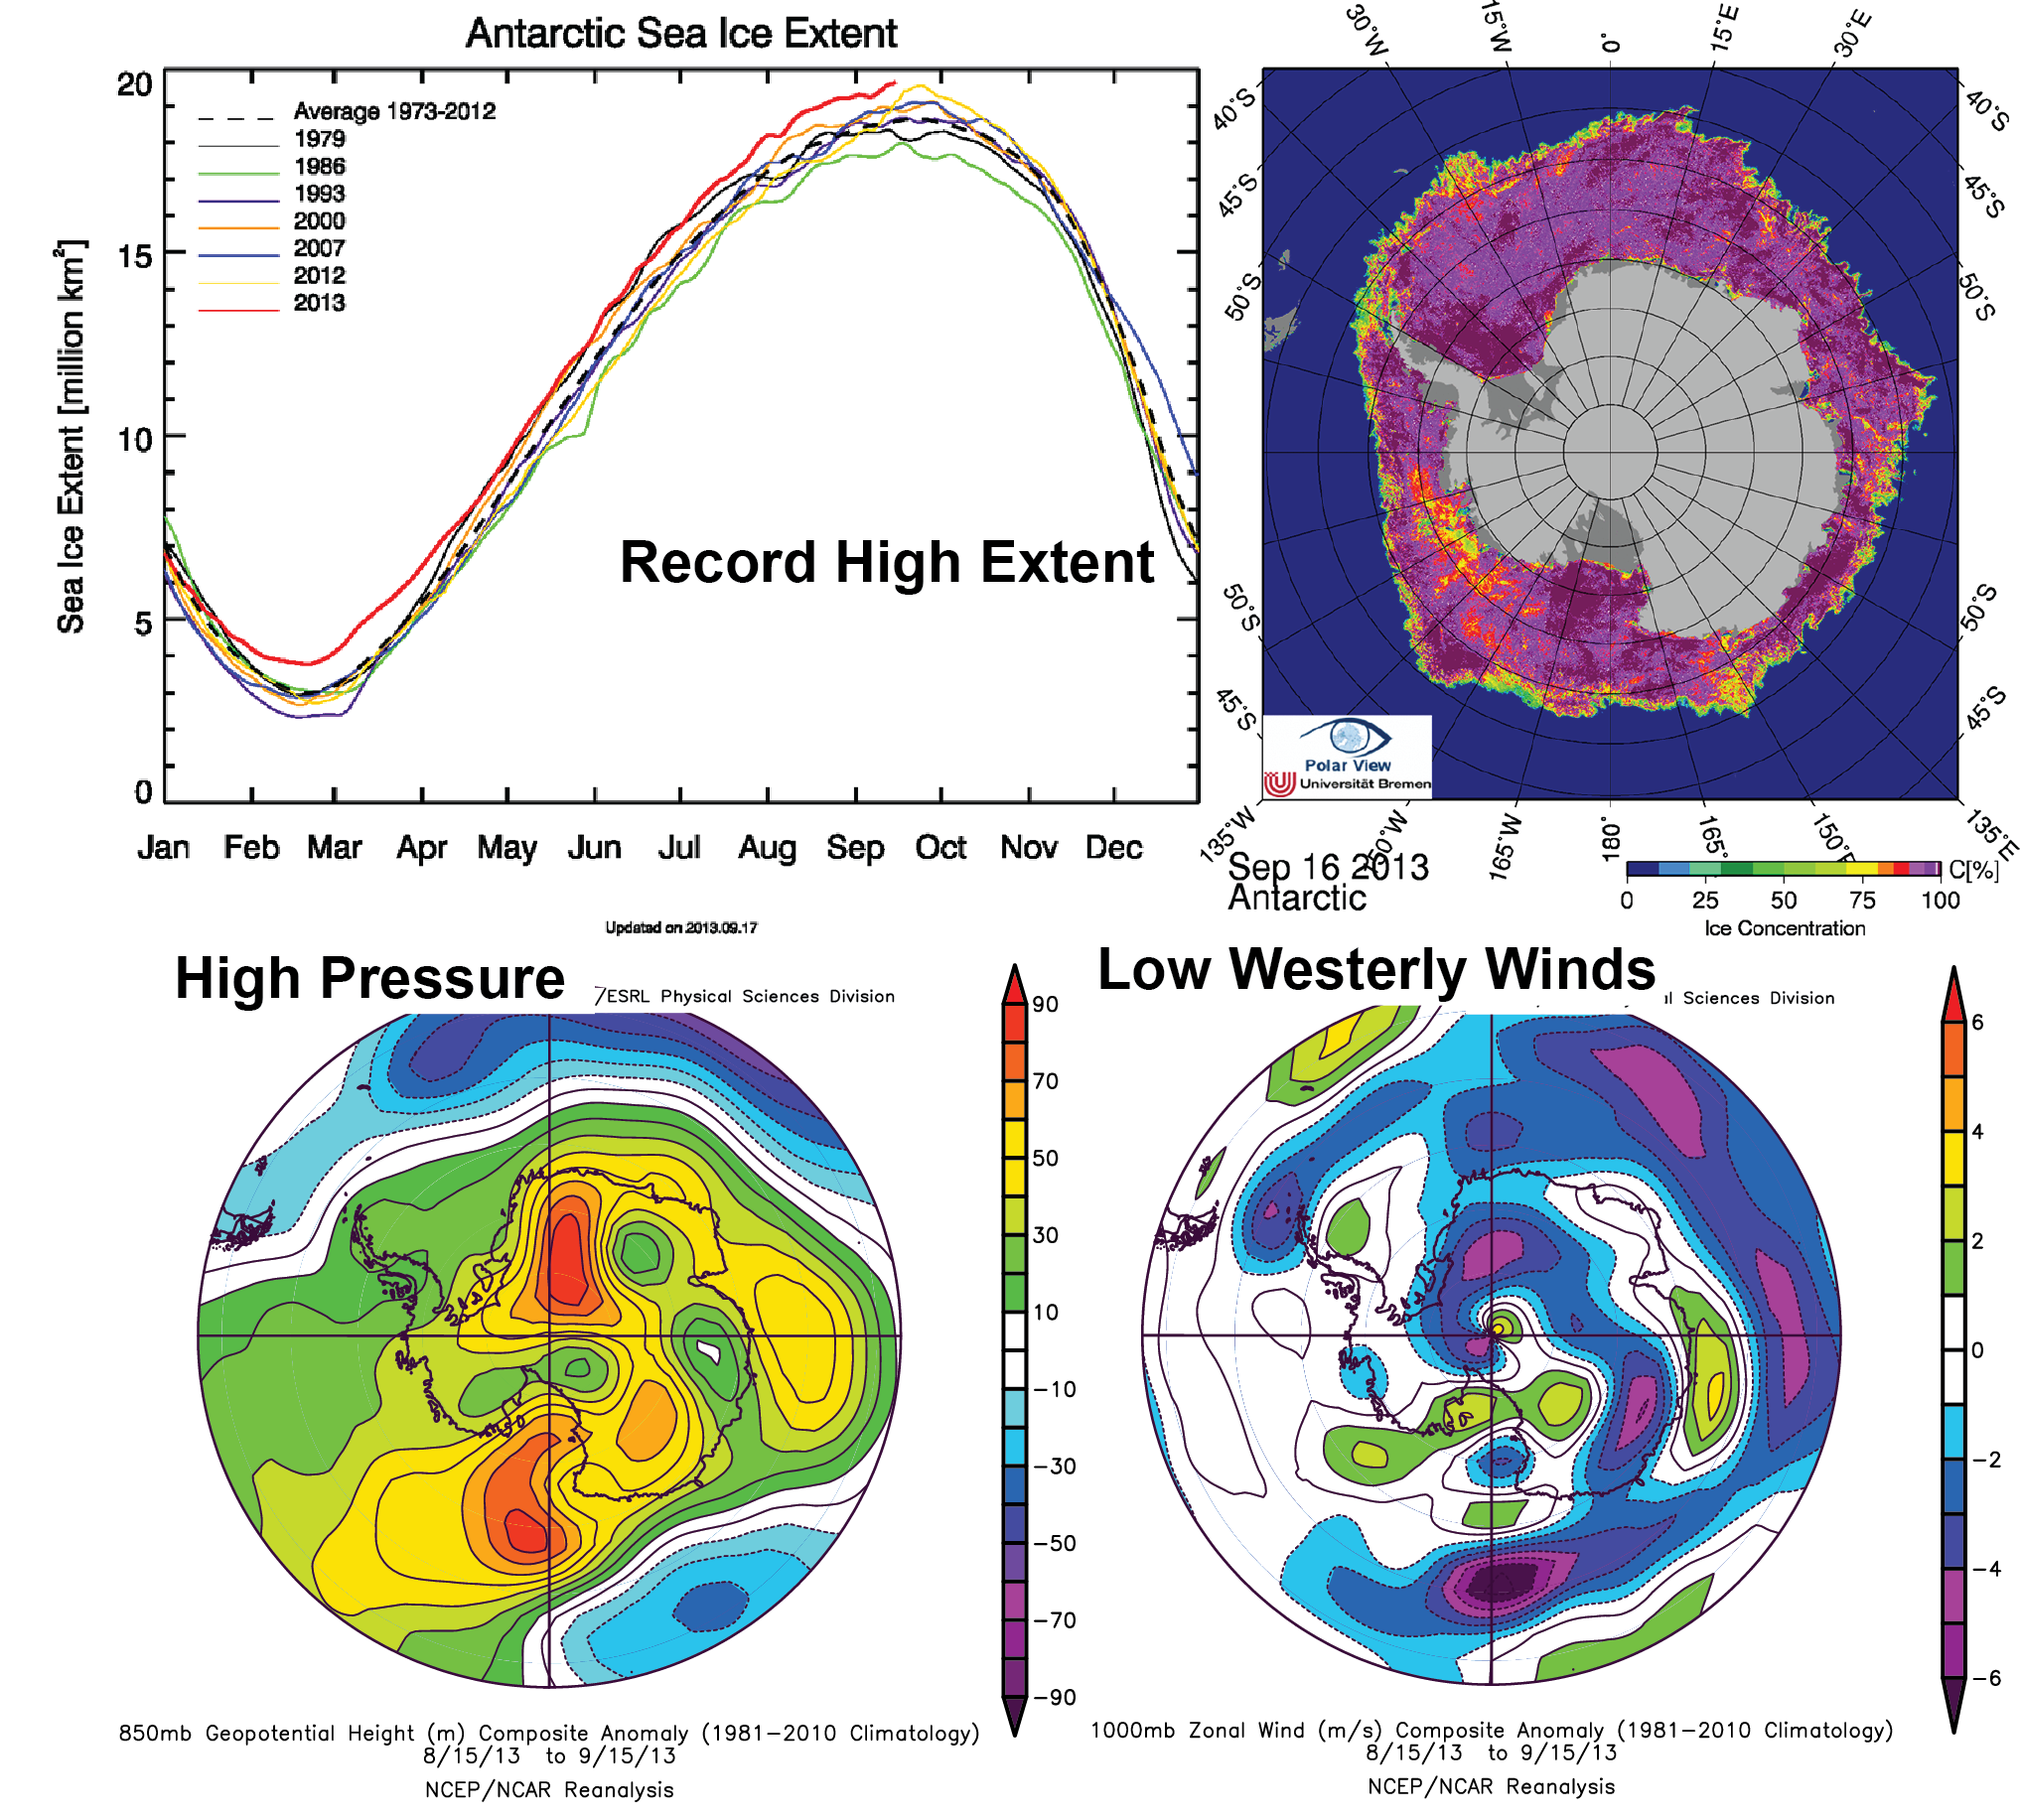
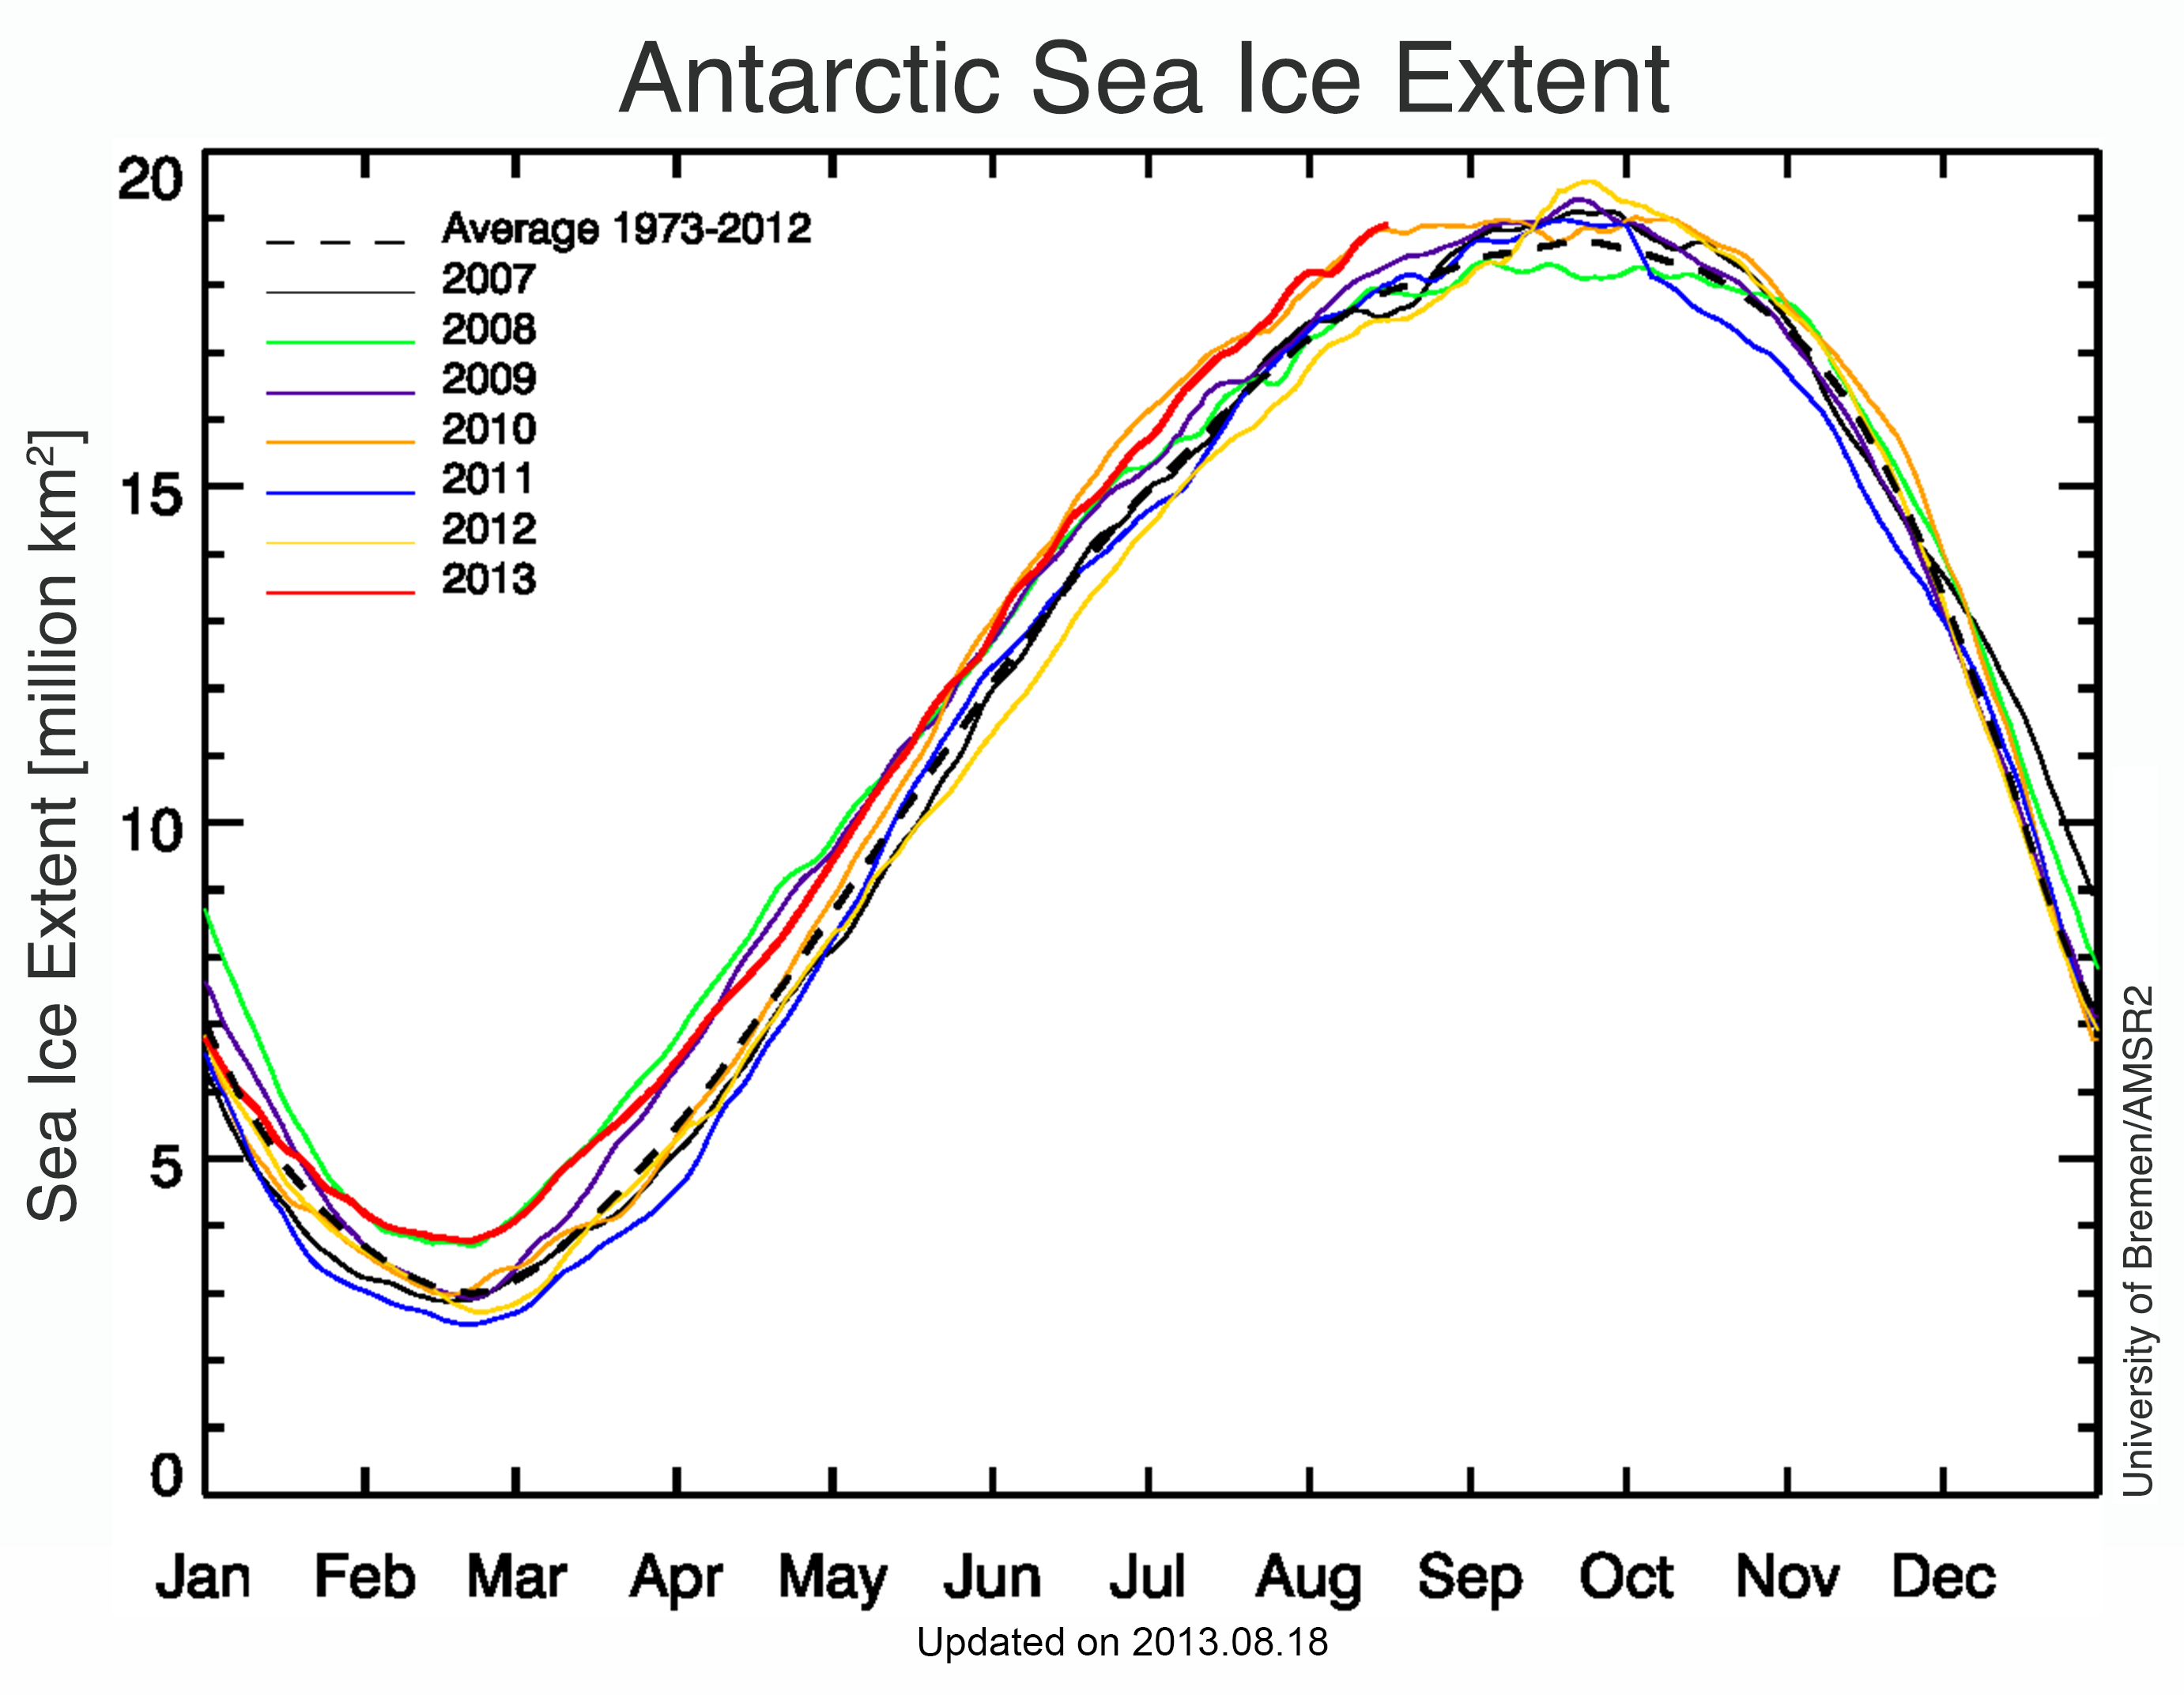
While it is early winter in the Arctic, it is early summer in the Antarctic. Continuing patterns seen in recent years, Antarctic sea ice extent remains unusually high, near or above previous daily maximum values for each day in November. Sea ice is anomalously extensive across the Peninsula, the Amundsen Sea, and the Wilkes Land sectors. However, it has retreated in the northern Ross Sea region—where it had been far to the north of the mean ice edge—to more typical extent locations. Sea ice extent averaged 17.16 million square kilometers (6.63 million square miles) for November. The long-term 1981 to 2010 average extent for this month is 16.30 million square kilometers (6.29 million square miles).
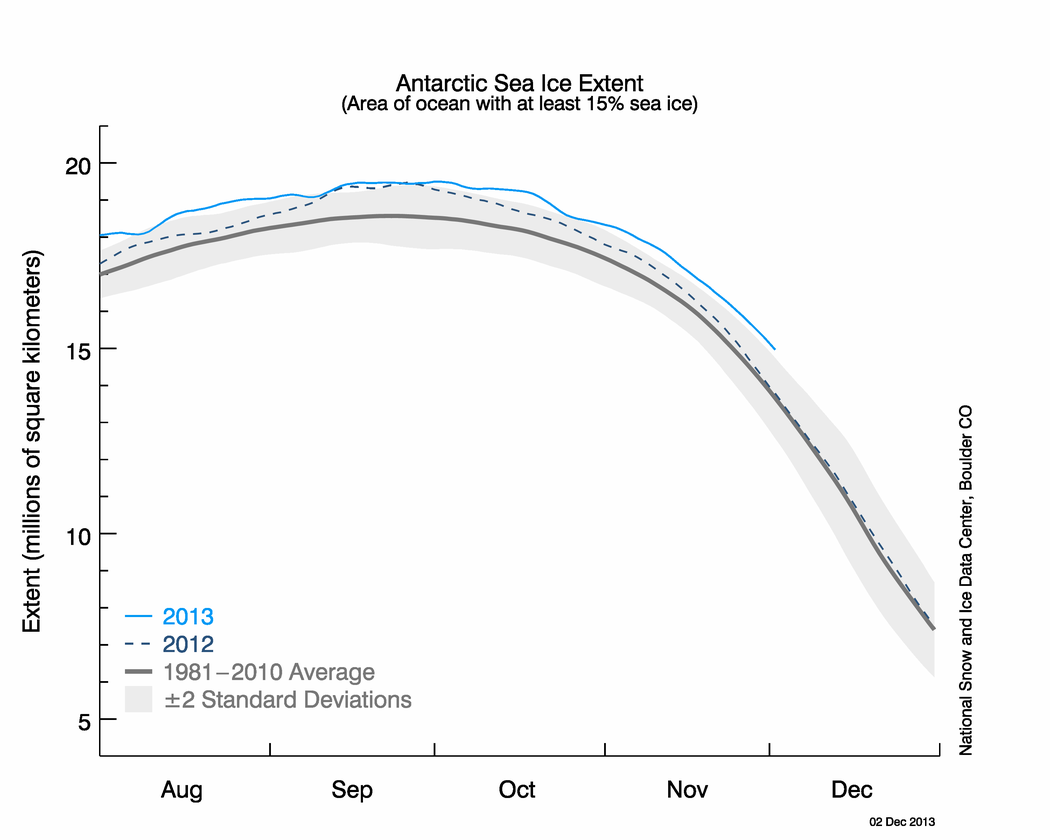
Figure 4b. The graph above shows Antarctic sea ice extent as of December 2, 2013, along with daily ice extent data for the previous year. 2013 is shown in light blue and 2012 in dark blue. The 1981 to 2010 average is in dark gray. Sea Ice Index data.
Credit: National Snow and Ice Data Center
High-resolution image
Beginning in October, wind conditions in the Ross Sea shifted from a direction favoring a northward growth of sea ice to a more westerly direction. This and the coming of sunshine and warmth with spring led to a retreat from record ice extents there. However, November brought cool conditions (1 to 3 degrees Celsius, or 2 to 5 degrees Fahrenheit, below the 1981 to 2010 average) around the Peninsula and much of the western hemisphere of the Southern Ocean. Winds have also favored a northward drift along the western Peninsula. Overall, cool conditions and extensive ice around the Peninsula strongly contrast with the past few decades’ shift to a more ice free Peninsula and extensive surface melting there. Palmer Station, the U.S. Antarctic research base, was once again briefly surrounded by sea ice this winter, as it was in 2012.
Overall, the extreme sea ice extent may be linked to strong variations in the westerly wind flow, the main circulation around Antarctica. Strong westerly flow favors ice growth in autumn and early winter, and this was the case; however, as sea ice approached a maximum, the westerly wind pattern abated, allowing ice to drift even further north than usual, in some places urged on by southerly winds.
At the same time, part of the interior has seen record warm winter events, with several daily temperature records set at the South Pole . These warm events are also linked to the reduction in westerly wind strength in August to October. Weaker westerly winds allow more north-south flow into Antarctica, occasionally bringing relatively warm air masses into the interior. Between September 11 and September 15, usually a time of unimaginable cold, four daily maximum temperature records were set, in one case by more than 8.5 degrees Celsius (15.3 degrees Fahrenheit). On September 13, the temperature reached –27.7 degrees Celsius (–17.9 degrees Fahrenheit), a temperature more typical of early summer conditions.
Big berg backs out of bay
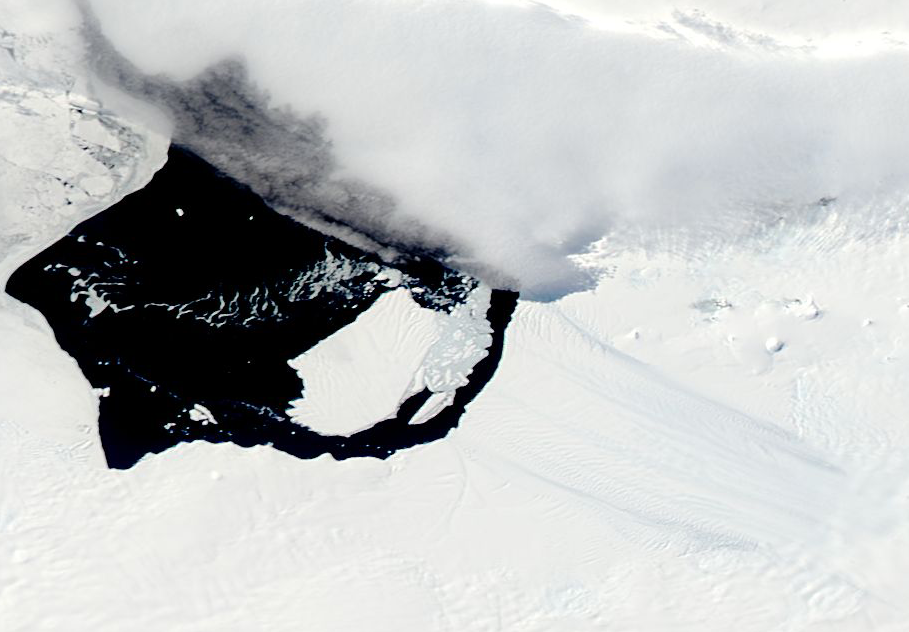
Figure 5. The Moderate Resolution Imaging Spectroradiometer (MODIS) aboard NASA’s Aqua satellite captured a true-color image of the iceberg in Pine Island Bay on November 16. The iceberg has been named B-31 by the U.S. National Ice Center and is about 35 kilometers by 20 kilometers, roughly the size of Singapore.
Credit: Jeff Schmaltz, MODIS Land Rapid Response Team, NASA GSFC
High-resolution image
In Pine Island Bay, a medium-sized iceberg that had been pinned on a shoal near the front of Pine Island Glacier began to drift into the Southern Ocean. The iceberg has received significant attention because it has broken away from Antarctica’s largest glacier (as measured by amount of ice moved per year). Pine Island Glacier has accelerated significantly in recent years as increasingly warm ocean water at depth have melted and thinned the ice at the point where the glacier goes afloat. NASA scientists and other groups like the British Antarctic Survey have installed instruments and are making further measurements to determine if the glacier will accelerate further in the aftermath of the loss of the iceberg.
Increased methane emission from the Siberian sea floor
A recent paper by colleagues at the University of Alaska Fairbanks suggests that ocean bottom water temperatures are increasing as Arctic sea ice cover has decreased, leading to a recent increase in methane flux from the seabed to the atmosphere. Ship-based observations show that methane concentrations in the air above the East Siberian Sea Shelf are nearly twice as high as the global average.
The Siberian continental shelf is a vast region of shallow-water covered continental crust, comprising about 20% of the global area of the continental shelf. During the last glacial maximum, much of the shelf was exposed to the cold atmosphere and froze to a depth of about 1.5 kilometers (about 1 mile). Layers of sediment below the permafrost slowly emit methane gas, and this gas has been trapped for millennia beneath the permafrost. As sea levels rose at the end of the ice age, the shelf was once again covered by relatively warm ocean water, thawing the permafrost and releasing the trapped methane. Methane is a potent greenhouse gas but is relatively short-lived in the atmosphere (about 12 years), leading to reduced global warming potential over time. In the short-term however, methane has a global warming potential 86 times that of carbon dioxide.
Reference
Shakhova, N., I. Semiletov, I. Leifer, V. Sergienko, A. Salyuk, D. Kosmach, D. Chernykh, C. Stubbs, D. Nicolsky, V. Tumskoy, and Ö. Gustafsson. 2013. Ebullition and storm-induced methane release from the East Siberian Arctic Shelf. Nature Geoscience, http://dx.doi.org/10.1038/ngeo2007 .