Sea ice extent grew throughout October, as the temperature dropped and darkness returned to the Arctic. However, a period of relatively slow ice growth early in the month kept the average ice extent low—October 2009 had the second-lowest ice extent for the month over the 1979 to 2009 period.
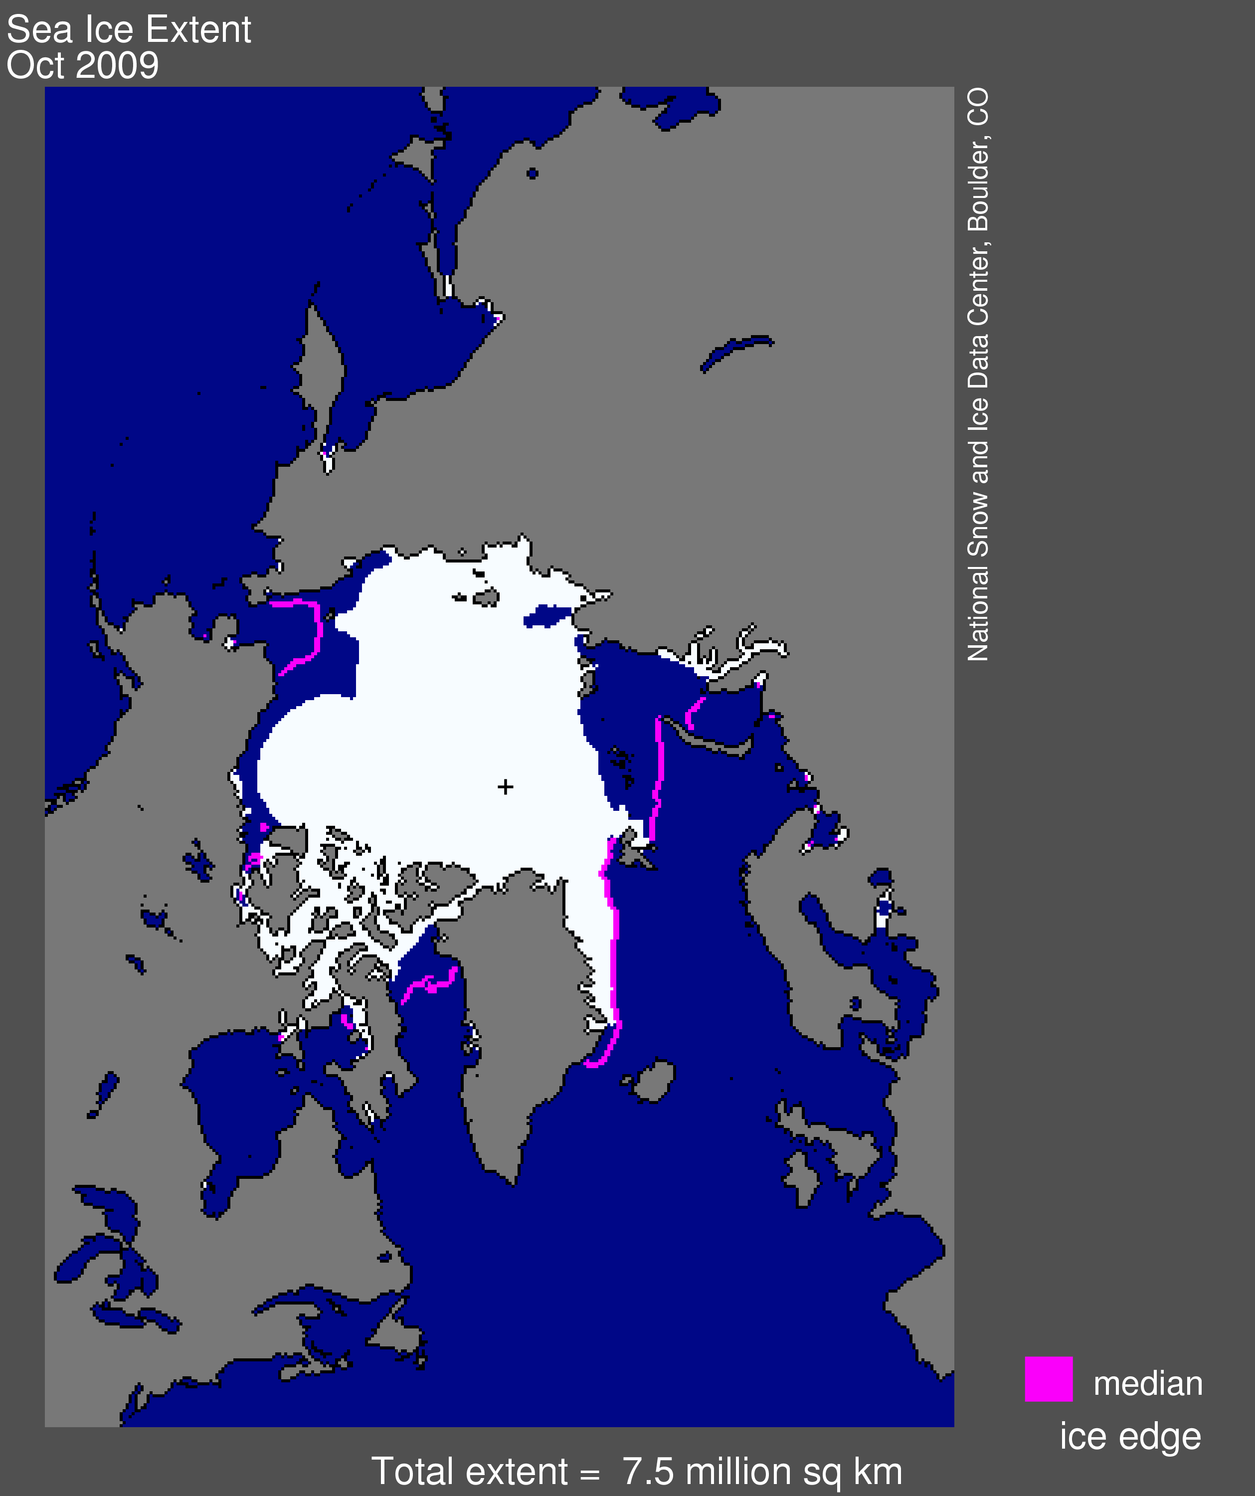 Figure 1. Arctic sea ice extent for October 2009 was 7.50 million square kilometers (2.90 million square miles). The magenta line shows the 1979 to 2000 median extent for that month. The black cross indicates the geographic North Pole. Sea Ice Index data. About the data. —Credit: National Snow and Ice Data Center
High-resolution image
Overview of conditions
Sea ice extent averaged over October 2009 was 7.50 million square kilometers (2.90 million square miles). This was 1.79 million square kilometers (691,000 square miles) below the 1979 to 2000 mean for October, but 730,000 square kilometers (282,000 square miles) above the record low for the month, which occurred in October 2007.
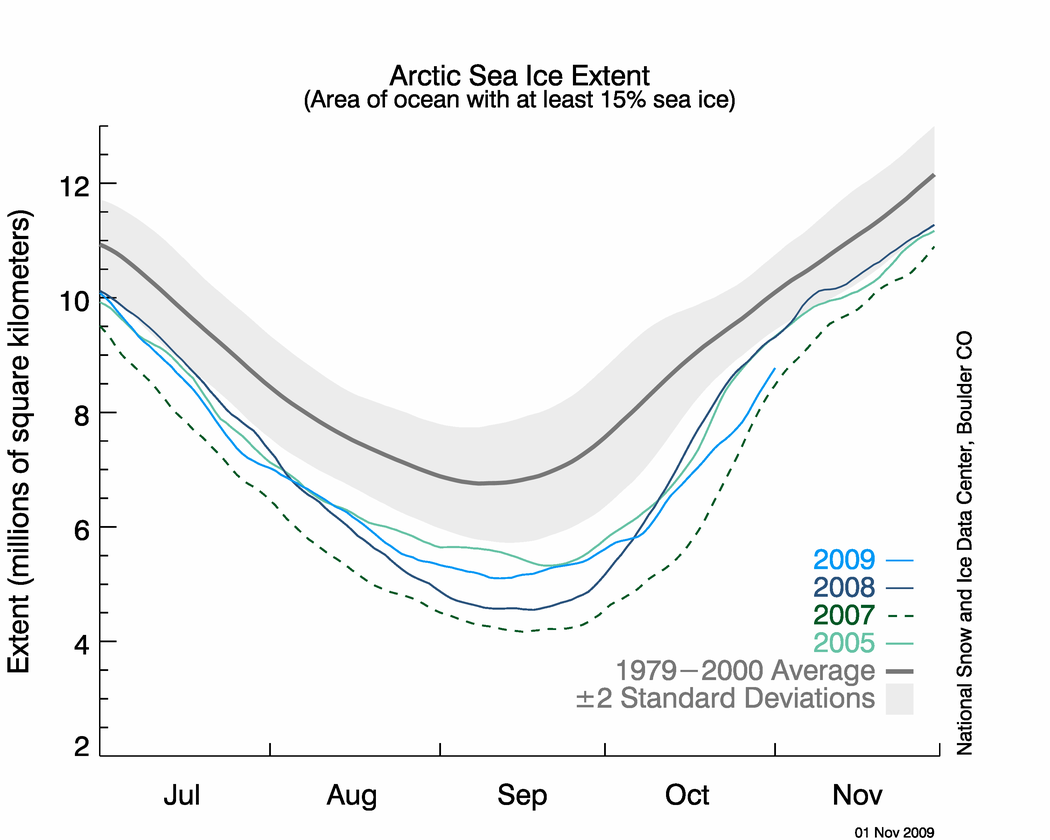 Figure 2. The graph above shows daily sea ice extent as of November 1, 2009. The solid light blue line indicates 2009; dark blue shows 2008, dashed green indicates 2007; light green shows 2005; and solid gray indicates average extent from 1979 to 2000. The gray area around the average line shows the two standard deviation range of the data. Sea Ice Index data.—Credit: National Snow and Ice Data Center
High-resolution image
Conditions in context
In the fall, cold conditions and polar darkness return to the Arctic. As is typical for this time of year, ice growth was brisk in October, growing at an average 96,000 square kilometers per day (37,000 square miles per day).
However, the growth rate slowed for a time in early October, coinciding with strong winds from the south over central Siberia. The winds helped prevent ice from forming along the Siberian coast. At the end of the month, extensive areas of open water regions were still present in the northernmost North Atlantic, and north of Alaska. The ice edge was north of both Svalbard and Franz Josef Land.
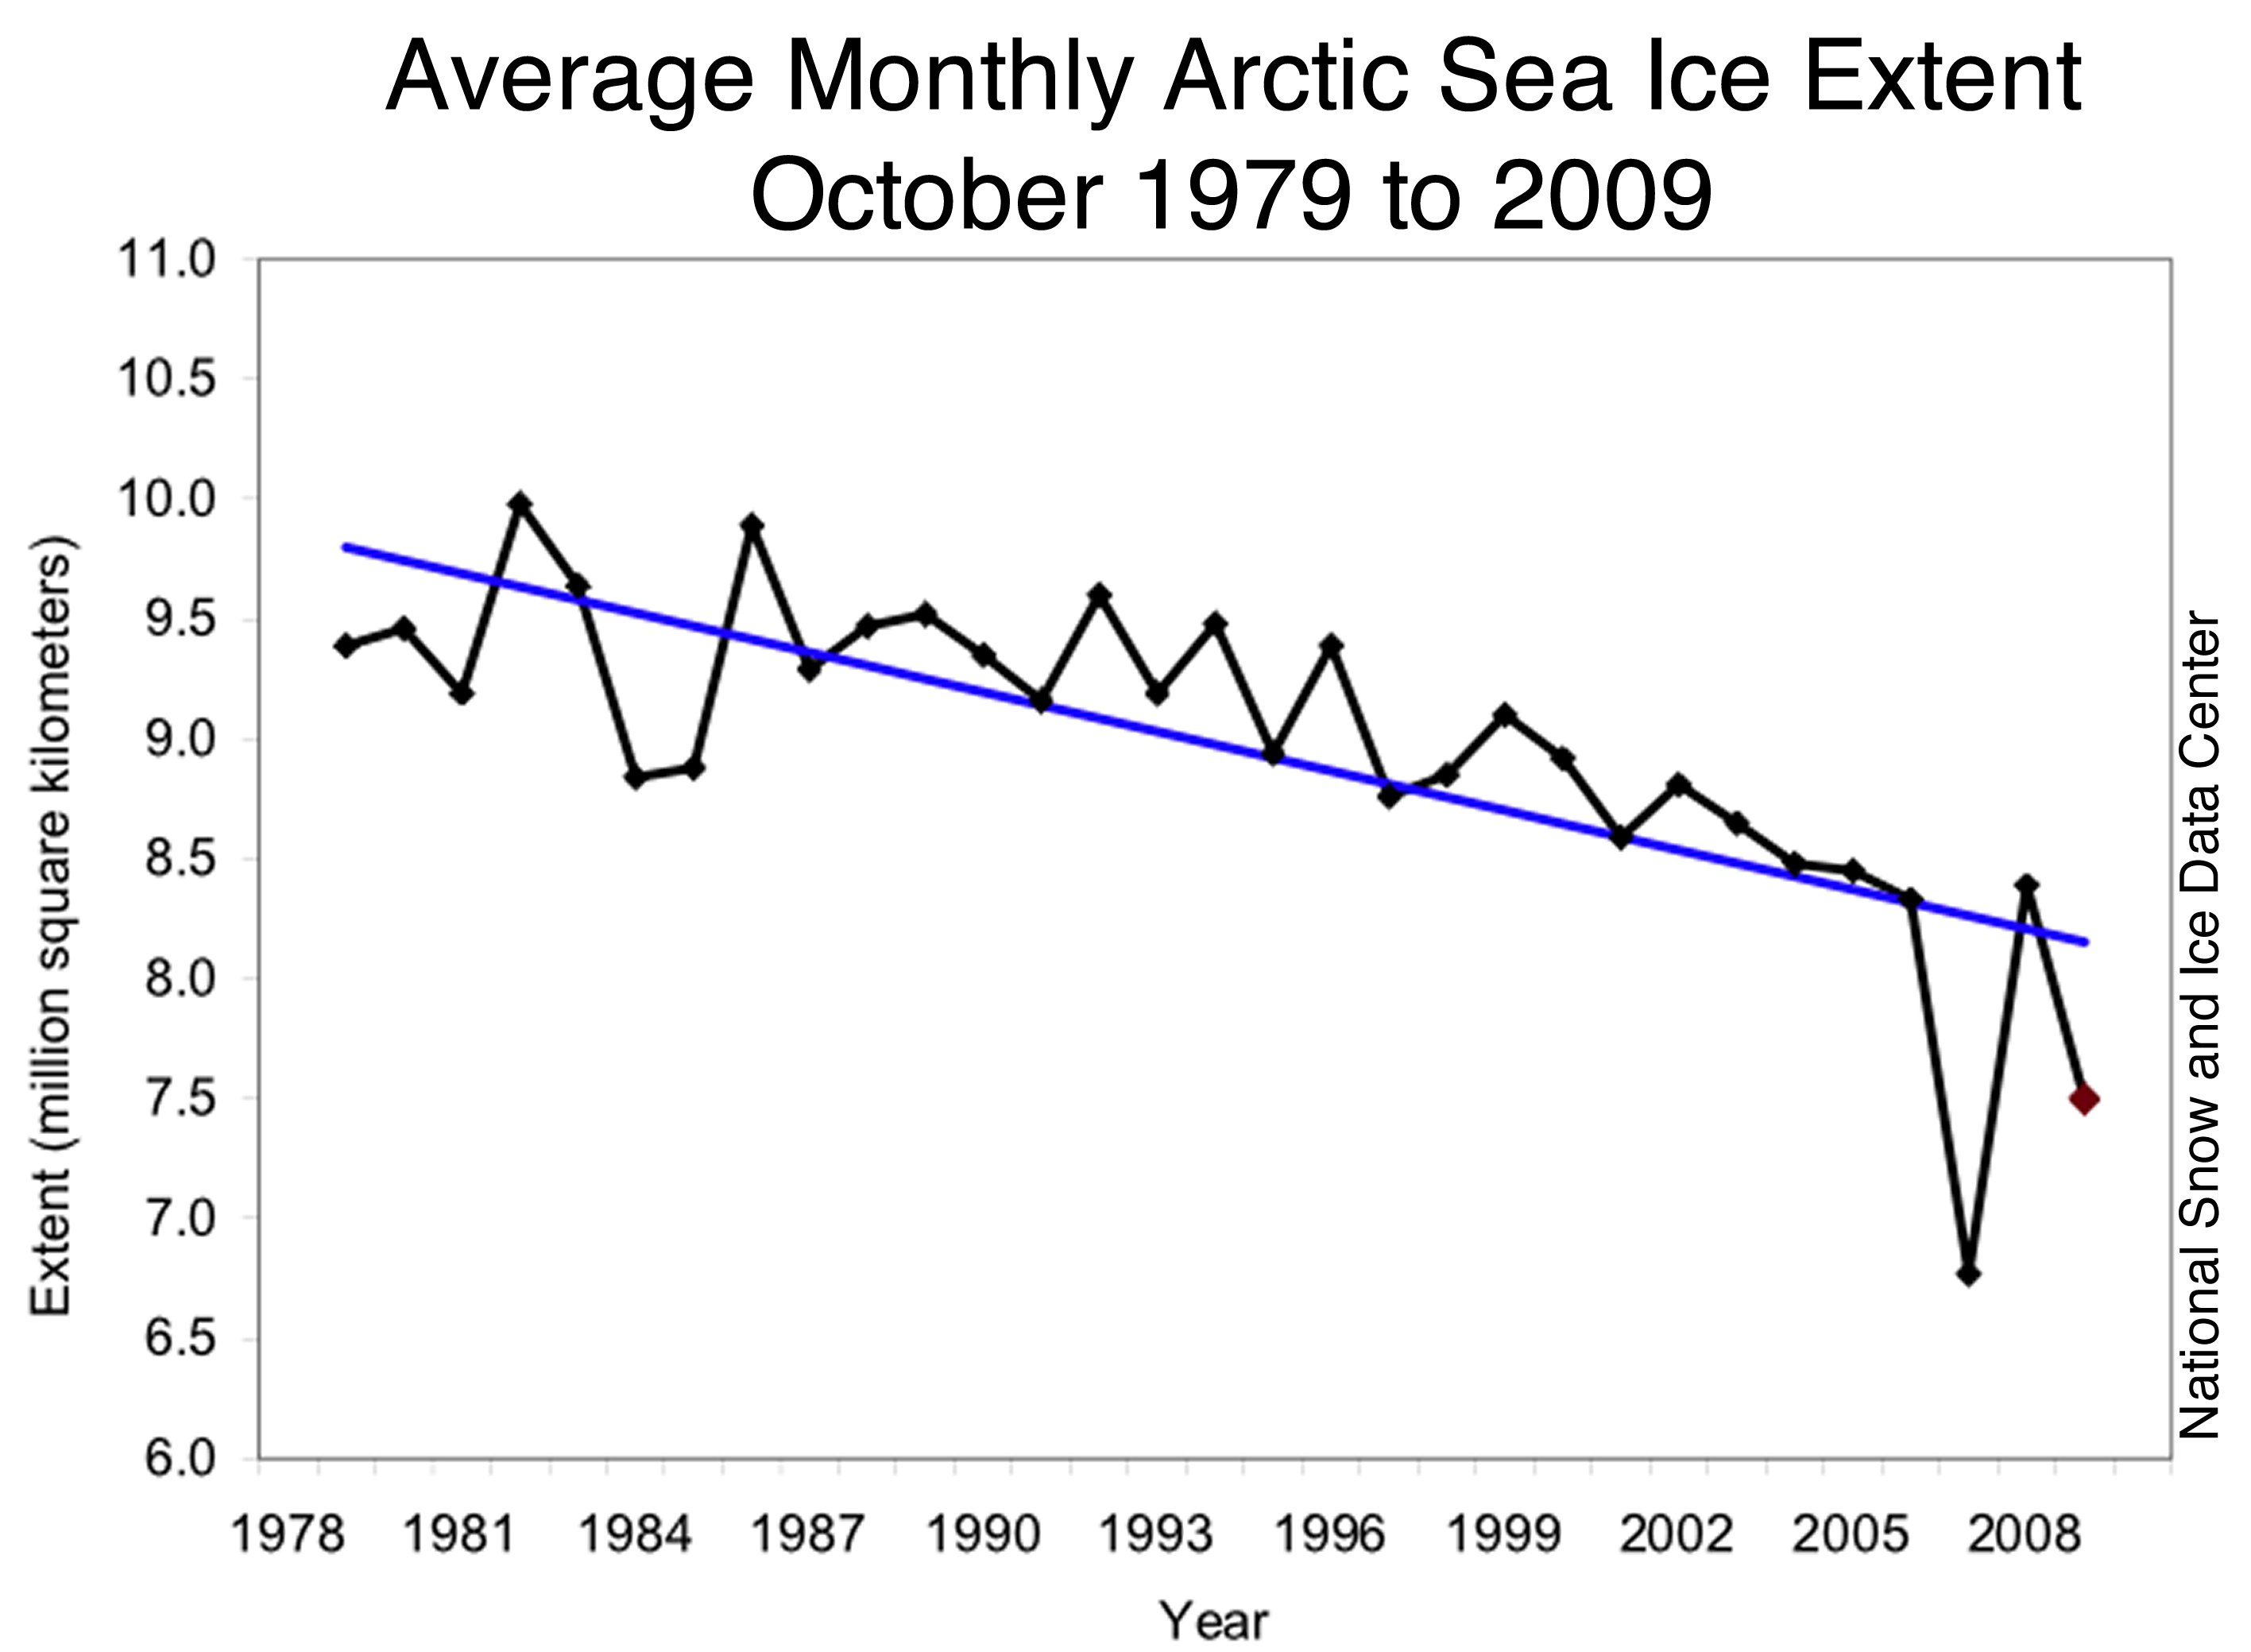
Figure 3. Monthly October ice extent for 1979 to 2009 shows a decline of 5.9% per decade. —Credit: National Snow and Ice Data Center
High-resolution image
October 2009 compared to past years
The period of slow ice growth at the beginning of the month helped to keep October average ice extent low. Arctic sea ice extent was 950,000 square kilometers (367,000 square miles) below October 2005 and 890,000 square kilometers (340,000 square miles) below that measured in 2008. Although ice extent for October 2009 was 730,000 square kilometers (282,000 square miles) above the record low for the month in 2007, it steepened the linear trend for October slightly to -5.9 % per decade.
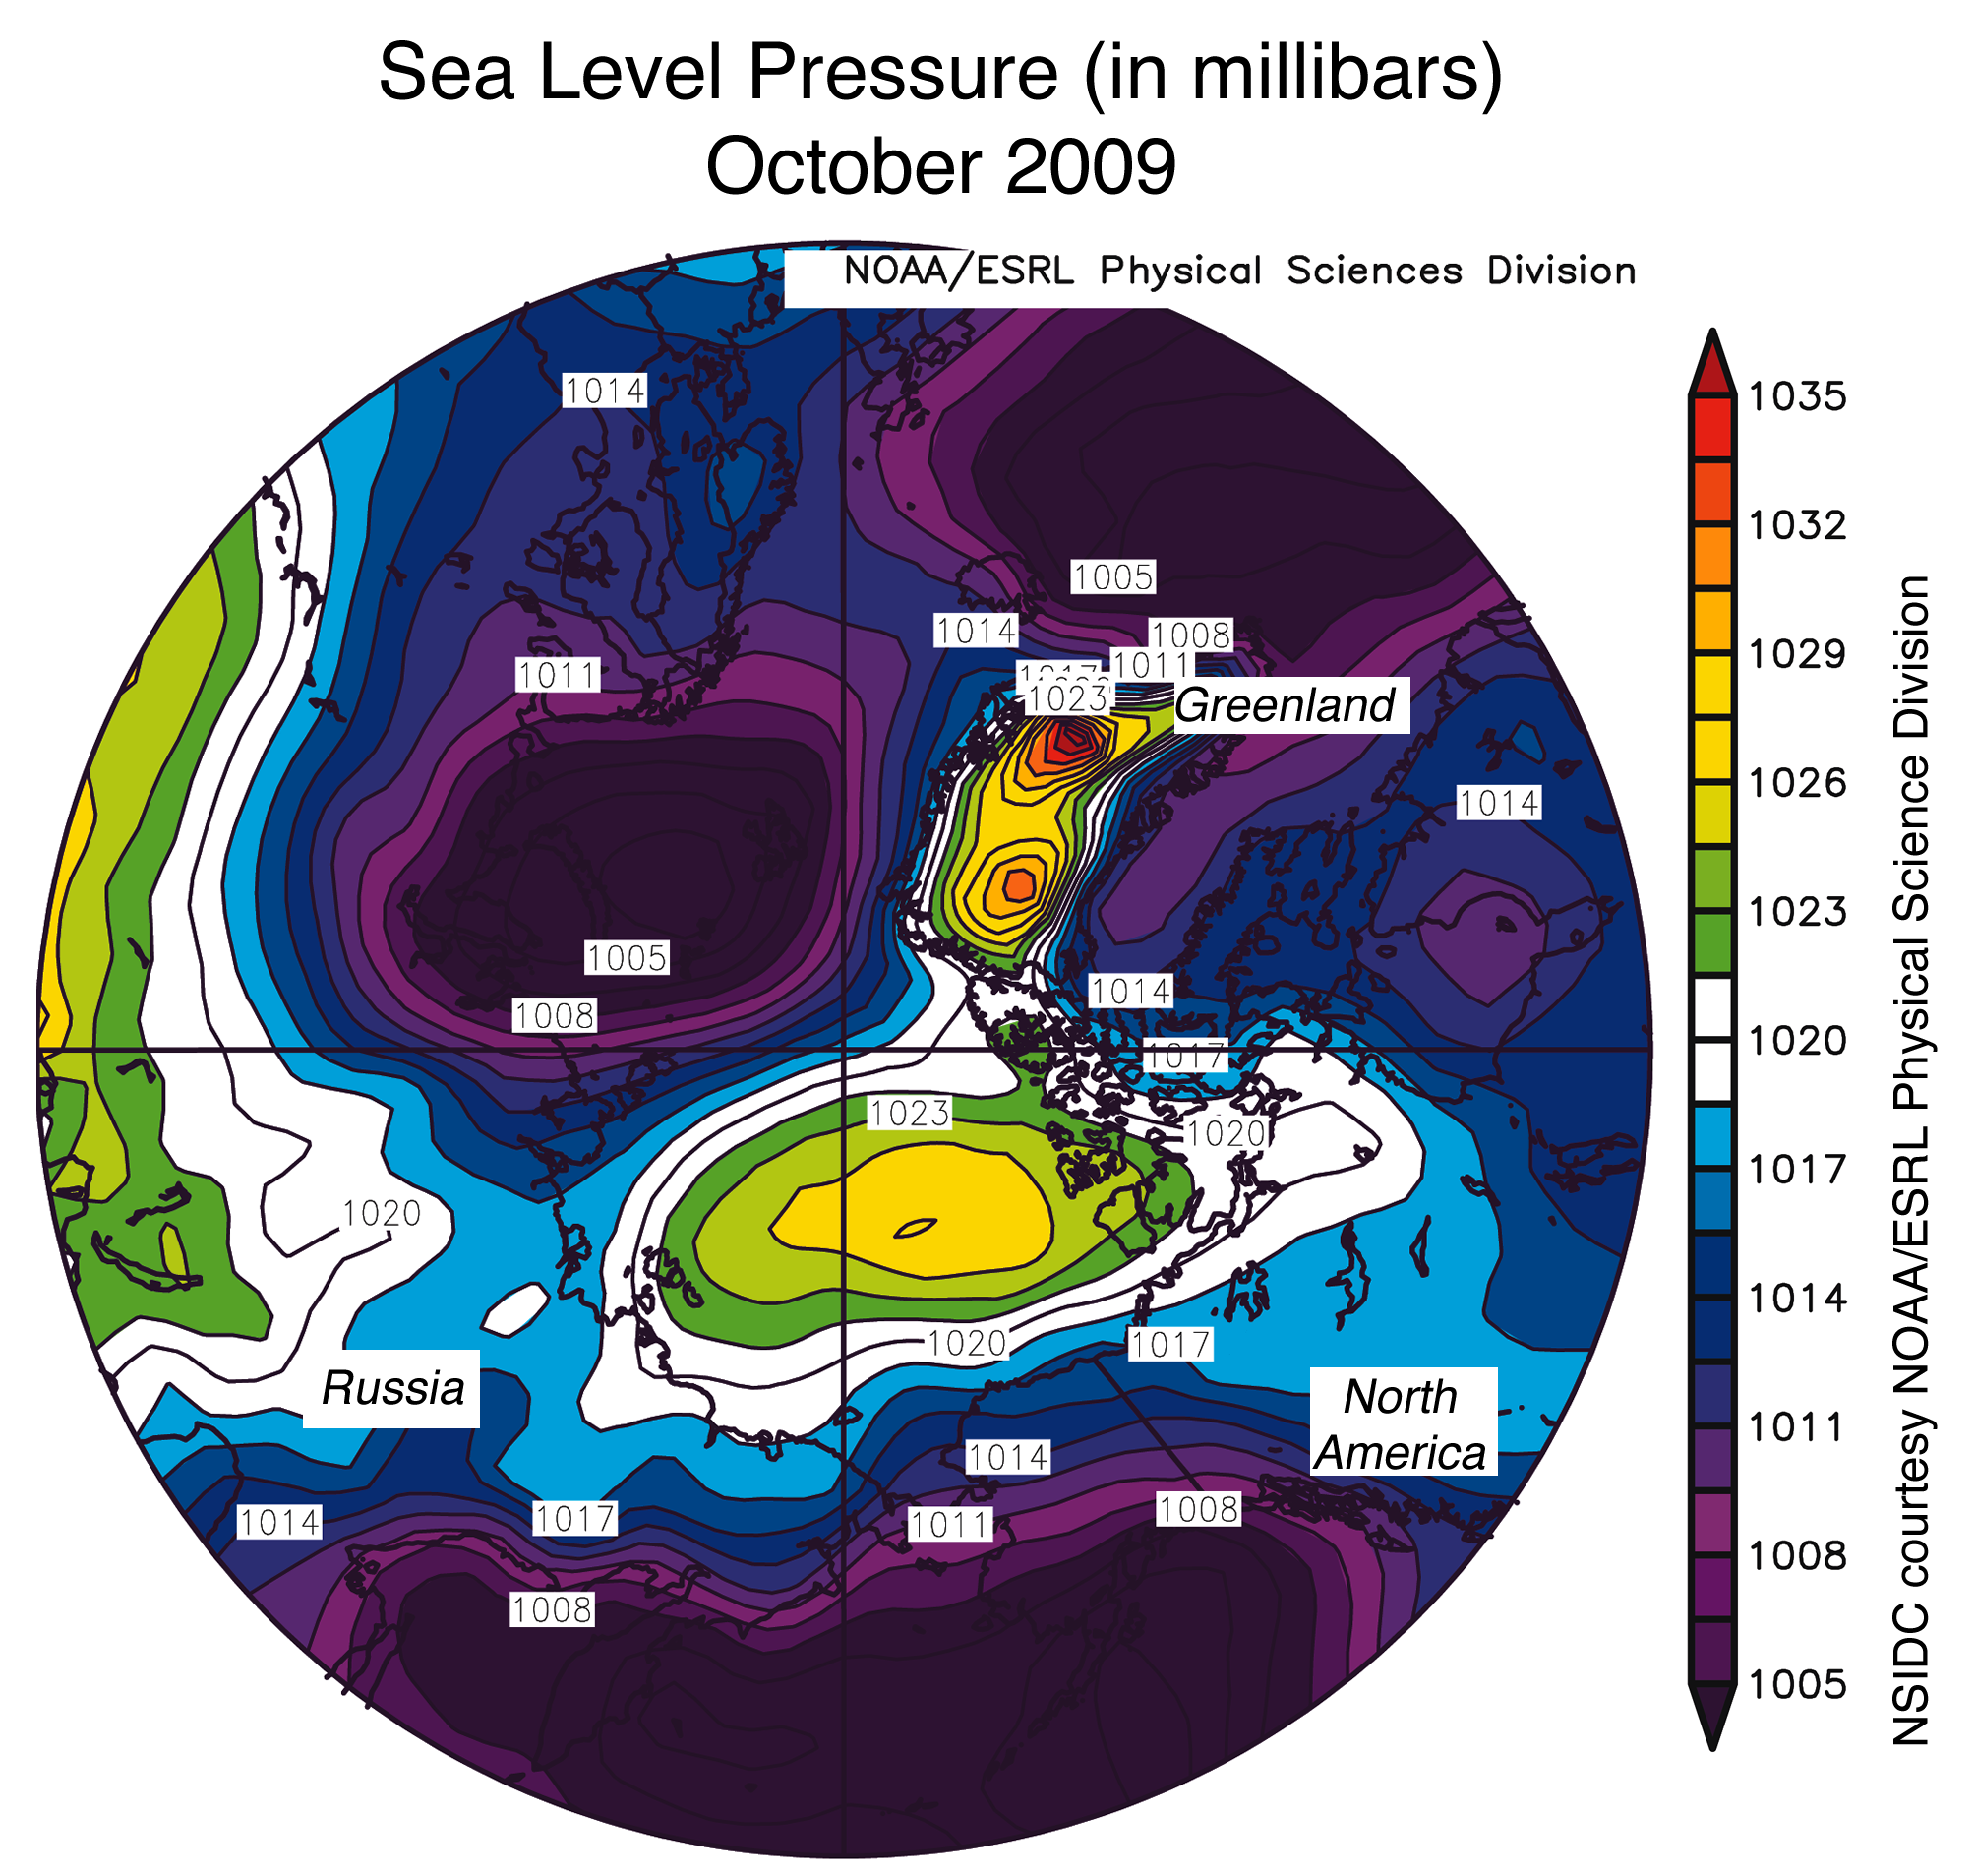
Figure 4. The map of sea level pressure (in millibars) from October 1 to 30, 2009 shows a strong high-pressure cell over the Beaufort Sea, and low pressure over the Barents Sea. These pressure patterns led to warm southerly winds.—Credit: National Snow and Ice Data Center courtesy NOAA/ESRL Physical Sciences Division
High-resolution image
A warm October
For most of the month, a high-pressure system sat over the Beaufort Sea, while unusually low pressure dominated the Barents Sea. In accord with Buys Ballot’s Law, the area between the two pressure centers saw strong, warm winds blowing from the south. This wind pattern, in conjunction with extensive open water, led to a mean monthly temperature as high as 6 degrees Celsius (11 degrees Fahrenheit) above average in the region between the high and low pressure anomalies (October air temperature map).
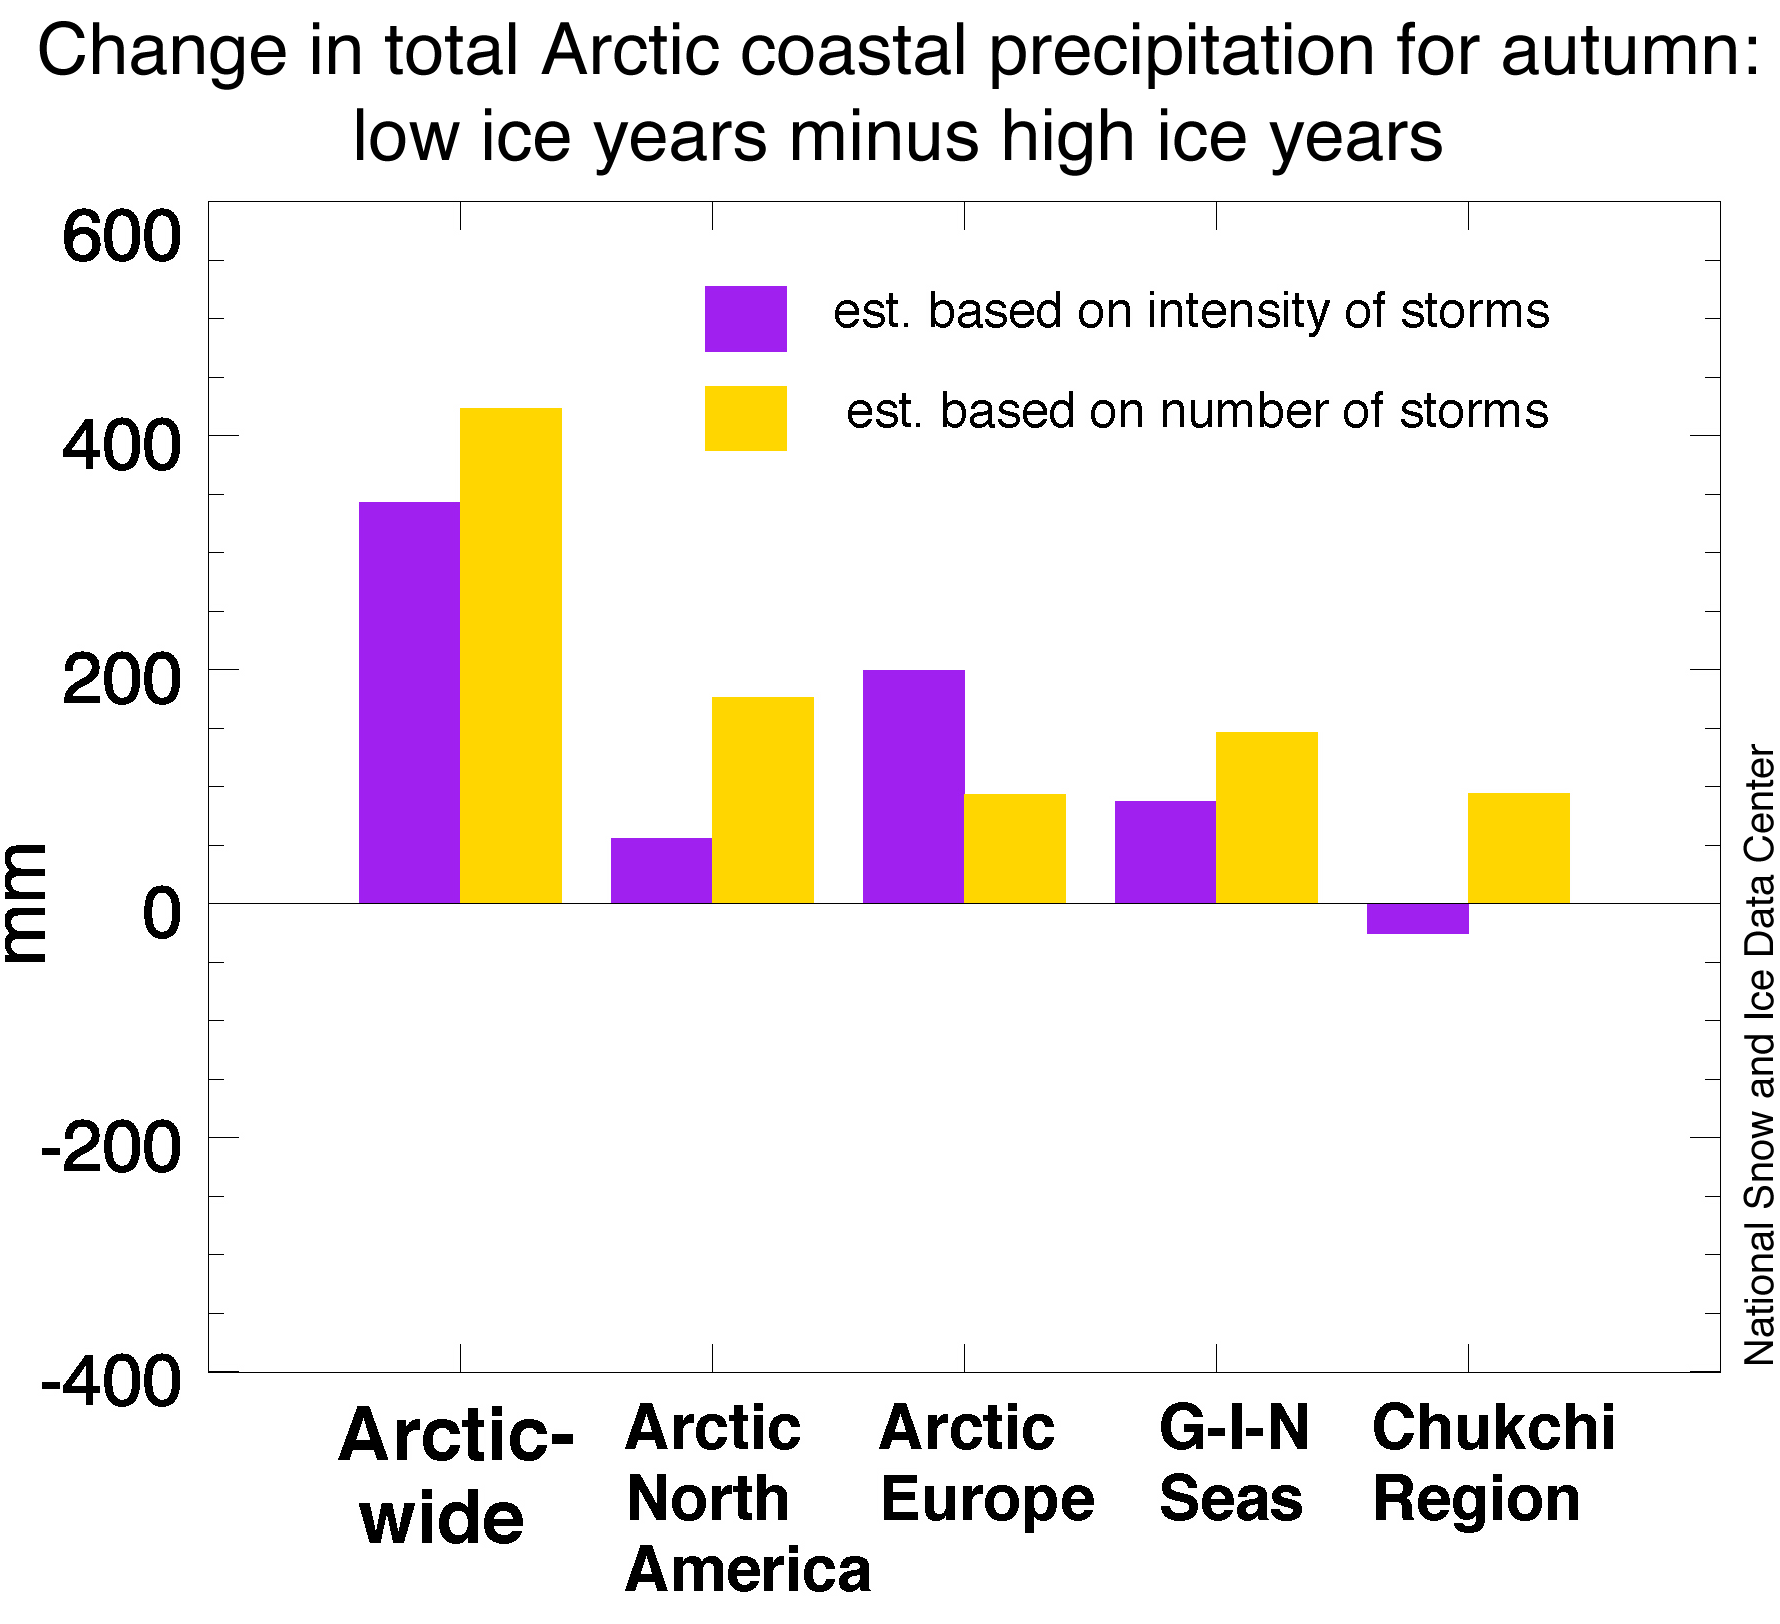
Figure 5. This bar graph shows that during years of low sea ice extent, precipitation is typically greater than during high ice extent years. The graph is based on storm counts for September, October, and November, in high and low ice years. High ice years in the study are 1980, 1983, 1986, 1992, 1996; low ice years are 2003, 2005, 2006, 2007, and 2008.)—Credit: National Snow and Ice Data Center
High-resolution image
Declining sea ice extent and Arctic storms
A new study by Ian Simmonds and Kevin Keay, at the University of Melbourne in Australia, finds connections between the decline in September sea ice extent and the characteristics of Arctic storms. As ice extent has decreased, Arctic storms have shown a tendency to become more intense, especially in the last few years. The study suggests that low September ice extent, with extensive areas of open water, provides more energy to autumn storms, allowing them to become stronger. The stronger storms also help to break up the ice.
Related research at NSIDC reveals that when September ice extent is unusually low, precipitation linked to Arctic storms tends to be greater than when September ice extent is unusually high (Figure 5). Climate scientists are interested in these studies, because increased autumn snowfall could have effects on both sea ice and permafrost in the Arctic.
References
Simmonds, I., and K. Keay. 2009. Extraordinary September Arctic sea ice reductions and their relationships with storm behavior over 1979–2008, Geophys. Res. Lett., 36, L19715, doi:10.1029/2009GL039810.
For previous analyses, please see the drop-down menu under Archives in the right navigation at the top of this page.

