Sign up for the
 Arctic Sea Ice News RSS feed for automatic notification of analysis updates. Updates are also available via Twitter.Atmospheric circulation patterns in August helped spread out sea ice, slowing ice loss in most regions of the Arctic. NSIDC scientists expect to see the minimum ice extent for the year in the next few weeks. While this year’s minimum ice extent will probably not reach the record low of 2007, it remains well below normal: average ice extent for August 2009 was the third-lowest in the satellite record. Ice extent has now fallen below the 2005 minimum, previously the third-lowest extent in the satellite record.
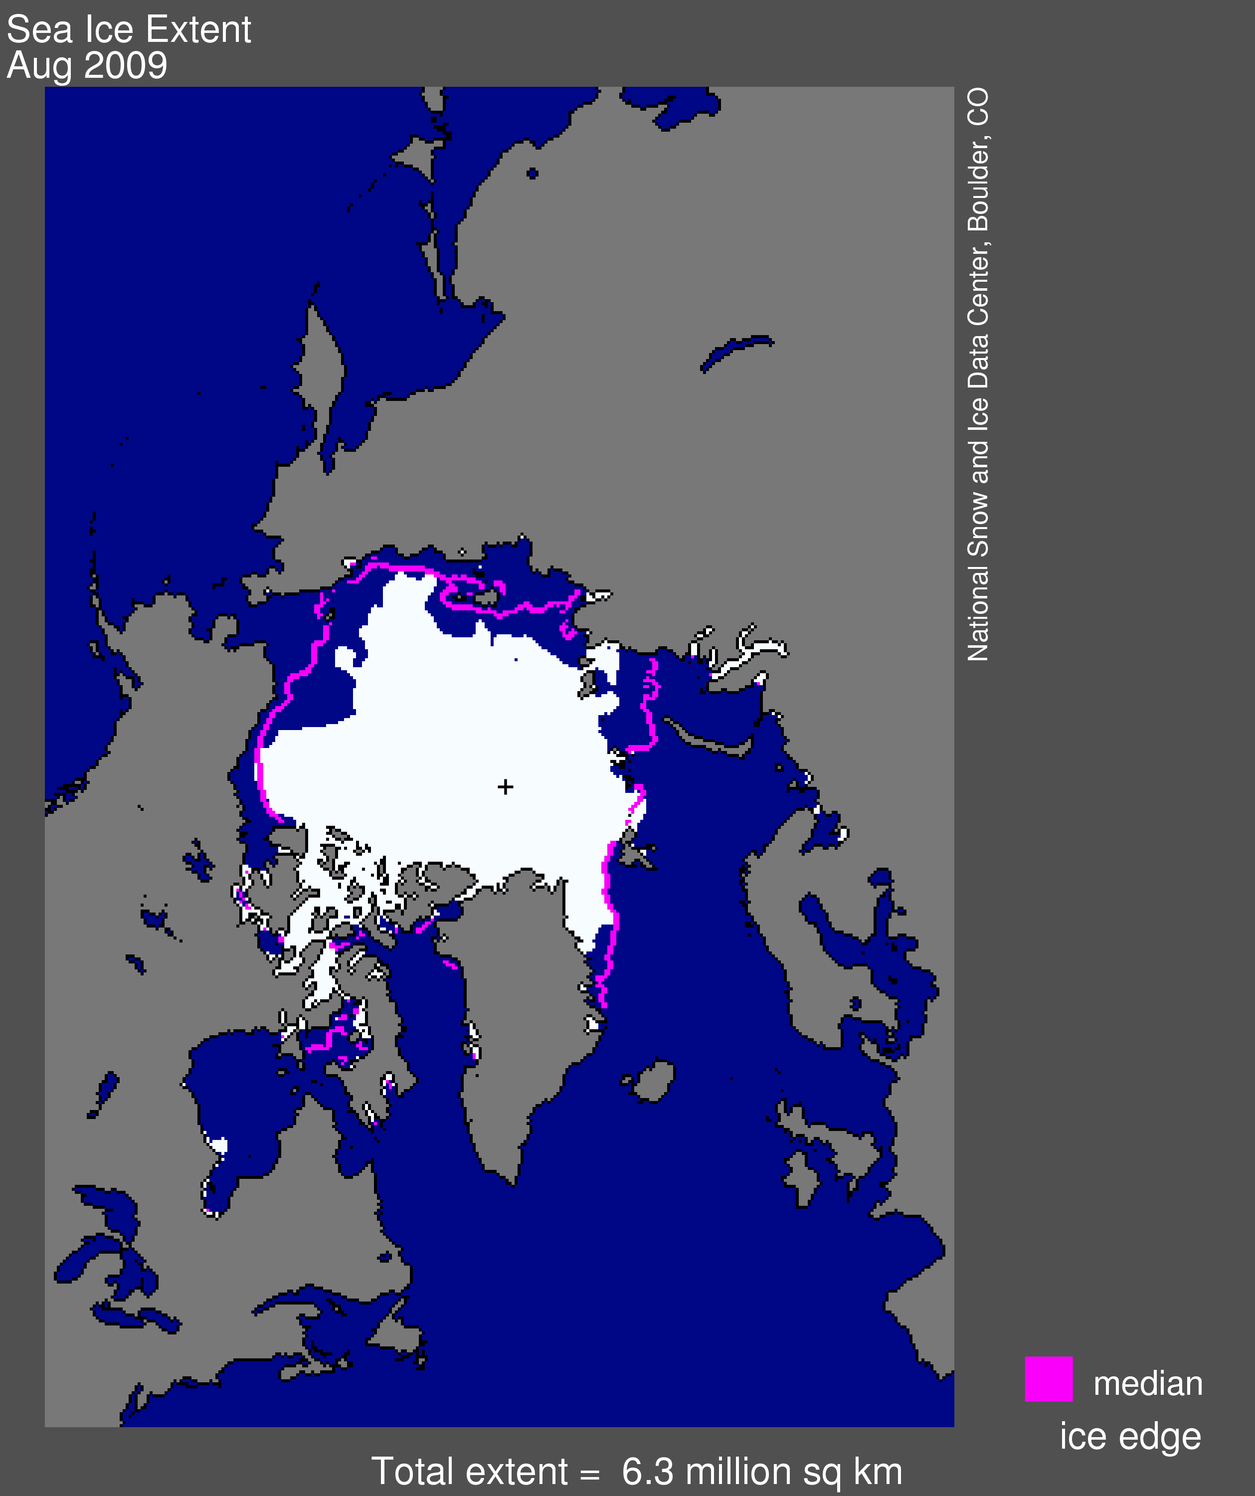 Figure 1. Arctic sea ice extent for August 2009 was 6.26 million square kilometers (2.42 million square miles). The magenta line shows the 1979 to 2000 median extent for that month. The black cross indicates the geographic North Pole. Sea Ice Index data. About the data. —Credit: National Snow and Ice Data Center
High-resolution image
Overview of conditions
Sea ice extent averaged over the month of August 2009 was 6.26 million square kilometers (2.42 million square miles). This is 900,000 square kilometers (350,000 square miles) above the record low for the month, which occurred in August 2007, 200,000 square kilometers (77,000 square miles) above August 2008, and just below the August 2005 value of 6.30 million square kilometers (2.43 million square miles). Arctic sea ice extent for August 2009 was 1.41 million square kilometers (540,000 square miles) below the 1979 to 2000 average.
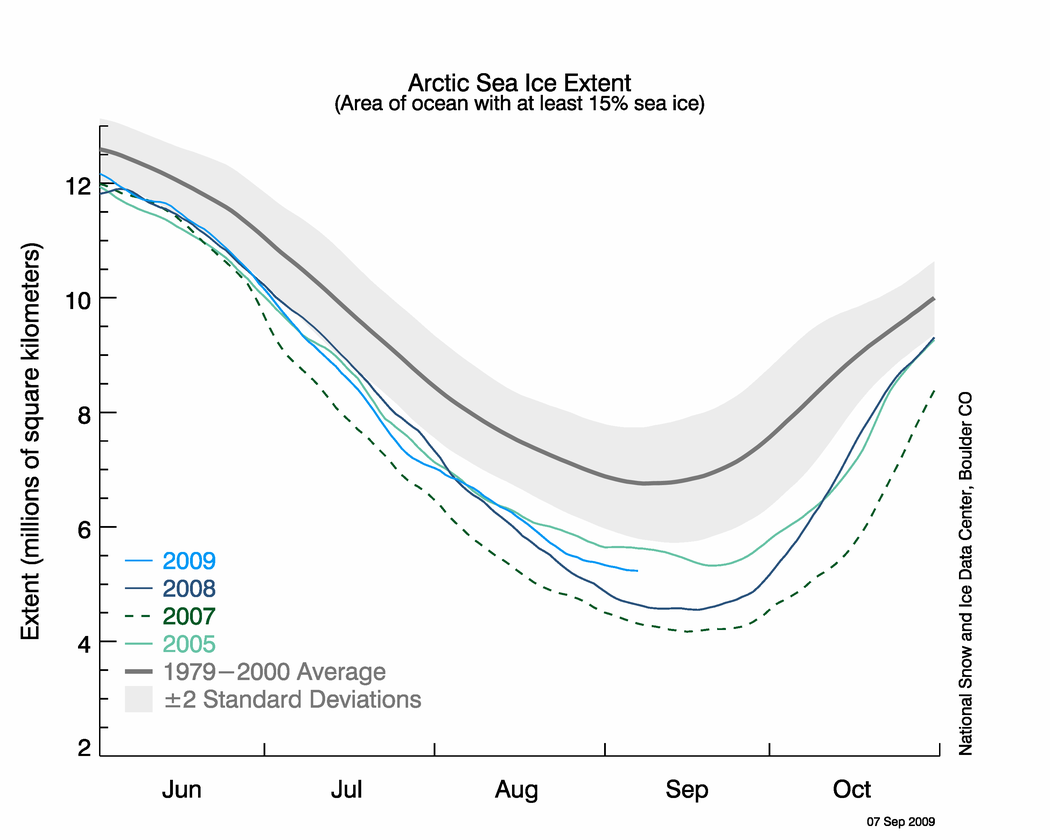 Figure 2. The graph above shows daily sea ice extent as of September 7, 2009. The solid light blue line indicates 2009; dark blue shows 2008, dashed green indicates 2007; light green shows 2005, and solid gray indicates average extent from 1979 to 2000. The gray area around the average line shows the two standard deviation range of the data. Sea Ice Index data.—Credit: National Snow and Ice Data Center
High-resolution image
Conditions in context
In the beginning of August, the rate of ice loss was fairly slow. In the middle of the month, the loss rate sped up, and then slowed again. On average, the decline rate was close to the 1978 to 2000 average for past Augusts. Ice extent declined by 55,000 square kilometers (21,000 square miles) per day during August, compared to 66,000 square kilometers (25,000 square miles) per day in August 2007 and 79,000 square kilometers (31,000 square miles) per day in August 2008. But because of the higher-than-average rate of ice loss in July, average ice extent for August 2009 was still far below the 1978 to 2000 average extent for the month.
On September 2, Arctic sea ice extent dropped below the minimum extent for 2005. This year is now the third-lowest ice extent in the satellite record, with one to two weeks left in the melt season.
The minimum ice extent for the year will probably occur in the next two weeks. NSIDC scientists are closely monitoring conditions and will report the minimum when it occurs.

Figure 3. Monthly August ice extent for 1979 to 2009 shows a decline of 8.7% per decade. —Credit: National Snow and Ice Data Center
High-resolution image
August 2009 compared to past years
Arctic sea ice extent for August 2009 was the third lowest August since 1978, continuing the downward trend observed over the last three decades. Only 2007 and 2008 had lower ice extent during August. The long-term trend indicates a decline of 8.7% per decade in August ice extent since 1979.
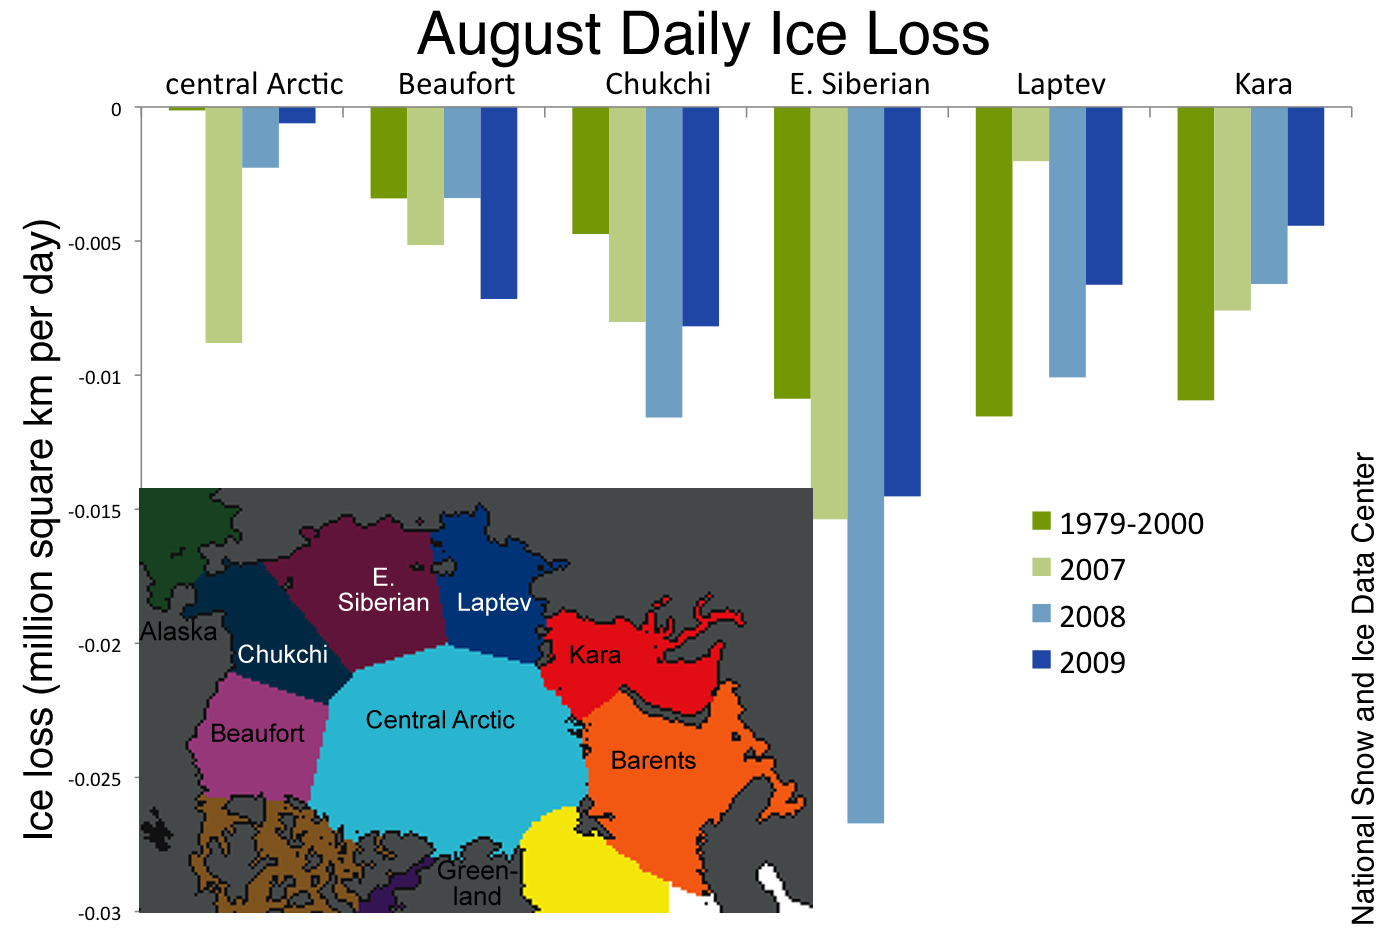
Figure 4. Regional ice loss rates in August of this year were similar to August 2007, but slower than August 2008. Year-to-year variations in the ice loss rates show the impact of wind and temperature patterns on regional ice loss.—Credit: National Snow and Ice Data Center
High-resolution image
High ice loss in the Beaufort Sea and Siberian Arctic
This August, the Beaufort Sea lost more ice than in either 2007 or 2008. In other regions of the Arctic, ice loss rates were about the same as in August 2007, except in the central Arctic, where more ice was lost in 2007. These year-to-year differences in regional ice loss rates reflect variations in surface wind and temperature patterns that affect the ice motion and melt.
Overall, ice loss rates this year were slower than than in August 2008, when ice declined at record rates. But because the July 2008 rate of decline was slower, the minimum ice extent in September 2008 did not reach the 2007 record low.
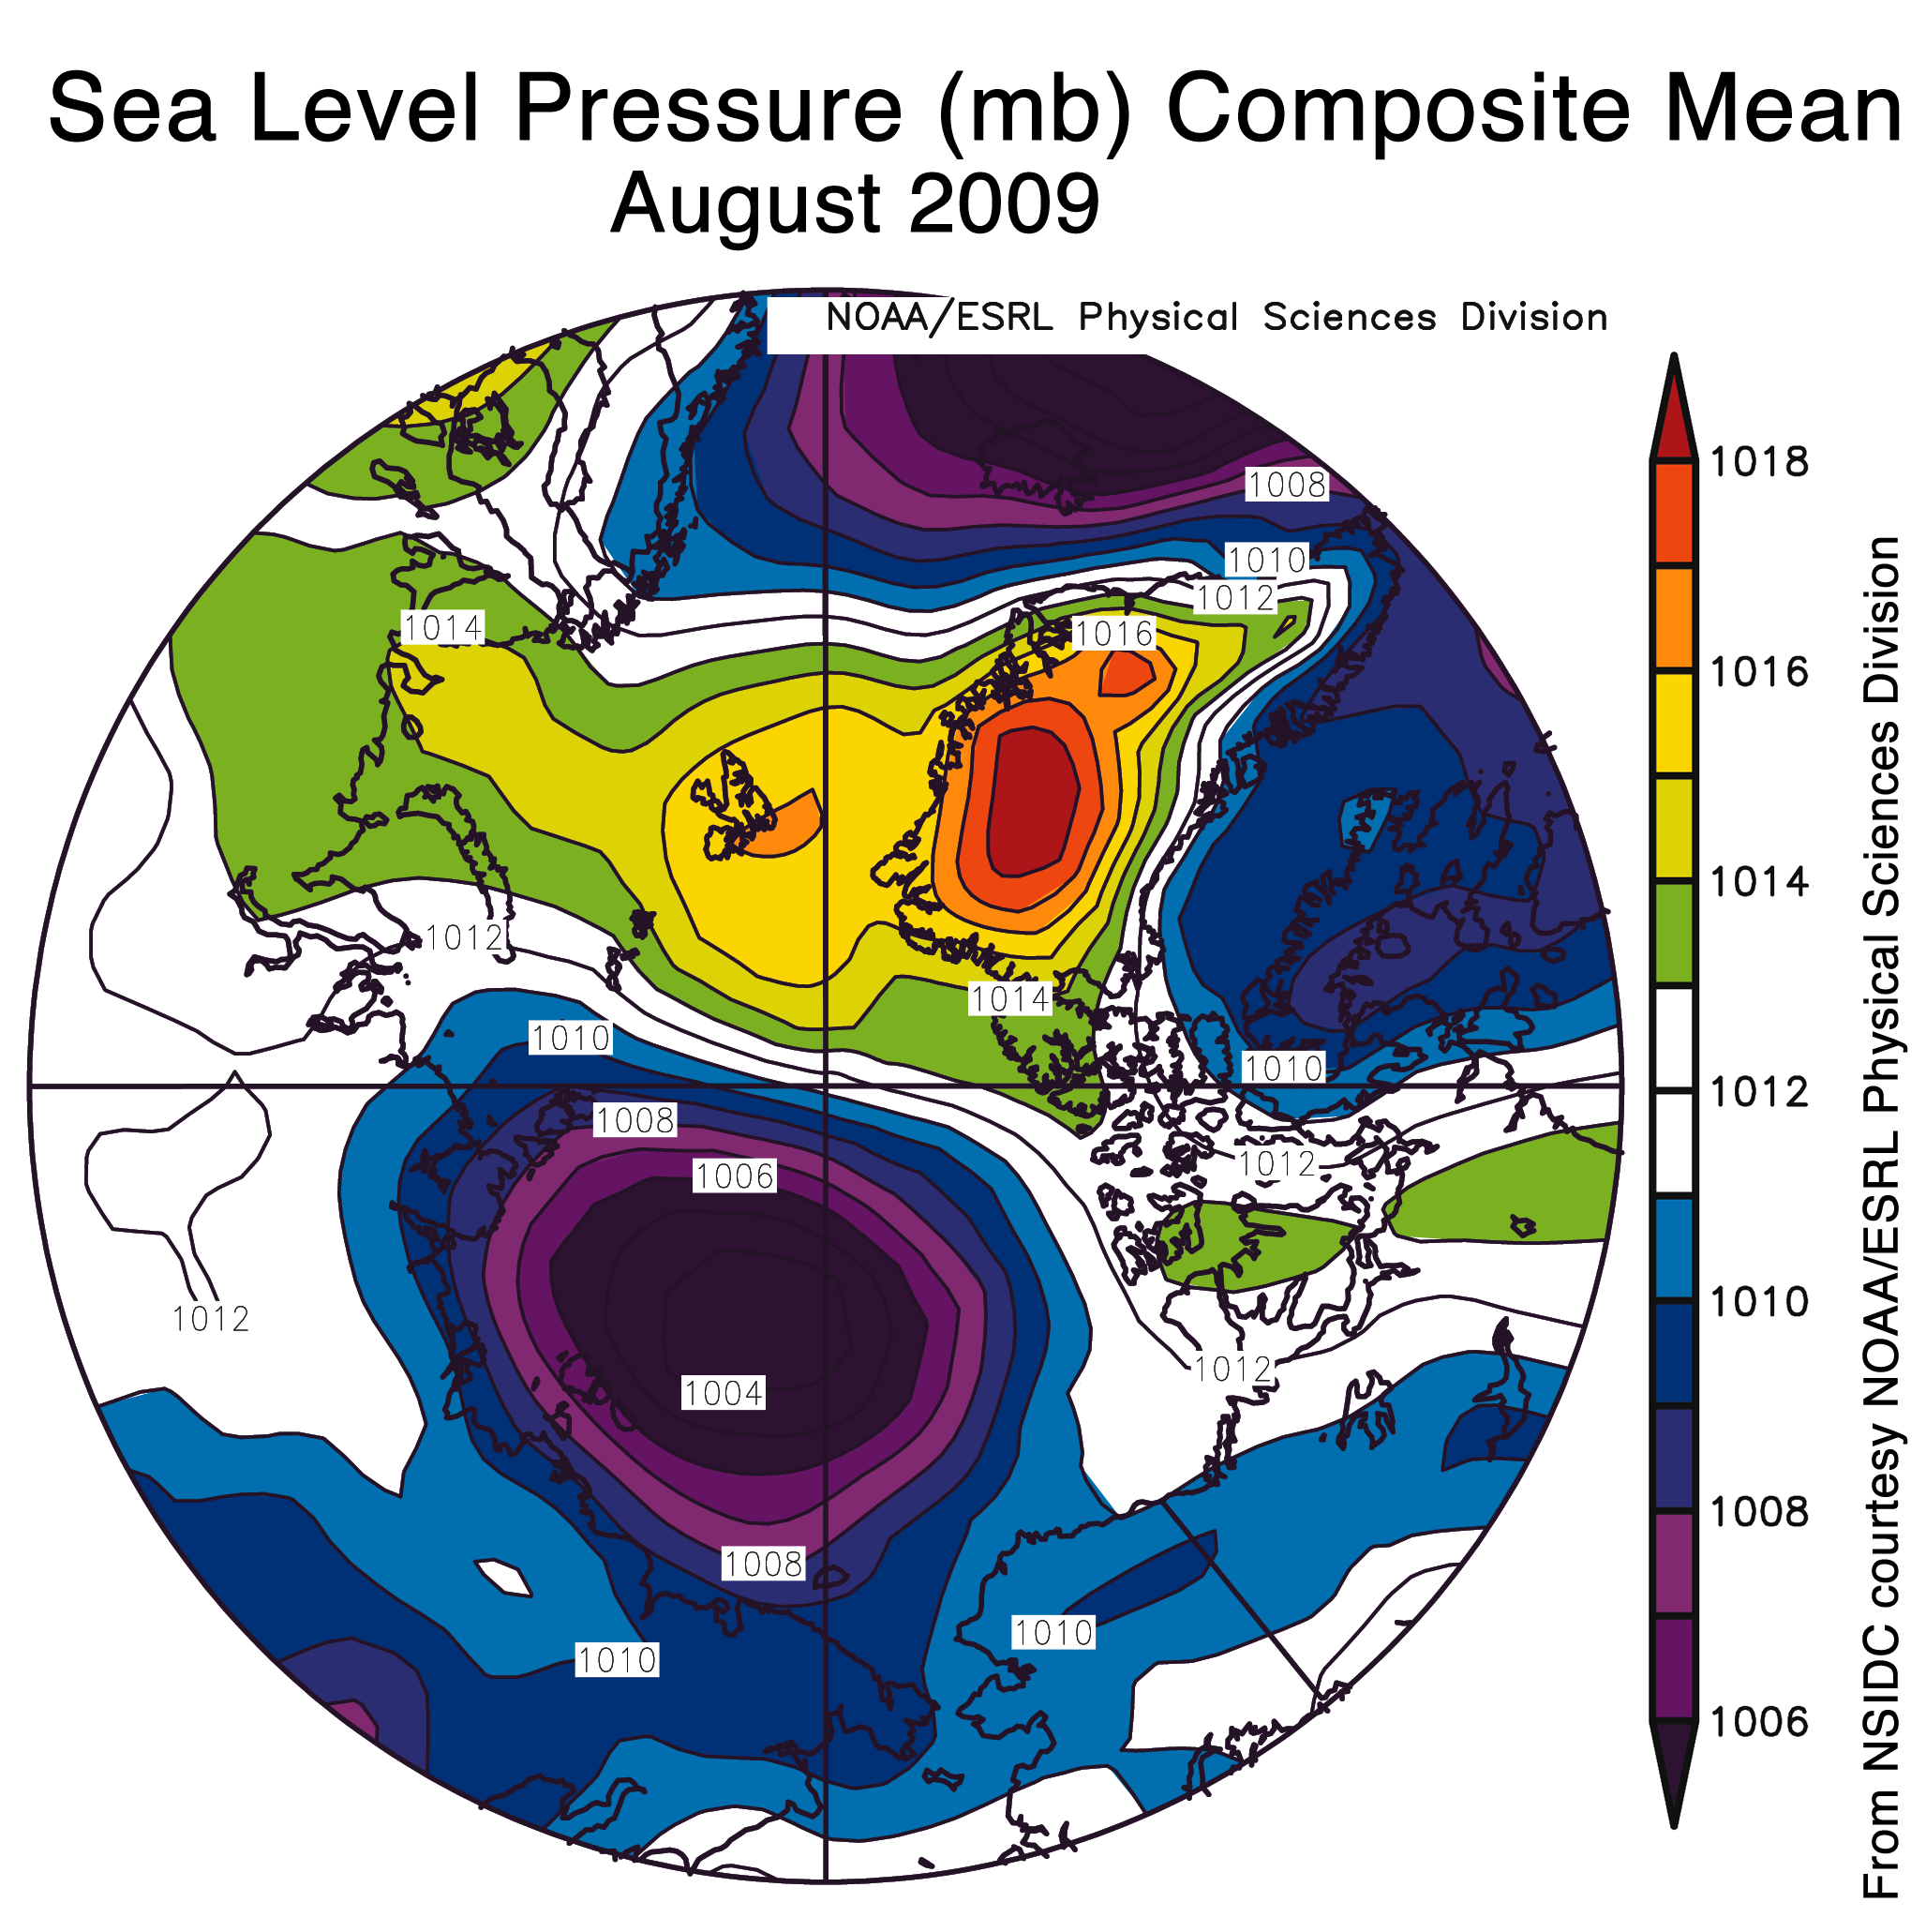
Figure 5. The map of sea level pressure (in millibars) for August 2009 shows a low pressure system over the Beaufort and Chuckchi seas, and high pressure over Greenland, which led to faster ice loss in the Beaufort Sea and a slower decline in the Kara and Laptev seas and the central Arctic.—Credits: From National Snow and Ice Data Center courtesy NOAA/ESRL Physical Sciences Division
High-resolution image
Winds spread ice, enhance melt
The pattern of high pressure over the Beaufort Sea that had characterized much of the summer broke down in early August. The August atmospheric pattern was dominated by low pressure over the Beaufort and Chukchi seas, and high pressure over Greenland and the Atlantic side of the Arctic. This pattern led to winds blowing from the south and southwest into the Beaufort Sea, contributing to melt and poleward ice motion in this area. By contrast, winds from the north favored a drift of ice towards the Siberian coast.
Studies by Mark Serreze, Masayo Ogi, and other researchers have shown that low-pressure patterns promote spreading of the ice pack, a process known as divergence. While ice divergence increases extent, it can also accelerate melt because there are more dark, open-water areas between the floes to absorb the sun’s energy, promoting melt on all sides of the floes.
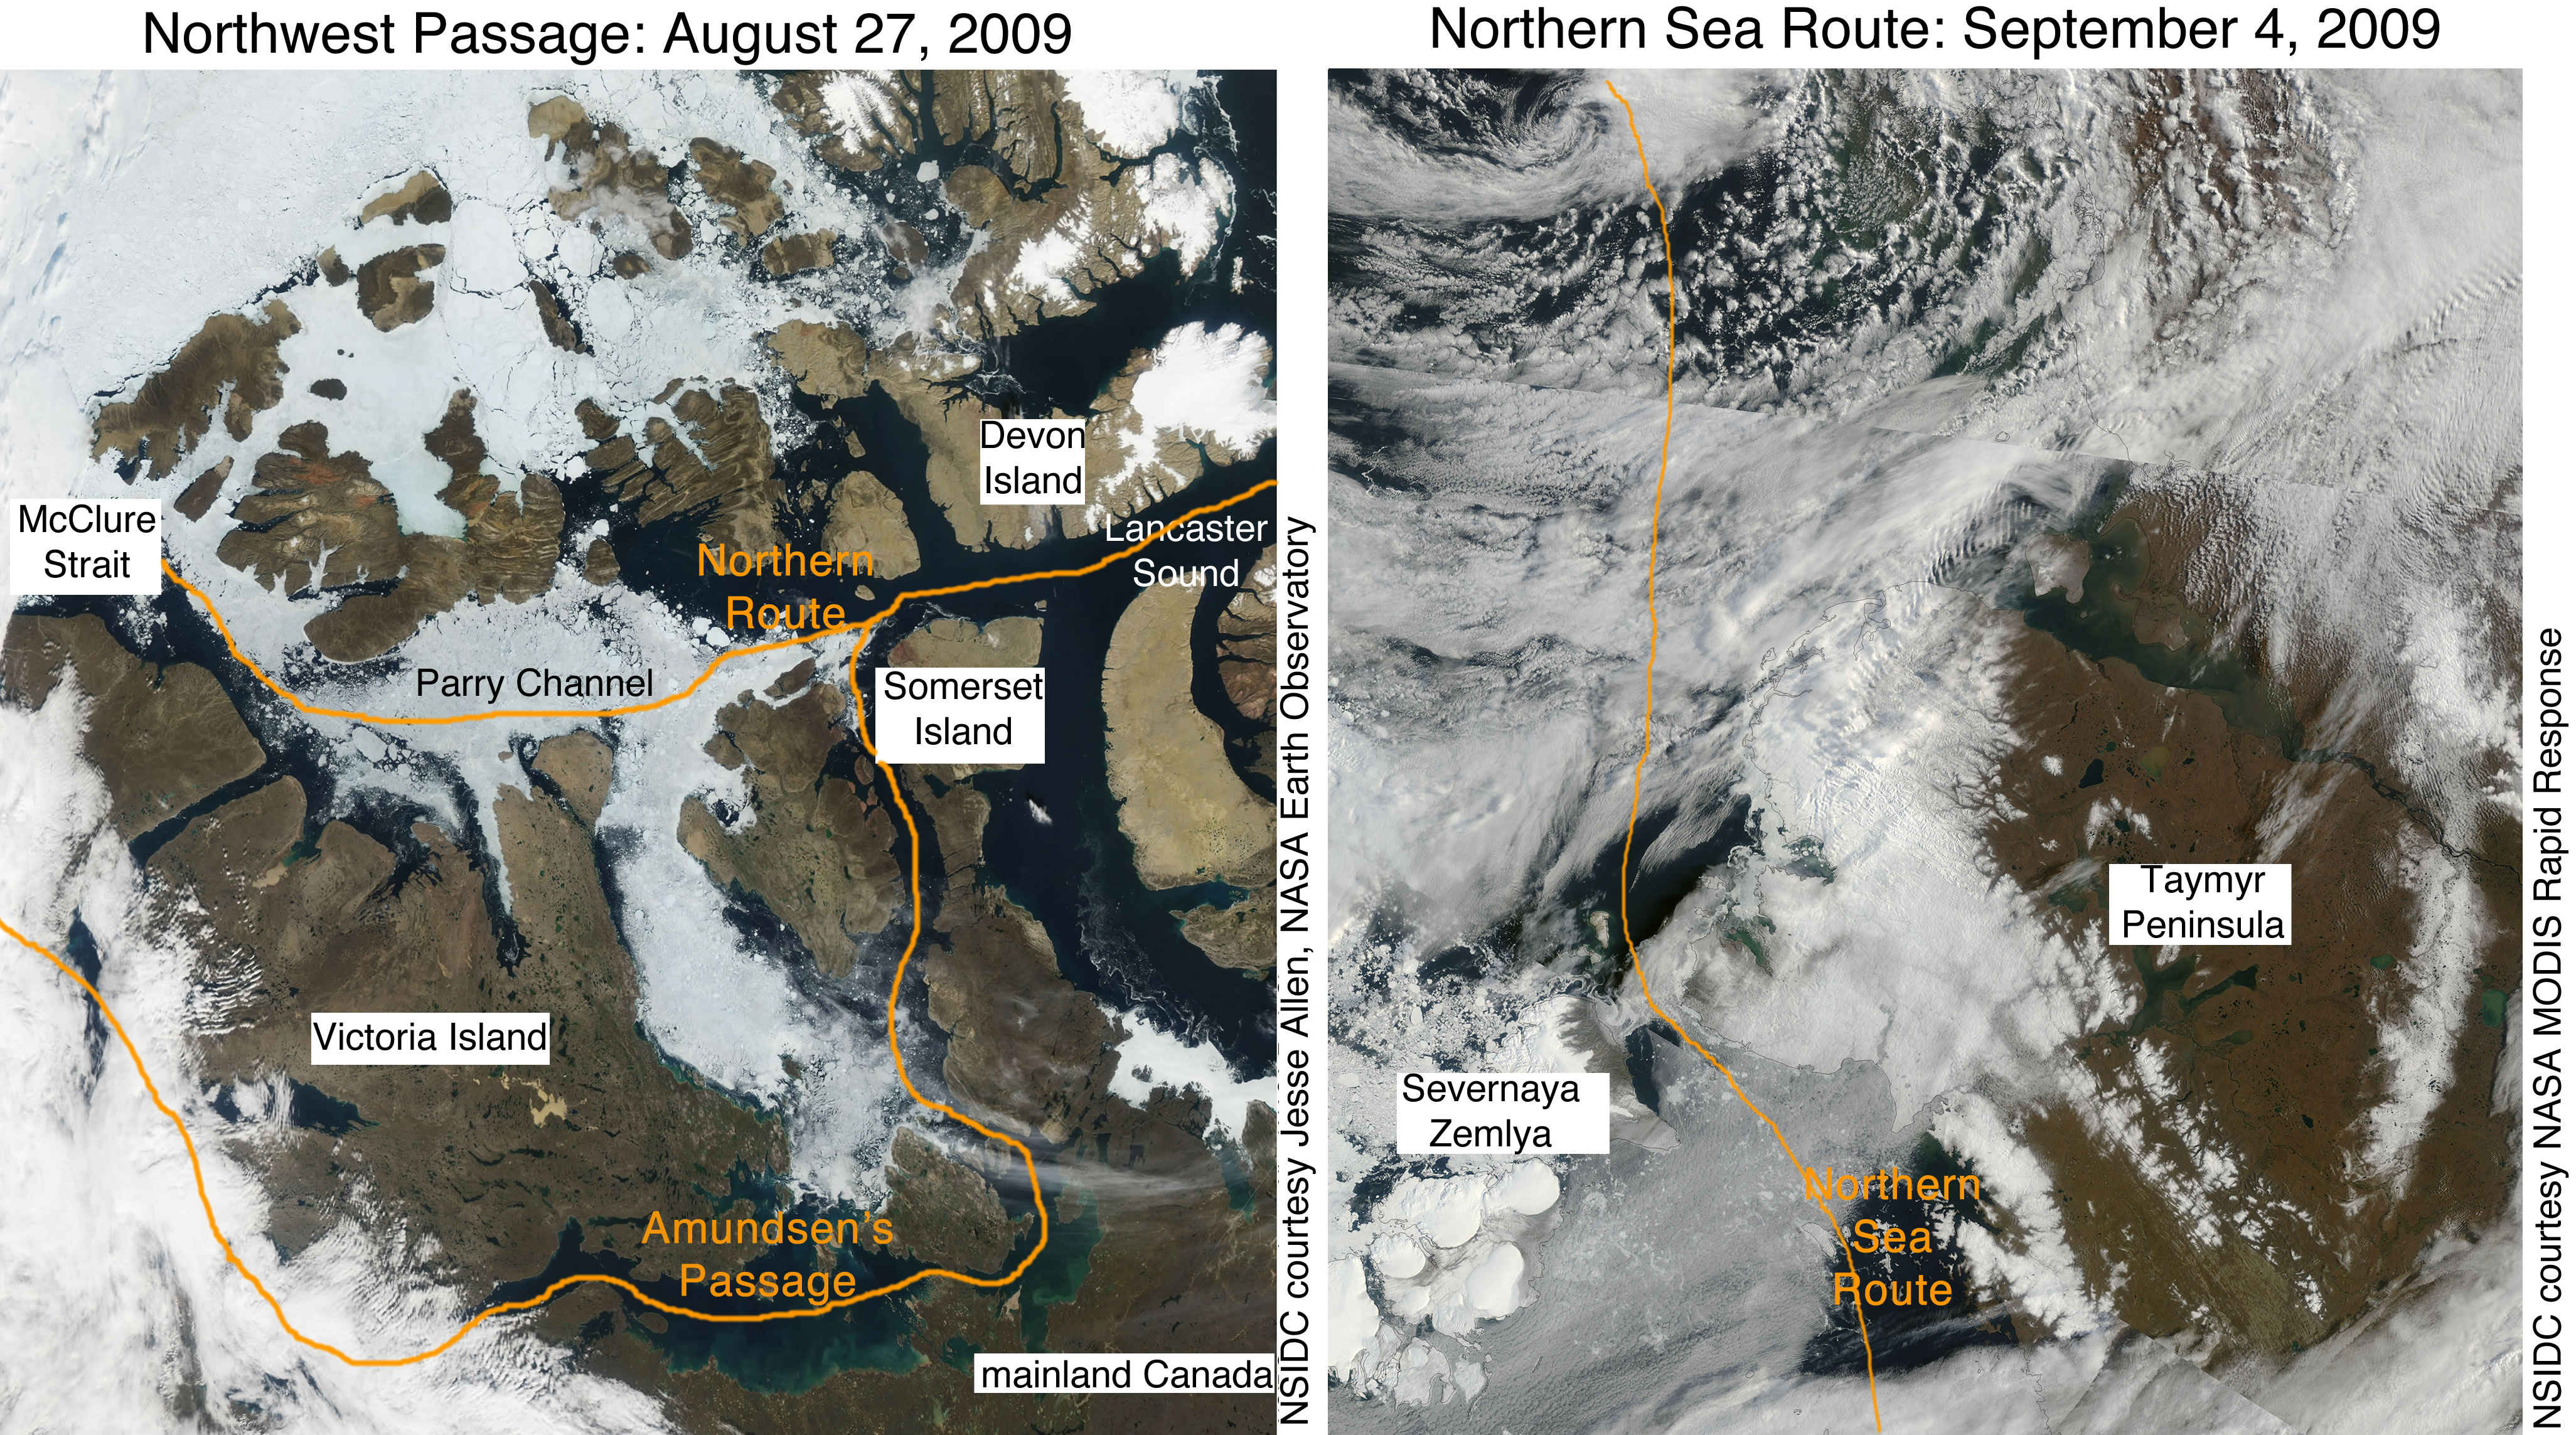
Figure 6. Images from the Moderate Resolution Imaging Spectroradiometer (MODIS) image, acquired by the NASA Terra satellite on August 27 and September 4, show recent ice conditions in the Northwest Passage and Northern Sea Route. Open water and patches of ice are visible through the thin cloud cover.—Credit: From National Snow and Ice Data Center courtesy. Jesse Allen, NASA Earth Observatory (left), and NASA MODIS Rapid Response (right)
High-resolution image
Sea routes in the Arctic
The Northwest Passage is not a single passage, but rather a number of possible routes through the channels of the Canadian Arctic Archipelago. Satellite images show that the shallow and narrow southern route, which Amundsen navigated in 1905, appeared to open briefly this August. This route was also open in 2007 and 2008. The deeper northern route, of great interest for potential commercial transport, was open in 2007 but is still blocked by ice this year.
On the other side of the Arctic, the Northern Sea Route is open along most of the route, except for a narrow band of ice between the islands of Severnaya Zemlya and the Siberian mainland. Ice tends to persist in this area because of winds that push ice into the constrained region. Even during the record low extent year of 2007, the area around Severnaya Zemlya remained clogged with ice.
Evidence based on satellite data should not be taken as proof of safe conditions for shipping—hazardous areas of ice may remain.
Further reading
Three papers published in the past month have added important insight to our understanding of Arctic warming and sea ice decline. Elizabeth Hunke and Cecilia Bitz show that improved models can now reproduce the changes in sea ice extent and sea ice age that have occurred in the last 30 years. Ron Kwok and Drew Rothrock combine satellite data and submarine measurements to show an astonishing decline in sea ice thickness over the last 50 years. And Darrell Kaufman and colleagues show that recent warming has reversed a 2,000-year cooling trend in the Arctic, and that this cooling was what would be expected from slow changes in Earth’s orbit. The recent changes cannot be explained by these natural factors.
Hunke, E. C., and C. M. Bitz. 2009. Age characteristics in a multidecadal Arctic sea ice simulation. J. Geophys. Res., Vol. 114, No. C8, C08013 doi:10.1029/2008JC005186 22,
Kwok, R., and D. A. Rothrock. 2009. Decline in Arctic sea ice thickness from submarine and ICESat records: 1958-2008. Geophys. Res. Lett., Vol. 36, No. 15, L15501 doi:10.1029/2009GL039035.
Kaufman, D. S., D. P. Schneider, N. P. McKay, et al. 2009. Recent warming reverses long-term Arctic cooling. Science, p. 1236-1239. doi:10.1126/science.1173983.
References
Ogi, M., and J. Wallace. 2007. Summer minimum Arctic sea ice extent and the associated summer atmospheric circulation. Geophys. Res. Lett., 34, L12705, doi:10.1029/2007GL029897.
Serreze, M. C., R. G. Barry, and A. S. McLaren. 1989. Seasonal variations in sea ice motion and effects on sea ice concentration in the Canada Basin. Journal of Geophysical Research, 94(C8), 10955-10970. doi:10.1007/BF01030491.
For previous analyses, please see the drop-down menu under Archives in the right navigation at the top of this page.

