Near-real-time data now available

Near-real-time sea ice data updates are again available from Arctic Sea Ice News & Analysis. We have switched to the Special Sensor Microwave/Imager (SSM/I) sensor on the Defense Meteorological Satellite Program (DMSP) F13 satellite following the sensor drift problem described in our February 18 post.

The temporary error in the near-real-time data does not change the conclusion that Arctic sea ice extent has been declining for the past three decades. This conclusion is based on peer reviewed analysis of quality-controlled data products, not near-real-time data.

time series graph showing F13 and F15 sea ice extent 
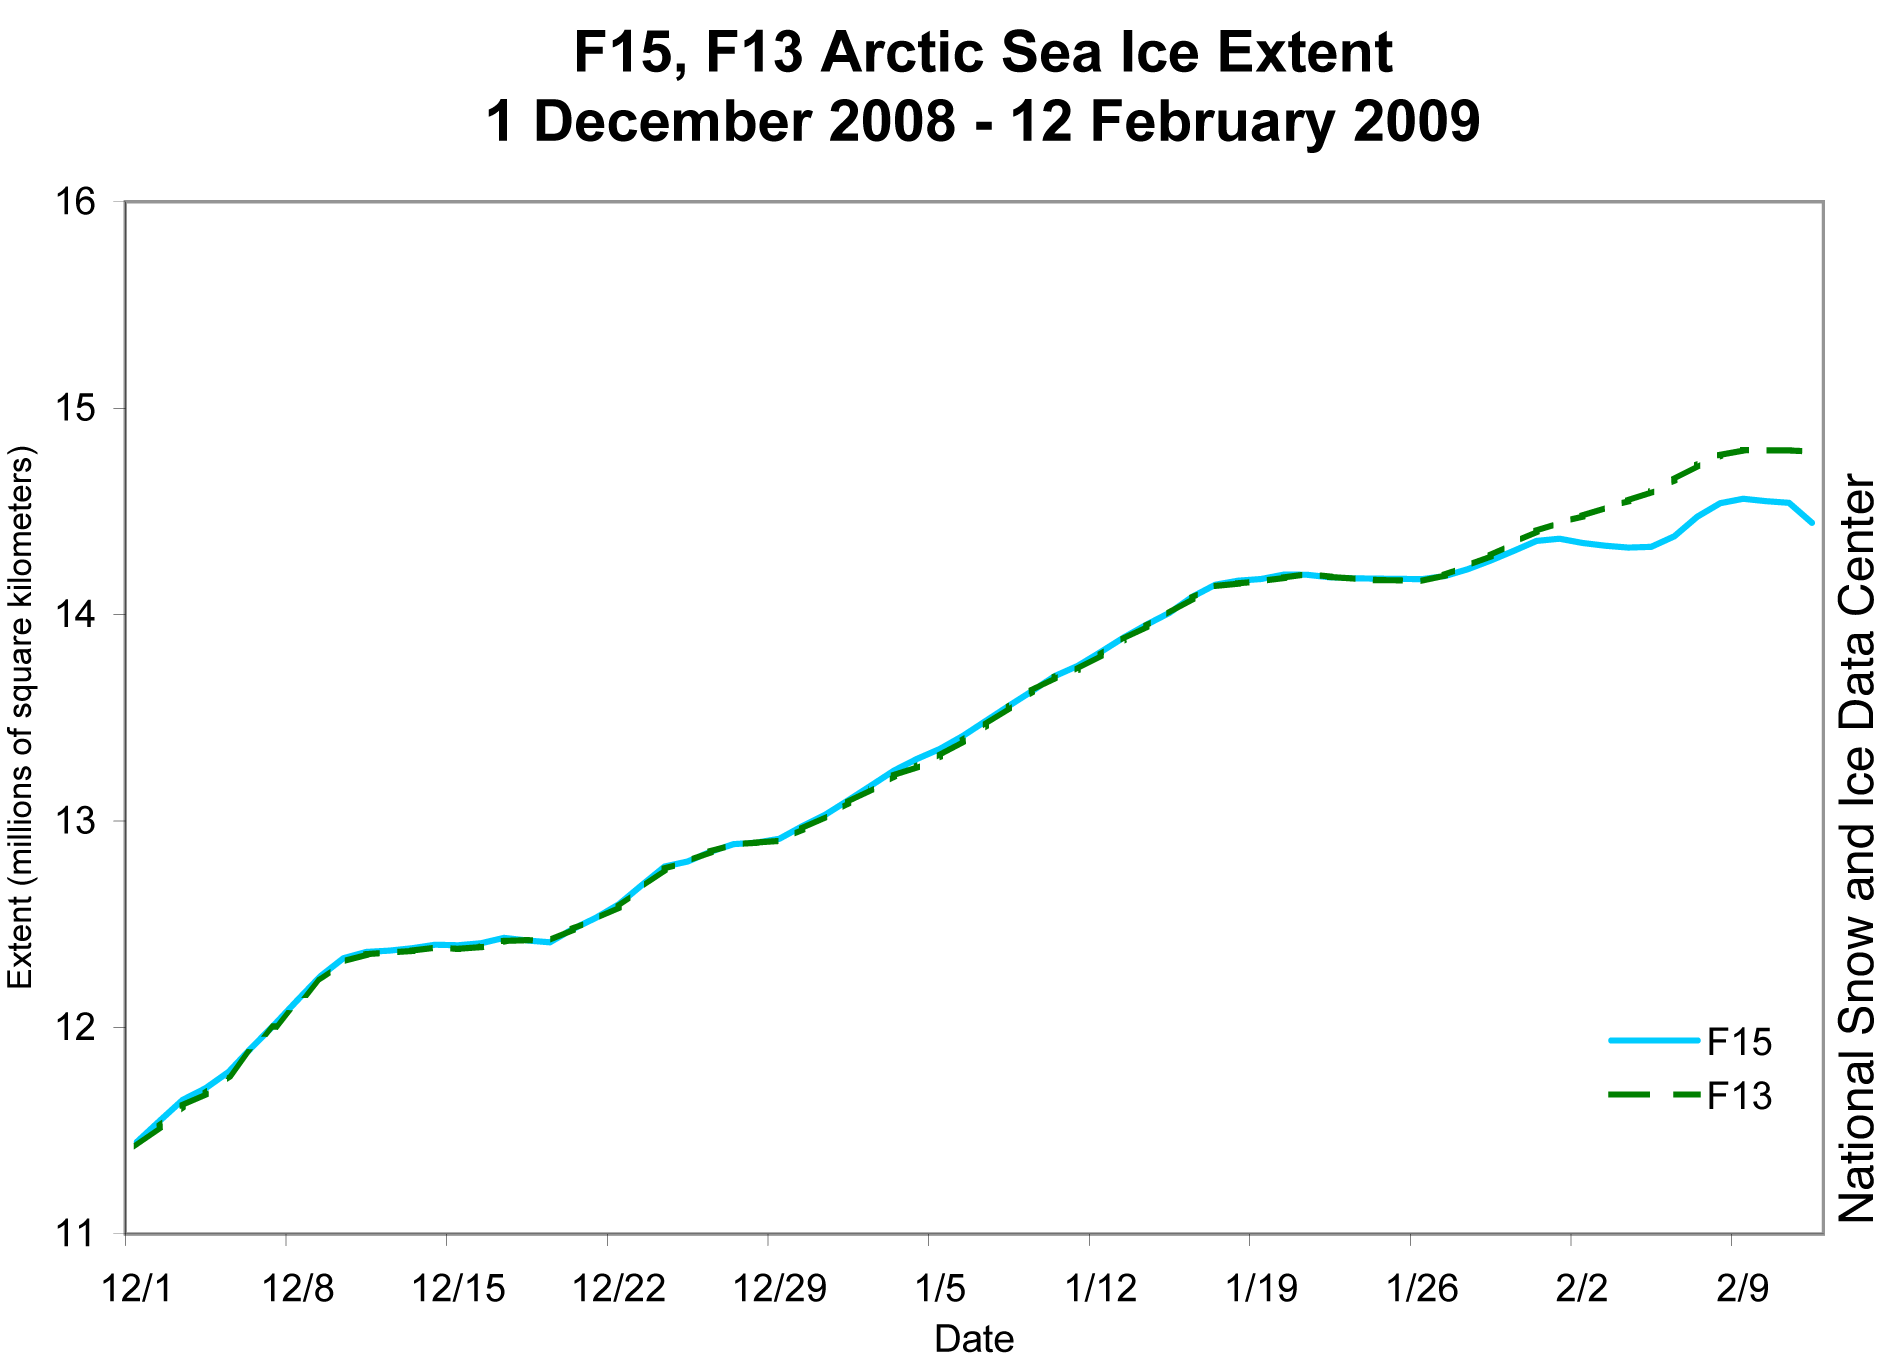
Figure 1. SSM/I Arctic sea ice extent data from F13 (dashed green line) and F15 (solid blue line) were consistent until late January, when the F15 SSM/I sensor began to degrade.
—Credit: National Snow and Ice Data Center
High-resolution image

Impact of the F15 sensor drift

On February 18, we reported that the F15 sensor malfunction started out having a negligible impact on computed ice extent, which gradually increased as the sensor degraded further. At the end of January, the F15 sensor underestimated ice extent by 50,000 square kilometers (19,300 square miles) compared to F13. That is still within the margin of error for daily data. By mid-February, the difference had grown to 500,000 square kilometers (193,000 square miles), which is outside of expected error. However, that amount represents less than 4% of Arctic sea ice extent at this time of year. When the computed daily extent dropped sharply on February 16, the sensor failure became obvious.

NSIDC stopped displaying the problematic data, and recalculated sea ice extent using data from the DMSP F13 satellite, an older sensor in the same series of satellites. The recalculation changed the January monthly average ice extent by less than the margin of error for the sensor. As we reported in our February 3 post, growth of Arctic sea ice did indeed slow in January because of unusual atmospheric conditions. Using F13 data instead of F15, the September daily minimum that we reported on September 16, 2008, changed from 4.52 million square kilometers (1.74 million square miles) to 4.54 million square kilometers (1.75 million square miles), within the margin of error for daily data.

The F15 sensor drift does not change any of our conclusions regarding the long-term decline in Arctic sea ice extent. Such scientific conclusions, published in peer-reviewed journals, are based on quality-controlled monthly to annually averaged data. We have quality-controlled the final data through 2007; a thorough audit of the more recent data from 2008 shows that any discrepancies fall within the margin of error.

artist's rendering of a DMSP satellite Figure 2. NSIDC acquires sea ice data from a series of Defense Meteorological Satellite Program (DMSP) satellites. Overlap between satellite sensors allows us to build a consistent long-term data record.
—Credit: Image courtesy Air Force Space Command Defense Meteorological Satellite Program
High-resolution image

Building long time series from satellite data

Like cars, airplanes, and other machines, satellites do not last forever. Scientists monitor satellites for problems, and new satellites must be launched to replace them. One advantage of the DMSP series of satellites is the continual overlap between one satellite and the next. This overlap allows scientists to compare and calibrate data from each satellite to ensure consistency over time. By using a series of intercalibrated sensors, we can build a consistent long-term record of sea ice extent.

Before acquiring data from F15, NSIDC obtained sea ice data from the SSM/I sensors on the DMSP F8, F11, and F13 satellites. In March 2008, we switched from the F13 satellite to the F15 satellite because the F13 SSM/I sensor had started to have regular areas of missing data. The missing data were caused by malfunctioning data recorders on the satellite, not because of any problem with the sensor itself. At the time, we were concerned that the recorder problem would become more serious. However, the F13 data recorders have not degraded further.

In comparison, the F15 sensor drift makes those data unreliable for our purposes, so we have switched back to F13. As a long-term solution, we are working on a transition to the newest sensor, which is on the F17 satellite.

map of sea ice from space, animated to show missing data and corrected image
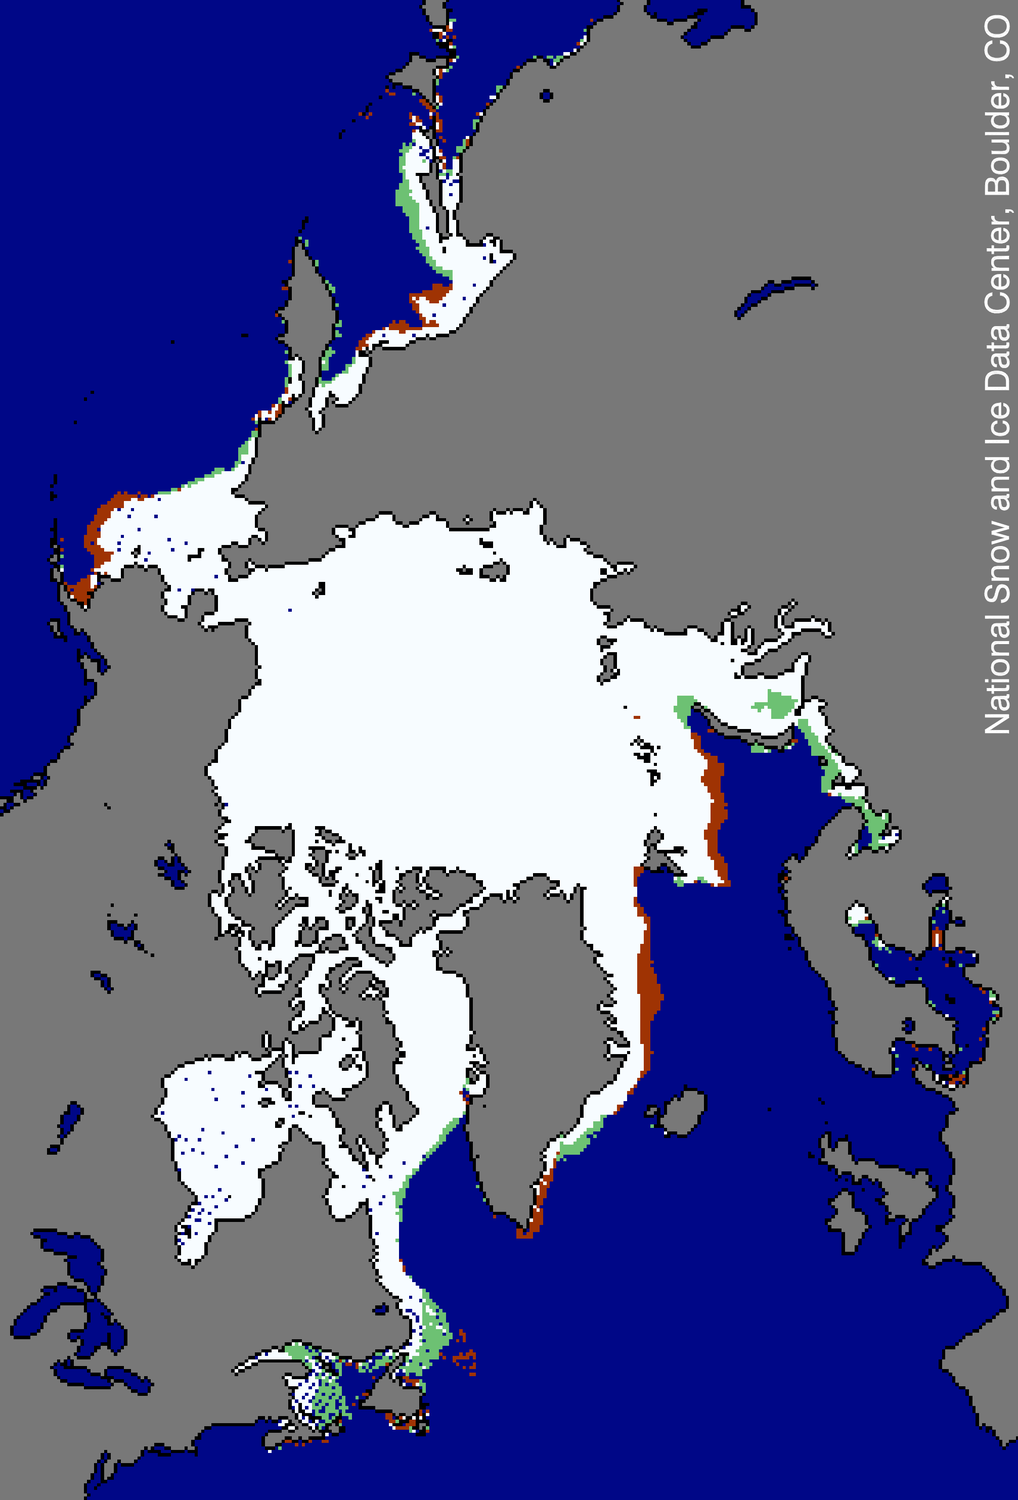
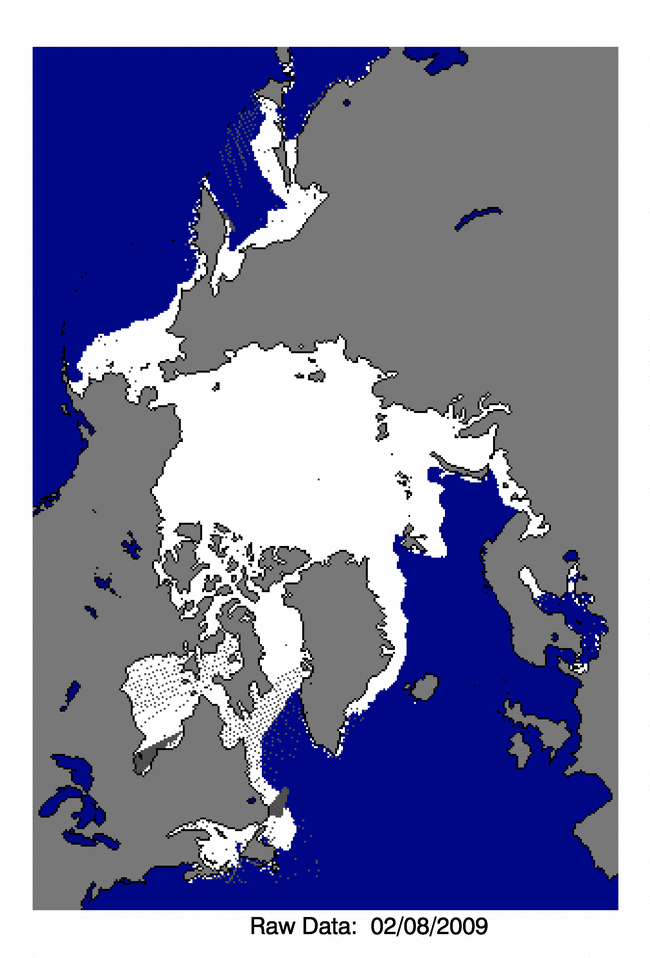
Figure 3. This animated map shows how NSIDC scientists now correct for missing data in the daily time series. The daily sea ice extent map labeled “raw data” shows areas of missing data as gray wedges and speckles. The map labeled “interpolated” shows the daily image used to calculate the daily time series.
Sea Ice Index data. About the data.

—Credit: National Snow and Ice Data Center
High-resolution image


Correcting the daily time series

The daily extent map now shows any areas of missing data as dark gray regions, speckles, or spider web patterns. However, in the time series chart we account for the missing data by averaging the extent for that region from the day before and the day after the gap, a mathematical technique called interpolation. Interpolation is an appropriate approach because ice cover changes slowly. The animation in Figure 3 shows an Arctic sea ice extent map with regions of missing data (Raw Data: 02/08/09), and the same map, showing the filled-in data (Interpolated: 02/08/09).

Isolated areas of missing data occasionally occur in near-real-time sea ice data. We adjust for such gaps during the quality control for the final data products, which are usually released about a year after the near-real-time data. The final data products form the basis for peer-reviewed scientific analysis; this is typical for all fields that use satellite data, not just sea ice science. For more information about quality control for NSIDC sea ice data, see Do your data undergo quality control? on the Frequently Asked Questions about Arctic sea ice Web page.


Graph with months on x axis and extent on y axis
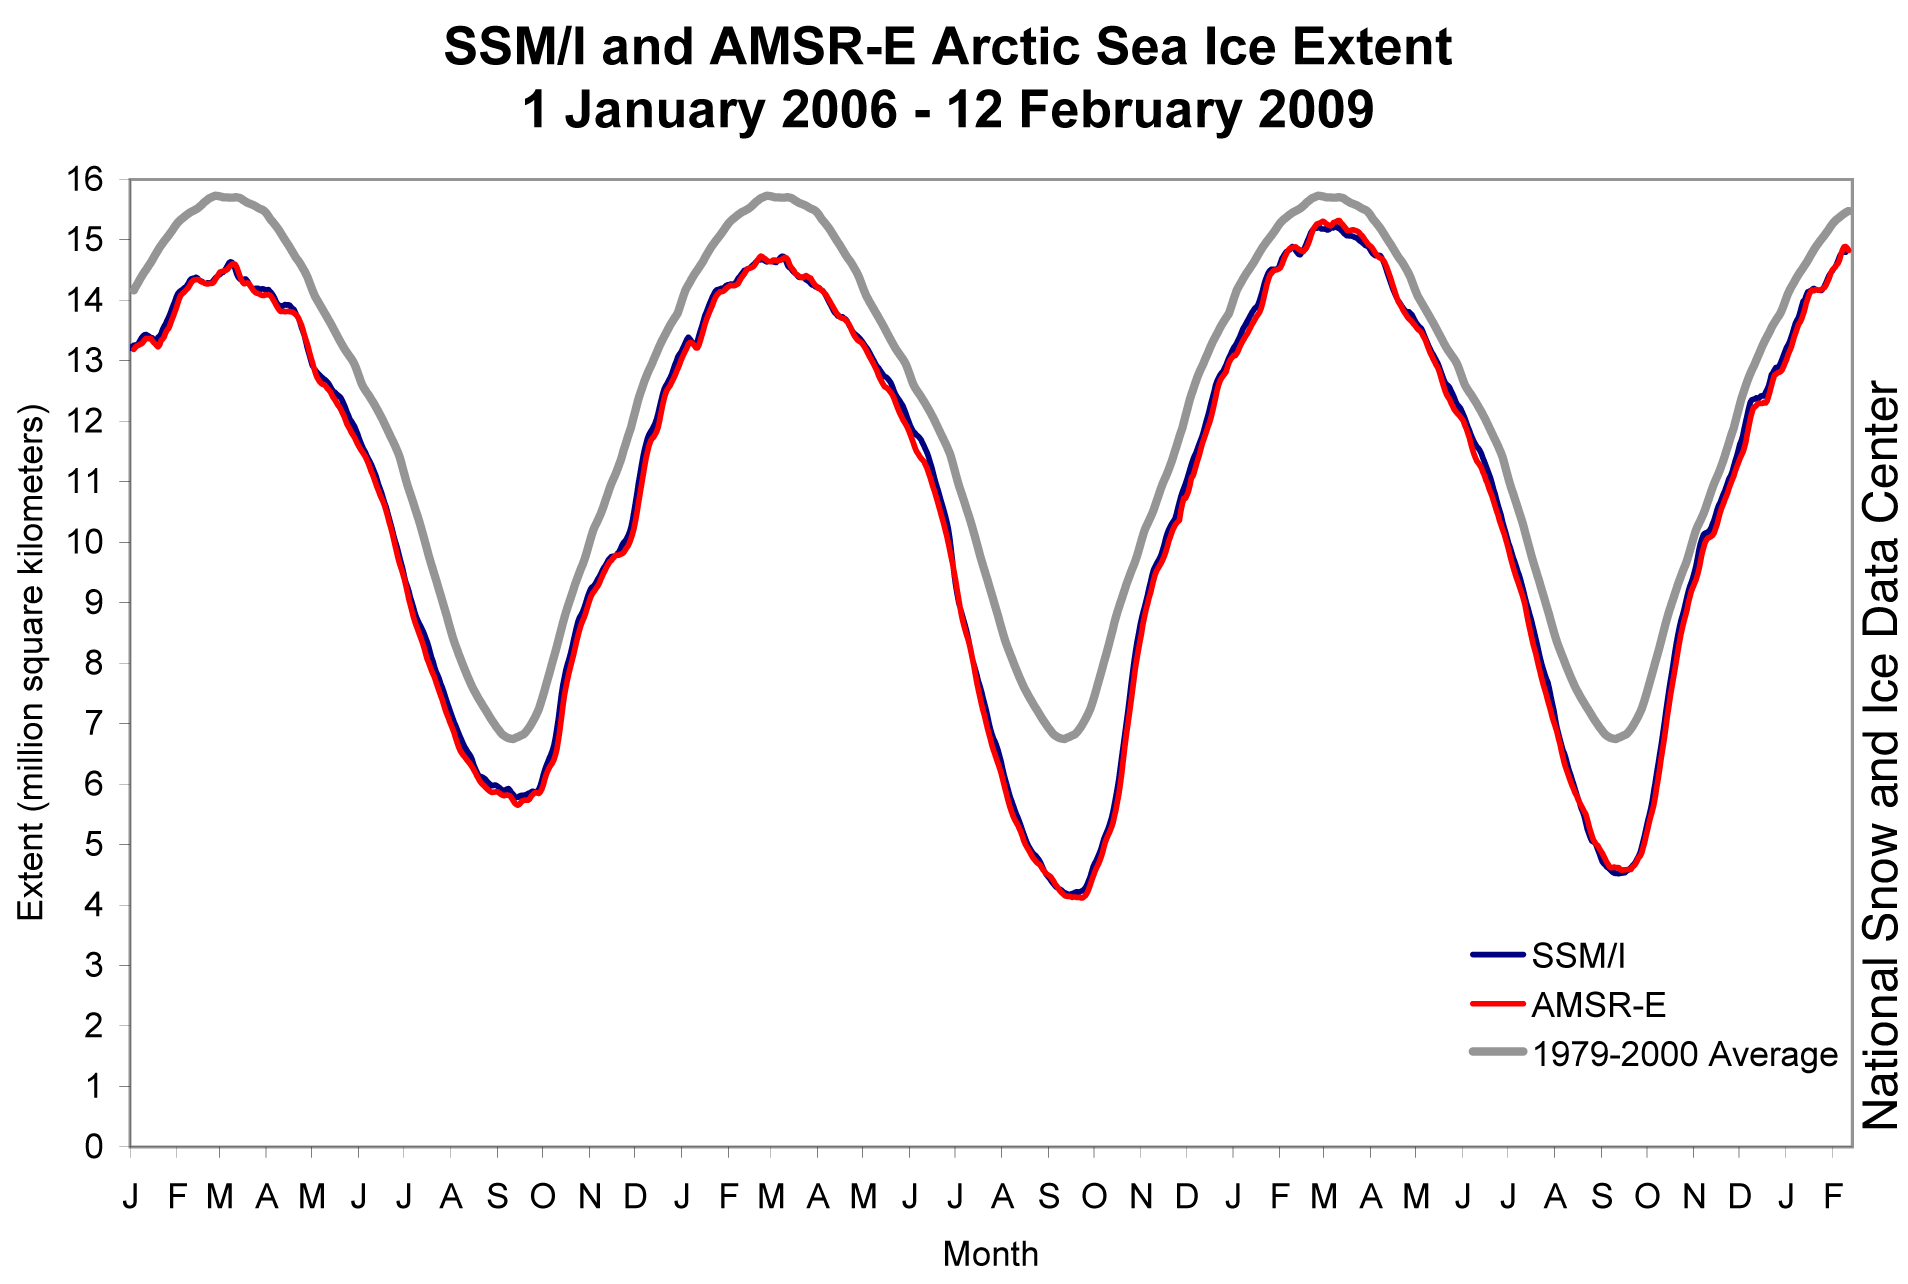
Figure 4. This time series of F13 SSM/I (blue line) versus AMSR-E (red line) Arctic sea ice extent from 2006 to February, 2009 shows how SSM/I and AMSR-E data match up over the last three years. The gray line shows the 1979-2000 average.
—Credit: National Snow and Ice Data Center
High-resolution image


Cross-checking data

A number of other satellites can detect sea ice, and provide an independent check for consistency of the SSM/I data. The NASA Advanced Microwave Scanning Radiometer-Earth Observing System (AMSR-E) sensor generally serves as a good comparison for SSM/I data from the DMSP F-series satellites. Recent comparison shows that ice extent from F-13 tracks close to that from AMSR-E. AMSR-E and several other types of satellite and ground-based measurements have confirmed the long-term decline in Arctic sea ice extent over the past thirty years.


Graph with months on x axis and extent on y axis
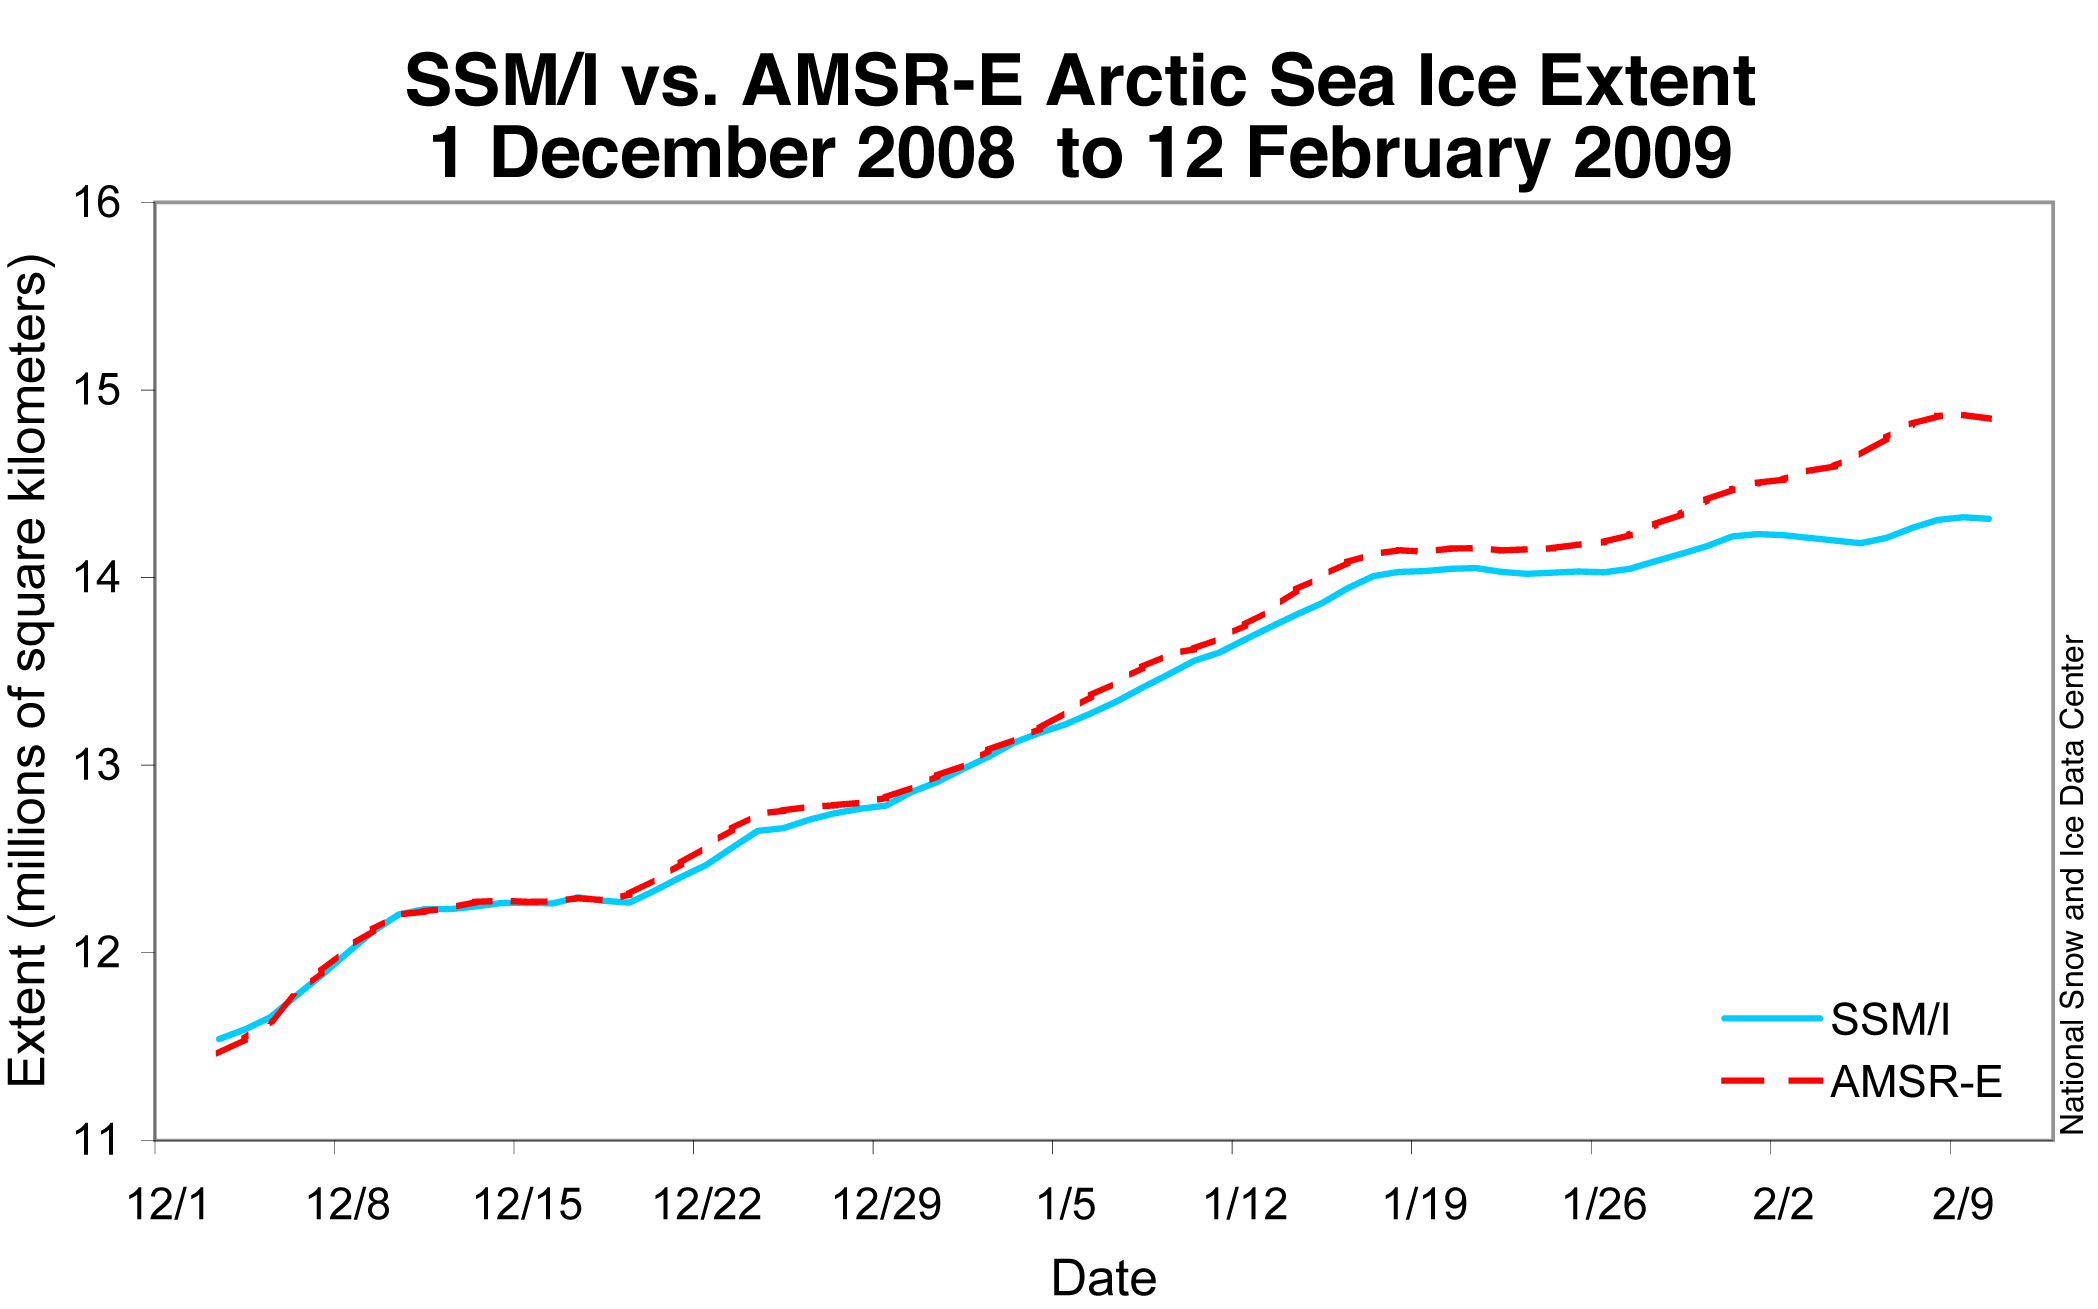
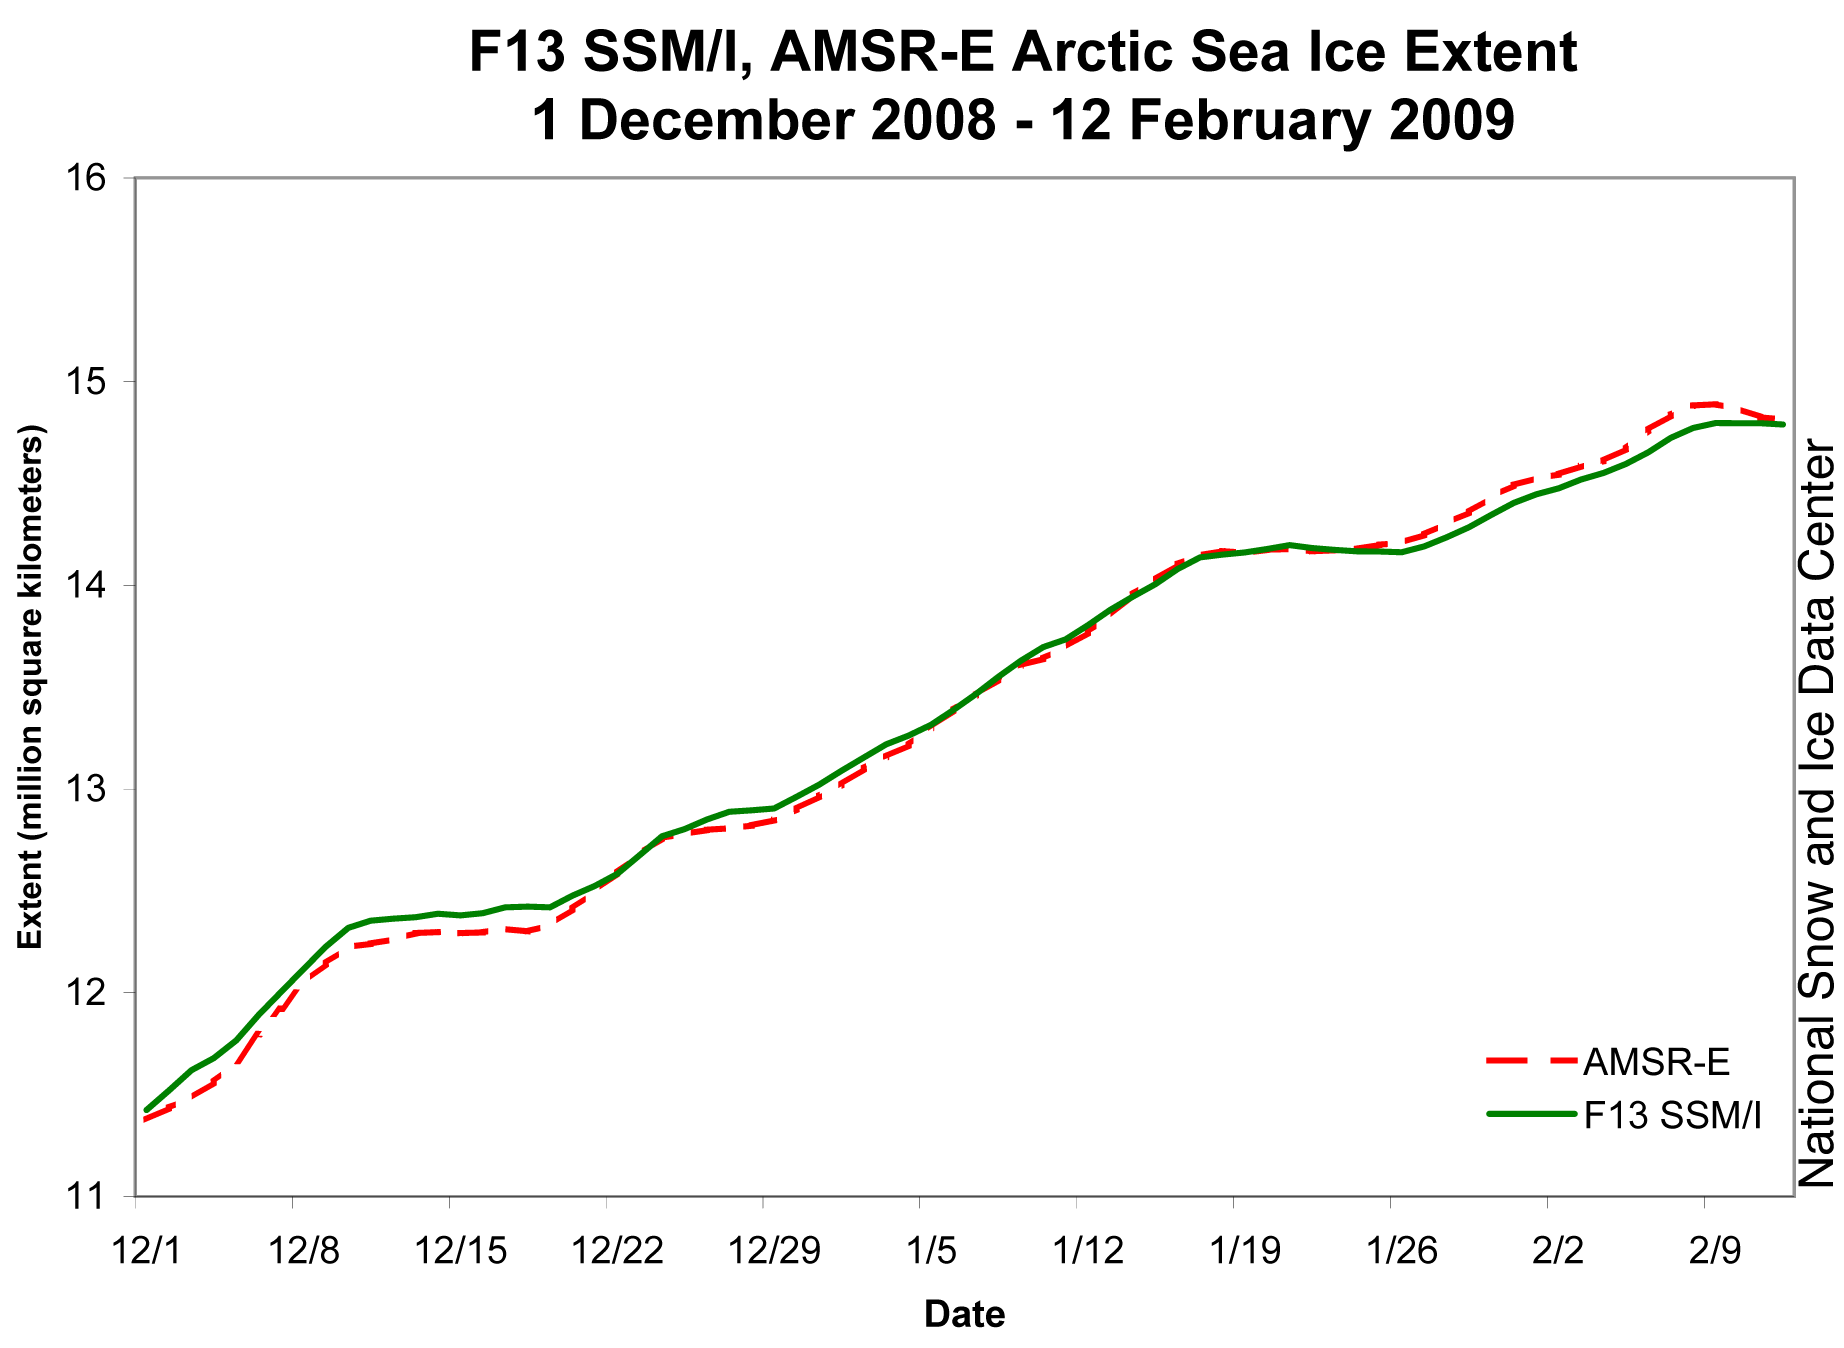
Figure 5. This time series shows the difference between F13 SSM/I (solid green line) and AMSR-E (dashed pink line) Arctic sea ice extent from December 1, 2008 to February 12, 2009. AMSR-E starts out lower than SSM/I, but ends up higher, with differences of up to 100,000 square kilometers (38,600 square miles).
Credit: National Snow and Ice Data Center
High-resolution image

SSM/I vs. AMSR-E

While the AMSR-E satellite can provide a good check on SSM/I data, scientists prefer not to use it to extend the long-term sea ice record. Although AMSR-E has a lower absolute error, continuing to use SSM/I provides a lower relative error, which is more important for tracking long-term changes in conditions.

Figure 5 illustrates the difference between AMSR-E and SSM/I sea ice extent. AMSR-E starts out lower than SSM/I, but ends up higher, with differences of up to 100,000 square kilometers (38,600 square miles). Experts expect this to be the case because of differences in the way the sensors detect sea ice. Thus, by comparing sea ice extent data from the same satellite sensor, we can build a more reliable picture of how extent has changed over the last three decades.

For previous analysis, please see the drop-down menu under Archives in the right navigation at the top of this page.

Satellite sensor errors cause data outage

As some of our readers have already noticed, there was a significant problem with the daily sea ice data images on February 16. The problem arose from a malfunction of the satellite sensor we use for our daily sea ice products. Upon further investigation, we discovered that starting around early January, an error known as sensor drift caused a slowly growing underestimation of Arctic sea ice extent. The underestimation reached approximately 500,000 square kilometers (193,000 square miles) by mid-February. Sensor drift, although infrequent, does occasionally occur and it is one of the things that we account for during quality control measures prior to archiving the data. See below for more details.

We have removed the most recent data and are investigating alternative data sources that will provide correct results. It is not clear when we will have data back online, but we are working to resolve the issue as quickly as possible.

Map of sea ice from space, showing sea ice, continents, ocean
Figure 1. Daily Arctic sea ice extent map for February 15, 2009, showed areas of open water which should have appeared as sea ice. Sea Ice Index data. About the data.

—Credit: National Snow and Ice Data Center
High-resolution image

Where does NSIDC get its data?

NSIDC gets sea ice information by applying algorithms to data from a series of Special Sensor Microwave/Imager (SSM/I) sensors on Defense Meteorological Satellite Program (DMSP) satellites. These satellites are operated by the U.S. Department of Defense. Their primary mission is support of U.S. military operations; the data weren’t originally intended for general science use.

The daily updates in Arctic Sea Ice News & Analysis rely on rapid acquisition and processing of the SSM/I data. Because the acquisition and processing are done in near-real time, we publish the daily data essentially as is. The data are then archived and later subjected to very strict quality control. We perform quality control measures in coordination with scientists at the NASA Goddard Space Flight Center, which can take up to a year. High-quality archives from SSM/I, combined with data from the earlier Scanning Multi-channel Microwave Radiometer (SMMR) data stream (1979–1987) provide a consistent record of sea ice conditions now spanning 30 years.

Graph with months on x axis and extent on y axisFigure 2. Daily total Arctic sea ice extent between 1 December 2008 and 12 February 2009 for Special Sensor Microwave/Imager SSM/I compared to the similar NASA Earth Observing System Advanced Microwave Scanning Radiometer (EOS AMSR-E) sensor.
—Credit: National Snow and Ice Data Center
High-resolution image

Data error sources

As discussed above, near-real-time products do not undergo the same level of quality control as the final archived products, which are used in scientific research published in peer-reviewed journals. However, the SSM/I sensors have proven themselves to be generally quite stable. Thus, it is reasonable to use the near-real-time products for displaying evolving ice conditions, with the caveat that errors may nevertheless occur. Sometimes errors are dramatic and obvious. Other errors, such as the recent sensor drift, may be subtler and not immediately apparent.  We caution users of the near-real-time products that any conclusions from such data must be preliminary. We believe that the potential problems are outweighed by the scientific value of providing timely assessments of current Arctic sea ice conditions, as long as they are presented with appropriate caveats, which we try to do.

For several years, we used the SSM/I sensor on the DMSP F13 satellite. Last year, F13 started showing large amounts of missing data. The sensor was almost 13 years old, and no longer provided complete daily data to allow us to track total daily sea ice extent. As a result, we switched to the DMSP F15 sensor for our near-real-time analysis. For more information on the switch, see  “Note on satellite update and intercalibration,” in our June 3, 2008 post.

On February 16, 2009, as emails came in from puzzled  readers, it became clear that there was a significant problem—sea-ice-covered regions were showing up as open ocean. The problem stemmed from a failure of the sea ice algorithm caused by degradation of one of the DMSP F15 sensor channels. Upon further investigation, we found that data quality had begun to degrade over the month preceding the catastrophic failure. As a result, our processes underestimated total sea ice extent for the affected period. Based on comparisons with sea ice extent derived from the NASA Earth Observing System Advanced Microwave Scanning Radiometer (EOS AMSR-E) sensor, this underestimation grew from a negligible amount in early January to about 500,000 square kilometers (193,000 square miles) by mid-February (Figure 2). While dramatic, the underestimated values were not outside of expected variability until Monday, February 16. Although we believe that data prior to early January are reliable, we will conduct a full quality check in the coming days.

Sensor drift is a perfect but unfortunate example of the problems encountered in near-real-time analysis. We stress, however, that this error in no way changes the scientific conclusions about the long-term decline of Arctic sea ice, which is based on the the consistent, quality-controlled data archive discussed above.

We are actively investigating how to address the problem. Since we are not receiving good DMSP SSM/I data at the present time, we have temporarily discontinued daily updates. We will restart the data stream as soon as possible.

Some people might ask why we don’t simply switch to the EOS AMSR-E sensor. AMSR-E is a newer and more accurate passive microwave sensor. However, we do not use AMSR-E data in our analysis because it is not consistent with our historical data. Thus, while AMSR-E gives us greater accuracy and more confidence on current sea ice conditions, it actually provides less accuracy on the long-term changes over the past thirty years. There is a balance between being as accurate as possible at any given moment and being as consistent as possible through long time periods. Our main scientific focus is on the long-term changes in Arctic sea ice. With that in mind, we have chosen to continue using the SSM/I sensor, which provides the longest record of Arctic sea ice extent.

For more information on the NSIDC sea ice data, see the following resources on the NSIDC Web site:

For previous analysis, please see the drop-down menu under Archives in the right navigation at the top of this page.

Ice extent continues to track below normal

As is typical during mid-winter, sea ice extent increased overall in January; maximum monthly extent is expected in March. However, January ice extent remained well below normal compared to the long-term record. Ice extent averaged for January 2009 is the sixth lowest January in the satellite record. Also of note is that from January 15 to 26, ice extent saw essentially no increase; an unusual wind pattern appears to have been the cause.

Map of sea ice from space, showing sea ice, continents, ocean
Figure 1. Arctic sea ice extent for January 2009 was 14.08 million square kilometers (5.43 million square miles). The magenta line shows the 1979 to 2000 median extent for January. The black cross indicates the geographic North Pole. Sea Ice Index data. About the data.—Credit: National Snow and Ice Data Center
High-resolution image

Overview of conditions

Arctic ice extent averaged for the month of January was 14.08 million square kilometers (5.43 million square miles). January extent was 760,000 square kilometers (293,000 square miles) less than for the 1979 to 2000 average, and 310,000 square kilometers (120,000 square miles) greater than for January 2007.

During the month of January, Arctic sea ice extent increased by 1.12 million square kilometers (440,000 square miles), an average increase of 36,000 square kilometers (13,900 square miles) per day.

Graph with months on x axis and extent on y axisFigure 2. The graph above shows daily sea ice extent.The solid blue line indicates 2008–2009; the dashed green line shows 2006–2007 (the record-low summer minimum occurred in 2007); and the solid gray line indicates average extent from 1979 to 2000. Sea Ice Index data.
—Credit: National Snow and Ice Data Center
High-resolution image

Conditions in context

While ice extent climbed through the month of January as a whole, the period from January 15 to 26 saw almost no increase in ice extent, appearing as a flattening in the line graph. Extent during this pause remained fairly steady at around 14.0 million square kilometers (5.4million square miles).

chart showing january extentFigure 3. Monthly January ice extent for 1979 to 2009 shows 2009 as the sixth lowest January on record.
—Credit: National Snow and Ice Data Center
High-resolution image

January 2009 average extent compared to past Januaries

Average ice extent for January 2009 was the sixth lowest in the satellite record. January 2006 had the lowest ice extent for the month; January 2005 claims second place; and January 2007 is in third place. Including 2009, the downward linear trend in January ice extent stands at -3.1% per decade.

Map showing arctic air temperature anomolies in bright colors

Figure 4. This map compares ice extent on January 15 to ice extent on January 26, 2009. Areas in red indicate where ice was present on January 15 but had disappeared by January 26; areas in green indicate where ice was not present on January 15 but had appeared by January 26. Note in particular the regional balance between reduced ice extent in parts of the Arctic and increased extent in others. Sea Ice Index data.

—Credit: National Snow and Ice Data Center

High-resolution image

A balancing act of regional growth and decline

The pause in total sea ice extent change from January 15 to 26 reflects expanding and declining ice extent in different areas of the Arctic. For example, ice extent increased southwest of Greenland but decreased in areas east of Greenland and in parts of the Barents Sea.

This regional variability of sea ice extent as seen from satellites gives the bird’s-eye view of the changeable conditions on the ground that Arctic residents must deal with. One Arctic community may note increased sea ice extent, while at the same time another community not far away may note decreased sea ice extent.

Chart showing year-long extent lines for 1979-2000 average, 2007, and 2008Figure 5. The map of sea level pressure (in millibars) averaged over the Arctic for the period January 15 to 26, 2009, reveals one of the reasons for the pause in ice extent change—the strong low-pressure feature (blue and purple) centered just south of Iceland.
—Credit: From National Snow and Ice Data Center courtesy NOAA/ESRL Physical Sciences Laboratory
High-resolution image

The reason for the pause in January average ice extent change

The pause in ice extent change from January 15 to 26 is somewhat similar to an event that characterized part of December 2008. Both times, the cause for the pause was an unusual pattern of atmospheric circulation.

January 15 to 26 saw very strong low pressure centered just south of Iceland—a very strong Icelandic Low . In accord with Buys Ballot’s Law, strong warm winds from the south and southeast encouraged ice decline in areas east of Greenland and in parts of the Barents sea area. The winds helped compact the ice cover and reduce ice growth. Regional winds from the north explain the increases in ice extent southwest of Greenland.

This strong Icelandic Low was present at the same time that atmospheric pressures were especially high over the subtropical North Atlantic. This large-scale pattern of atmospheric pressure and the regional pattern of changes in ice extent on the Atlantic side of the Arctic are classic signals of the positive phase of the North Atlantic Oscillation (NAO). The negative phase would have a weaker Icelandic Low, and roughly the inverse pattern of sea ice extent anomalies (the red and green in Figure 4 would be approximately reversed). The NAO has climate impacts not just in the Arctic, but in North America and Europe as well.

References

Rigor, I. G., J. M. Wallace, and R. L. Colony. 2002. Response of Sea Ice to the Arctic Oscillation. AMS Journal of Climate Volume 15 Issue 18; 2648–2663.

For previous analysis, please see the drop-down menu under Archives in the right navigation at the top of this page.