By Jane Beitler
In 2012, NSIDC faced a challenge: how to unleash the creative potential of software development in the service of science. Scientists and informatics researchers needed better tools, while NSIDC software developers wanted to stretch their coding skills and work with data in innovative ways. “We had this brilliant staff of researchers, an enormous amount of data, and tech-savvy software developers,” Erik Jasiak, head of NSIDC software development, said, “but the three weren’t coming together on new ideas.” Nobody was speaking the same language. “It was a war of abbreviations,” Jasiak said. “The researchers didn’t understand new technologies, and the developers didn’t feel they had permission to push the envelope. They all had the data, though,” he said. As well, the tight confines of scientific funding may afford little space for exploration of new technologies. How could developers find the chance to show researchers what those technologies could do?
Space for creativity
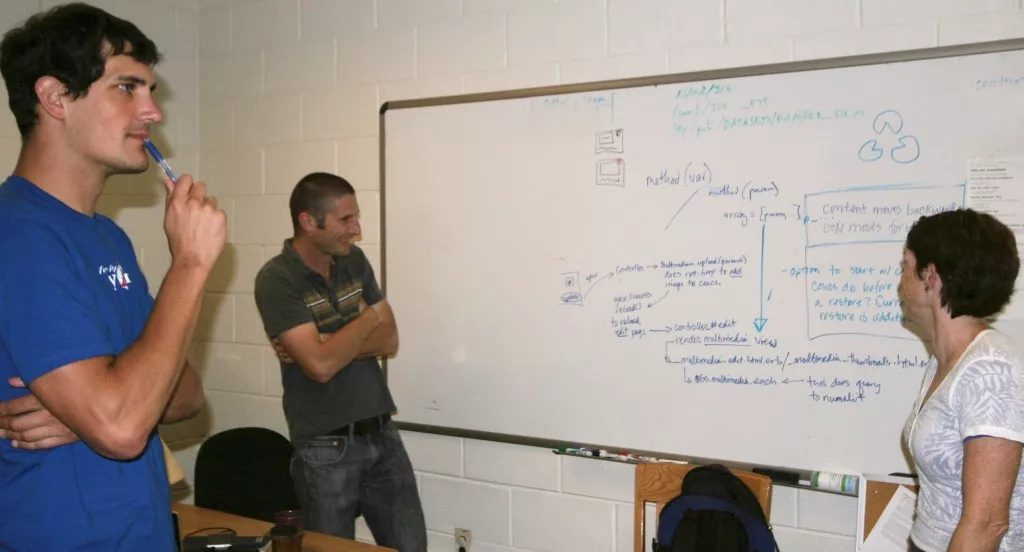
Jasiak gained agreement from NSIDC stakeholders to try a practice common with software industry leaders: software “hack” sessions, aka hackathons. Developers periodically get a small amount of free time to code and demonstrate a new technology. The concept is simple: give the developers a high-level goal and a little room to explore, and trust in their instincts.
NSIDC hackathon time is relatively small by industry standards, just one to two days each quarter per developer. Expectations are straightforward: participation is voluntary, the work must relate to NSIDC objectives, and a developer must always report back their results. They must either demonstrate a new technology relevant to science or informatics at NSIDC, or, just as valuable, discuss their learning experience on what technologies were problematic. Early hackathons revealed some of the gaps that needed to be bridged.
In one of the first hackathons, developer Hannah Wilcox demonstrated overlaying NSIDC sea ice data sets in new mapping technologies. Scientists and analysts were impressed with the display, and what could be done with the format, but immediately began questioning the pixel colorations. “I kept having to tell people, ‘This is not a done deal,’” Wilcox said. “’It’s not even correct yet; it just shows up.’” But the conversation about new technologies and research was beginning.
Building collaboration
One year in, NSIDC hackathons are a growing success. One of the first projects teamed a relative newcomer to NSIDC, Kevin Beam, with an expert developer, Matt Savoie. Together, they produced an early version of an interactive Arctic sea ice extent chart (now live on the NSIDC Web site as Charctic ) in two days. “Matt knew the sea ice data, and had this idea for a Google finance chart for sea ice, and I knew the Ruby on Rails and JavaScript-fu [libraries] to make that work,” said Beam. “It was kind of perfect because we had the data, and Matt knew what he wanted it to look like. We just combined the knowledge and tools.” Charctic was an immediate hit with the NSIDC Arctic Sea Ice News and Analysis (ASINA) product team. "My first impression was 'Wow, this is so useful.’” said Walt Meier, a former NSIDC scientist (now with the NASA Goddard Cryospheric Sciences Lab). “We had always gotten comments from users asking to see specific years or other parts of the year than what we were showing at the time,” Meier said.
Now instead of scientists having to manually make the relevant plots, users can make their own plots. "It's addicting to play around with, even for someone as familiar with the data as I am," Meier said. "The flexibility is amazing. It's great be able to hone in on a specific time of year, look at the specific data values, even pull up images of a given day's sea ice." The hackathon program continues to generate a storehouse of new ideas, tools, and libraries to help scientists with their data. Just as in scientific research, even failed experiments can produce useful knowledge. For example, a few ideas turned out be too cumbersome to set up during a hackathon session, and are now noted as having potential ramp-up issues—invaluable knowledge as researchers put together proposals. The conversations between researchers and developers about what is possible, and what is useful, improve every time.


